


Trusted by global brands, retailers, distributors and suppliers

The Standard for Durables-Grade Market Data
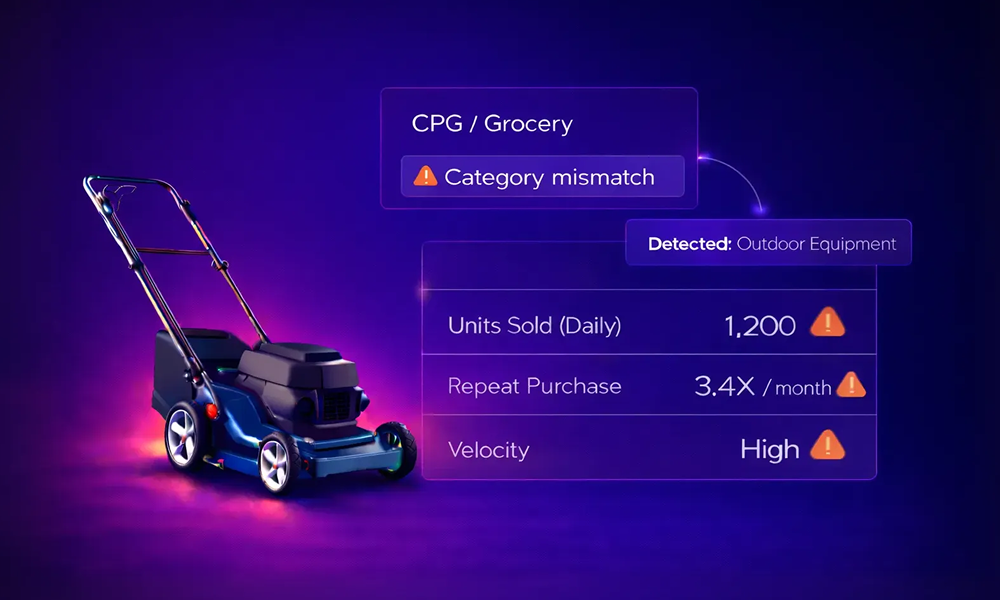
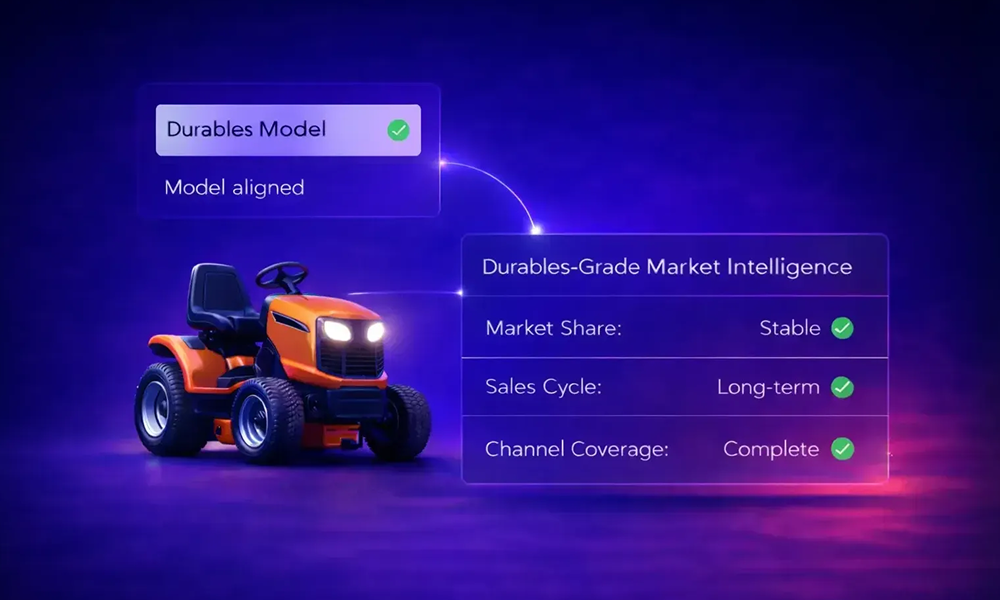
Durables markets do not behave like fast-moving CPG categories – and demand a different approach.
Limited POS, long purchase cycles, and fragmented retailer data mean generic tools built for non-durables often misrepresent the full picture, leaving critical gaps.
OpenBrand is built to close those gaps, providing clarity and context you can trust.
Combining advanced and multi-sourced modeling with real-time pricing and the industry’s only consumer tracking survey, our data constructs a complete, accurate view of what happened, why it happened, and what to do next.
OpenBrand Intelligence
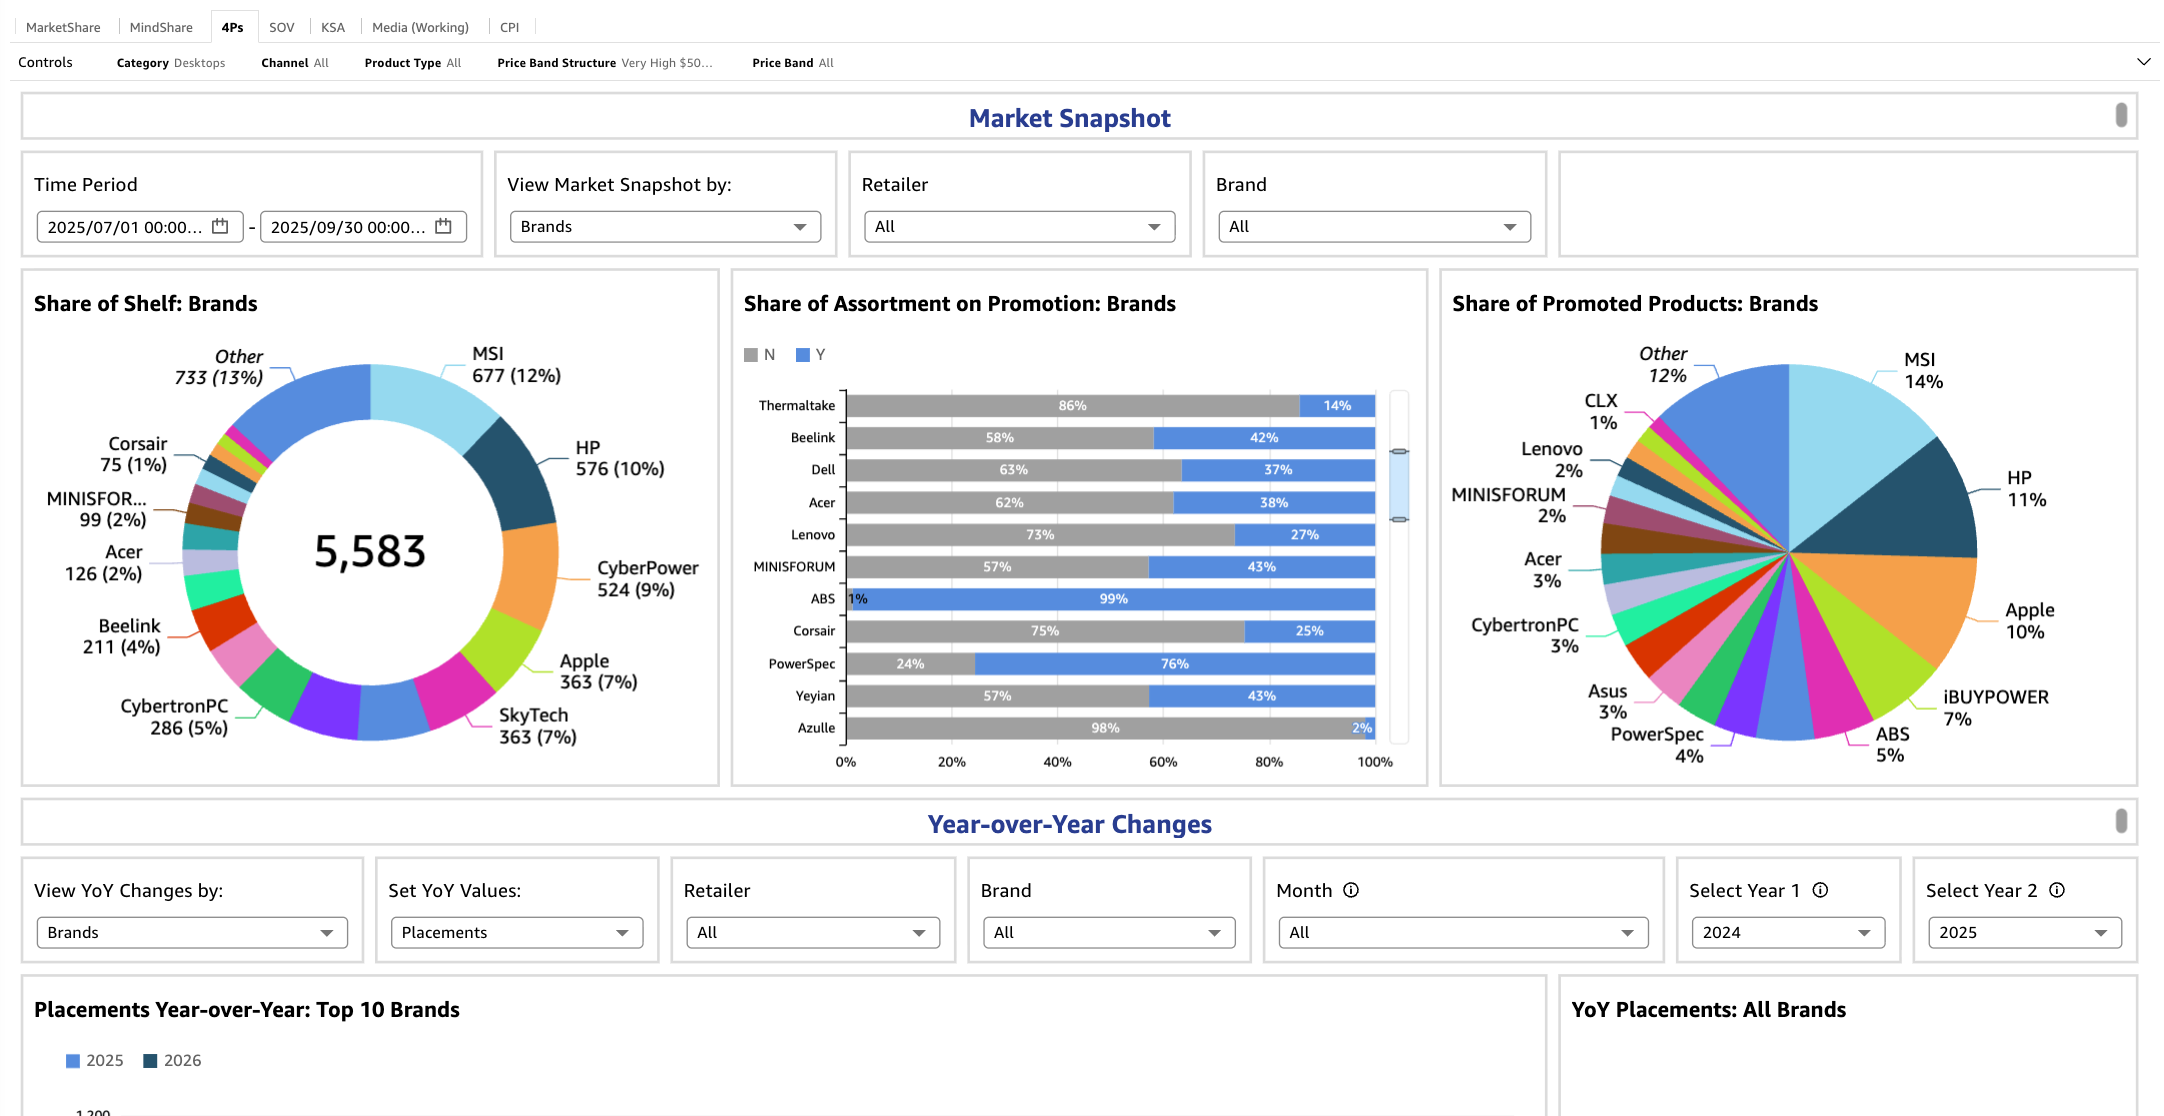
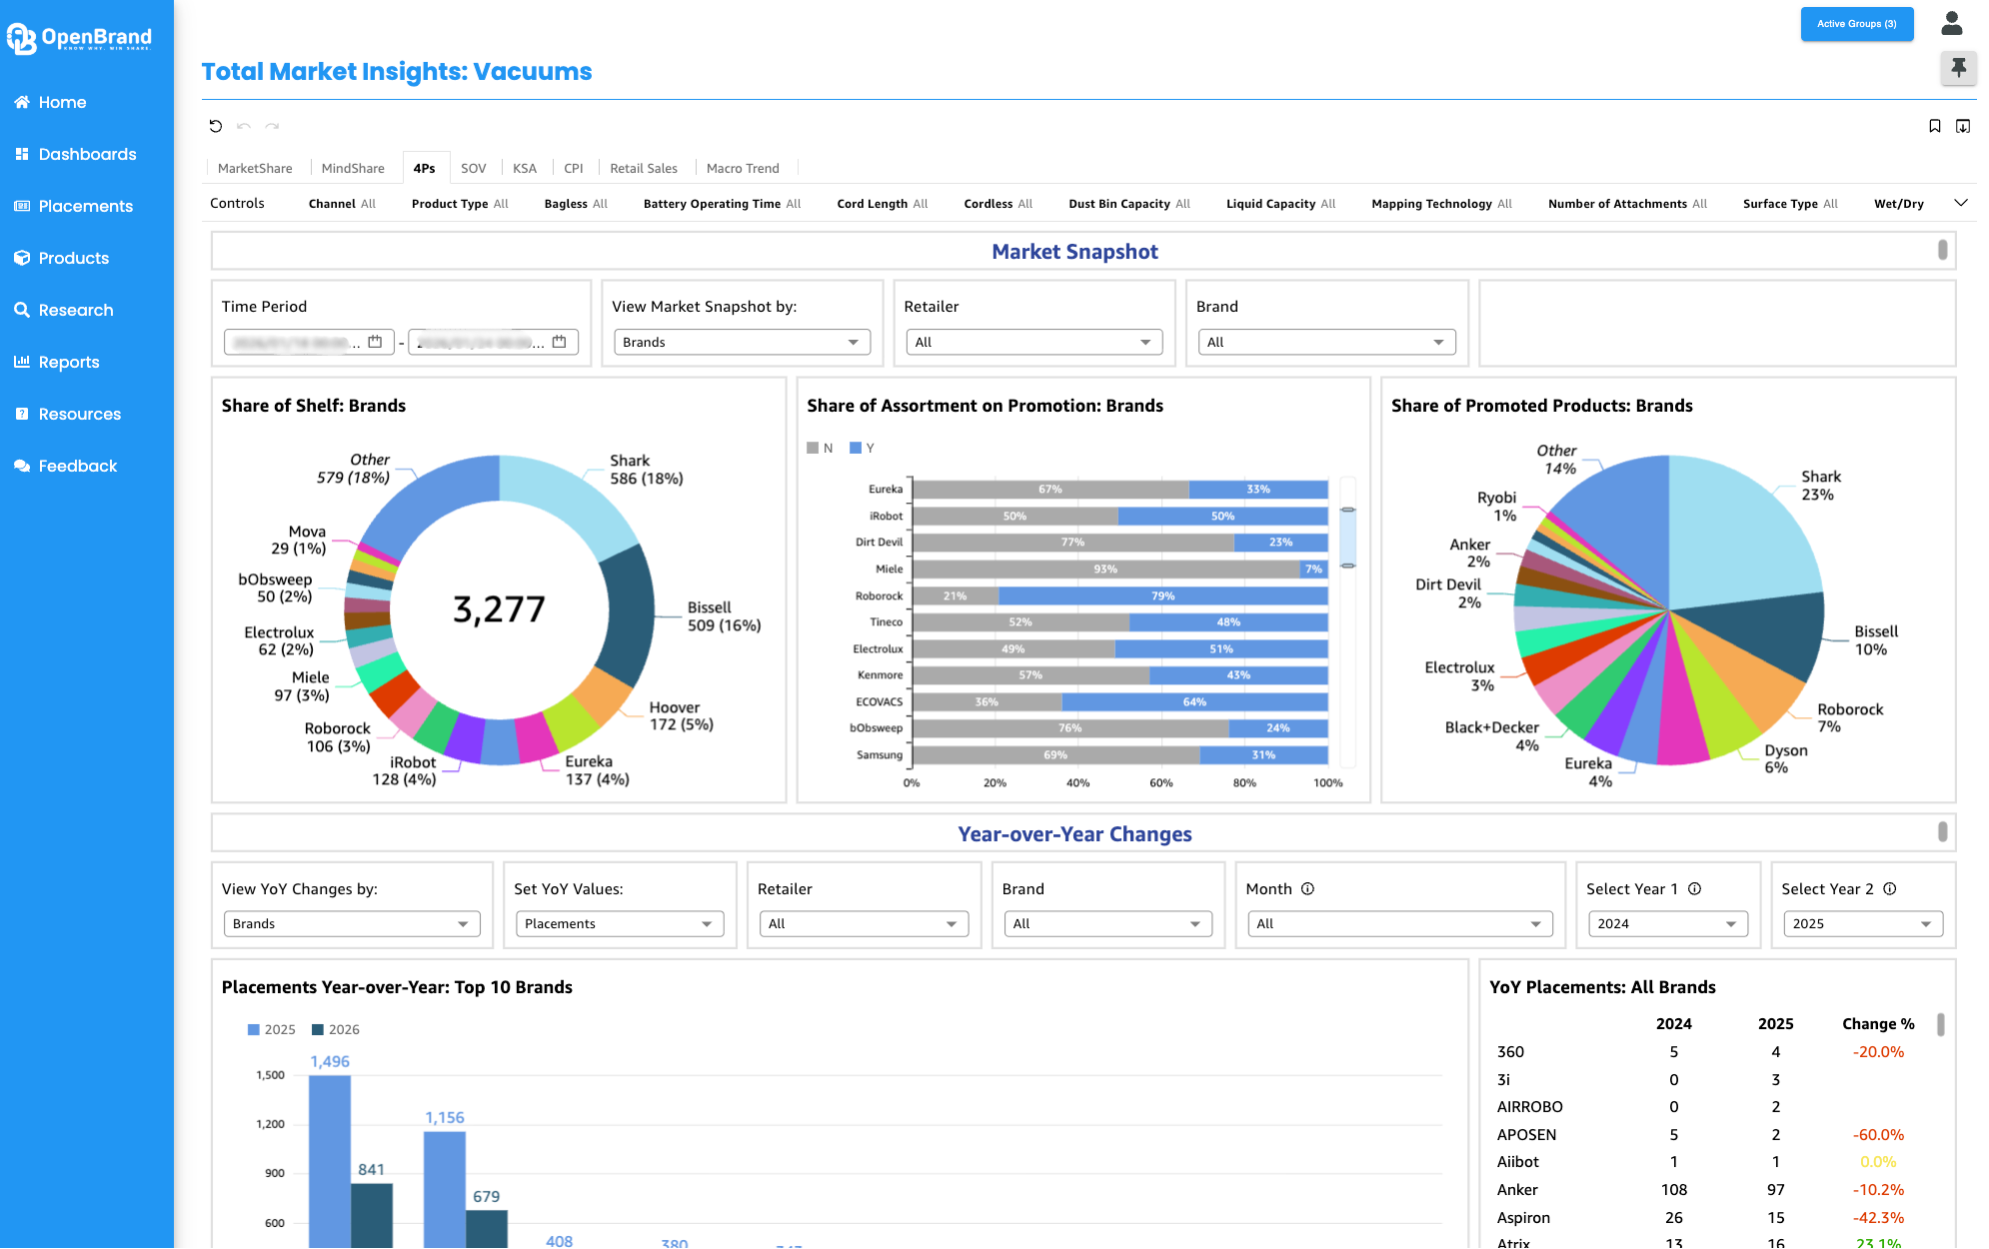
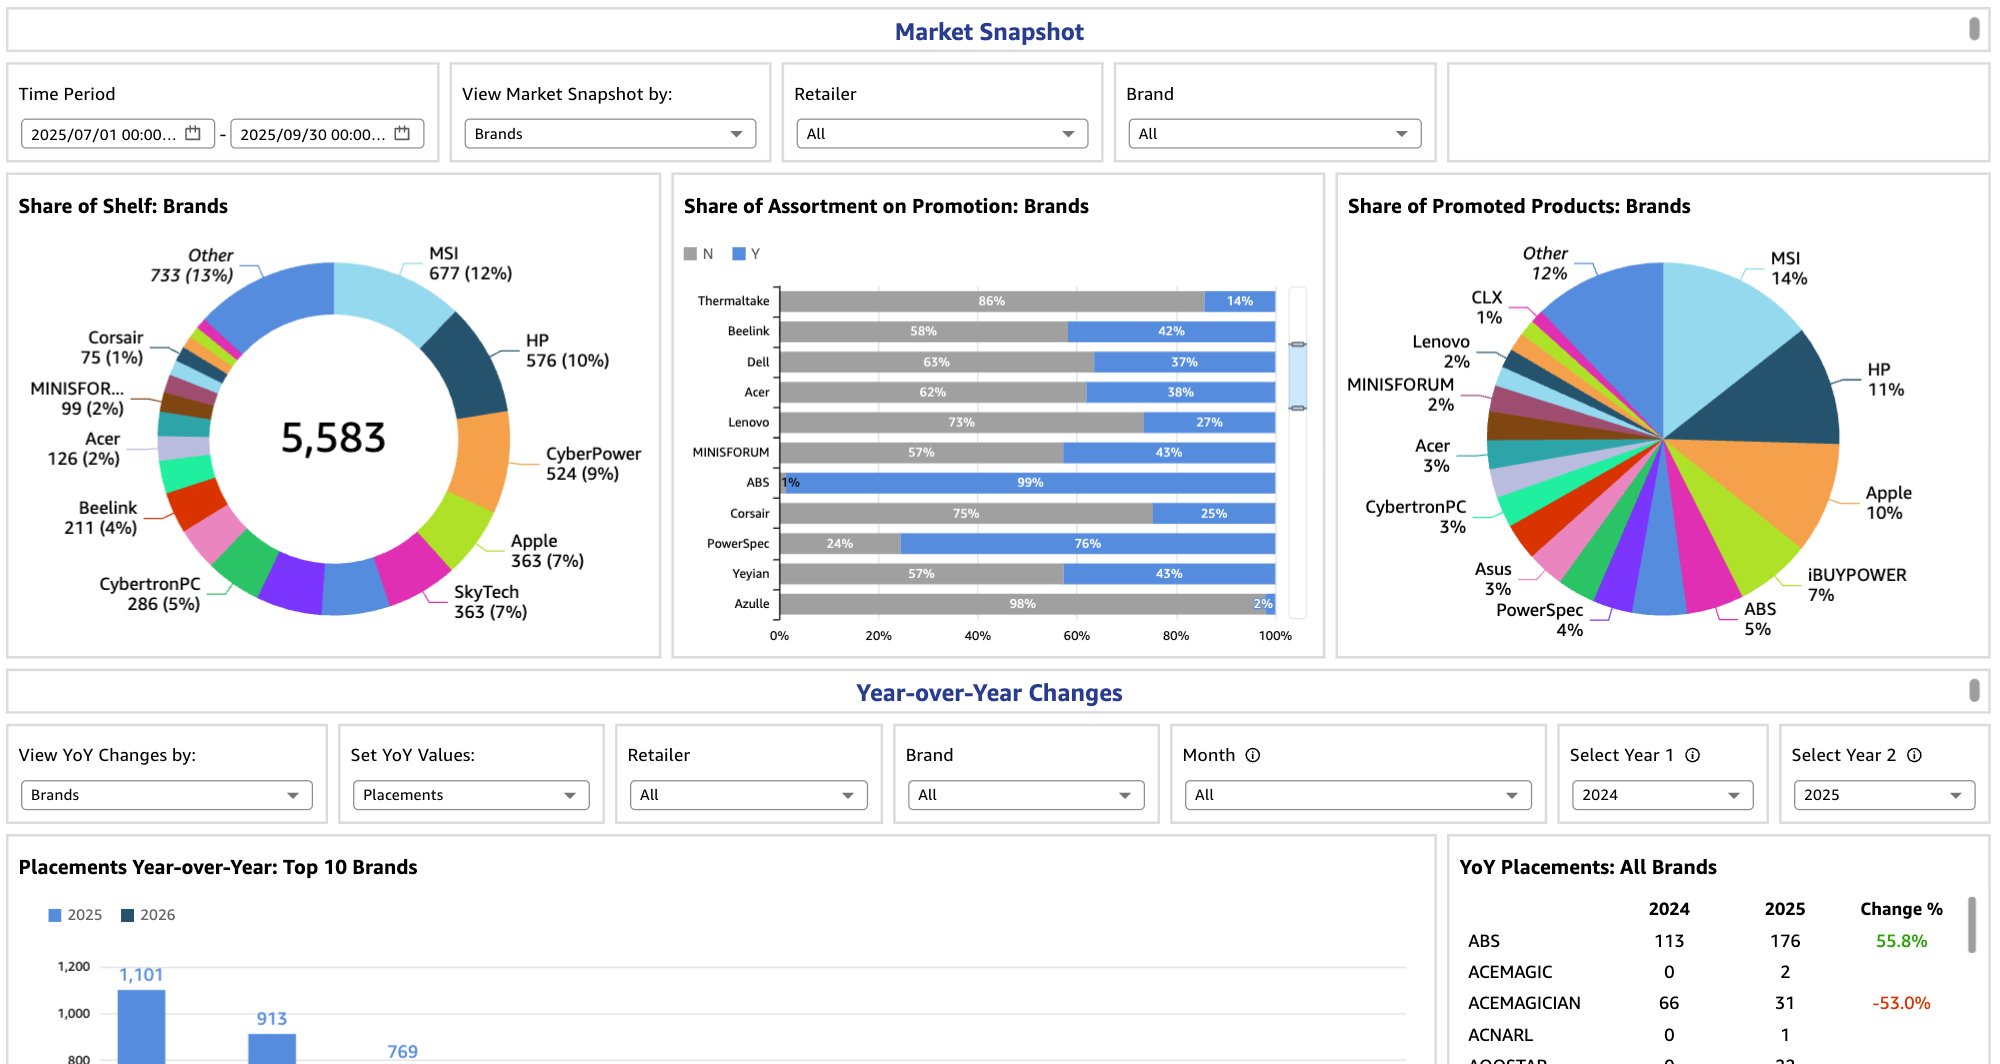
A 360° View of the Durables Market Landscape
922K
Products Tracked
3000+
Brands Covered
25+
Years of Data
14.8M
Shoppers Surveyed
Our Data Blueprint
OpenBrand is powered by six primary data sources – including four proprietary ones – that all feed into modeling that is built for the durables market, accounting for nuances that other providers miss.
In-StoreCollection

Consumer TrackingSurvey
ReceiptData
WebData
EconomicData
Web Traffic& Clickstream
In-Store Collection
Consumer Survey
Receipts
Web Data
Web Traffic, Clickstream
Economic Data
AI-Powered Data Processing & Modeling
+ Advanced Data Science | + Continuous Quality Assurance | + Calibration
Streamlined Into One Dashboard
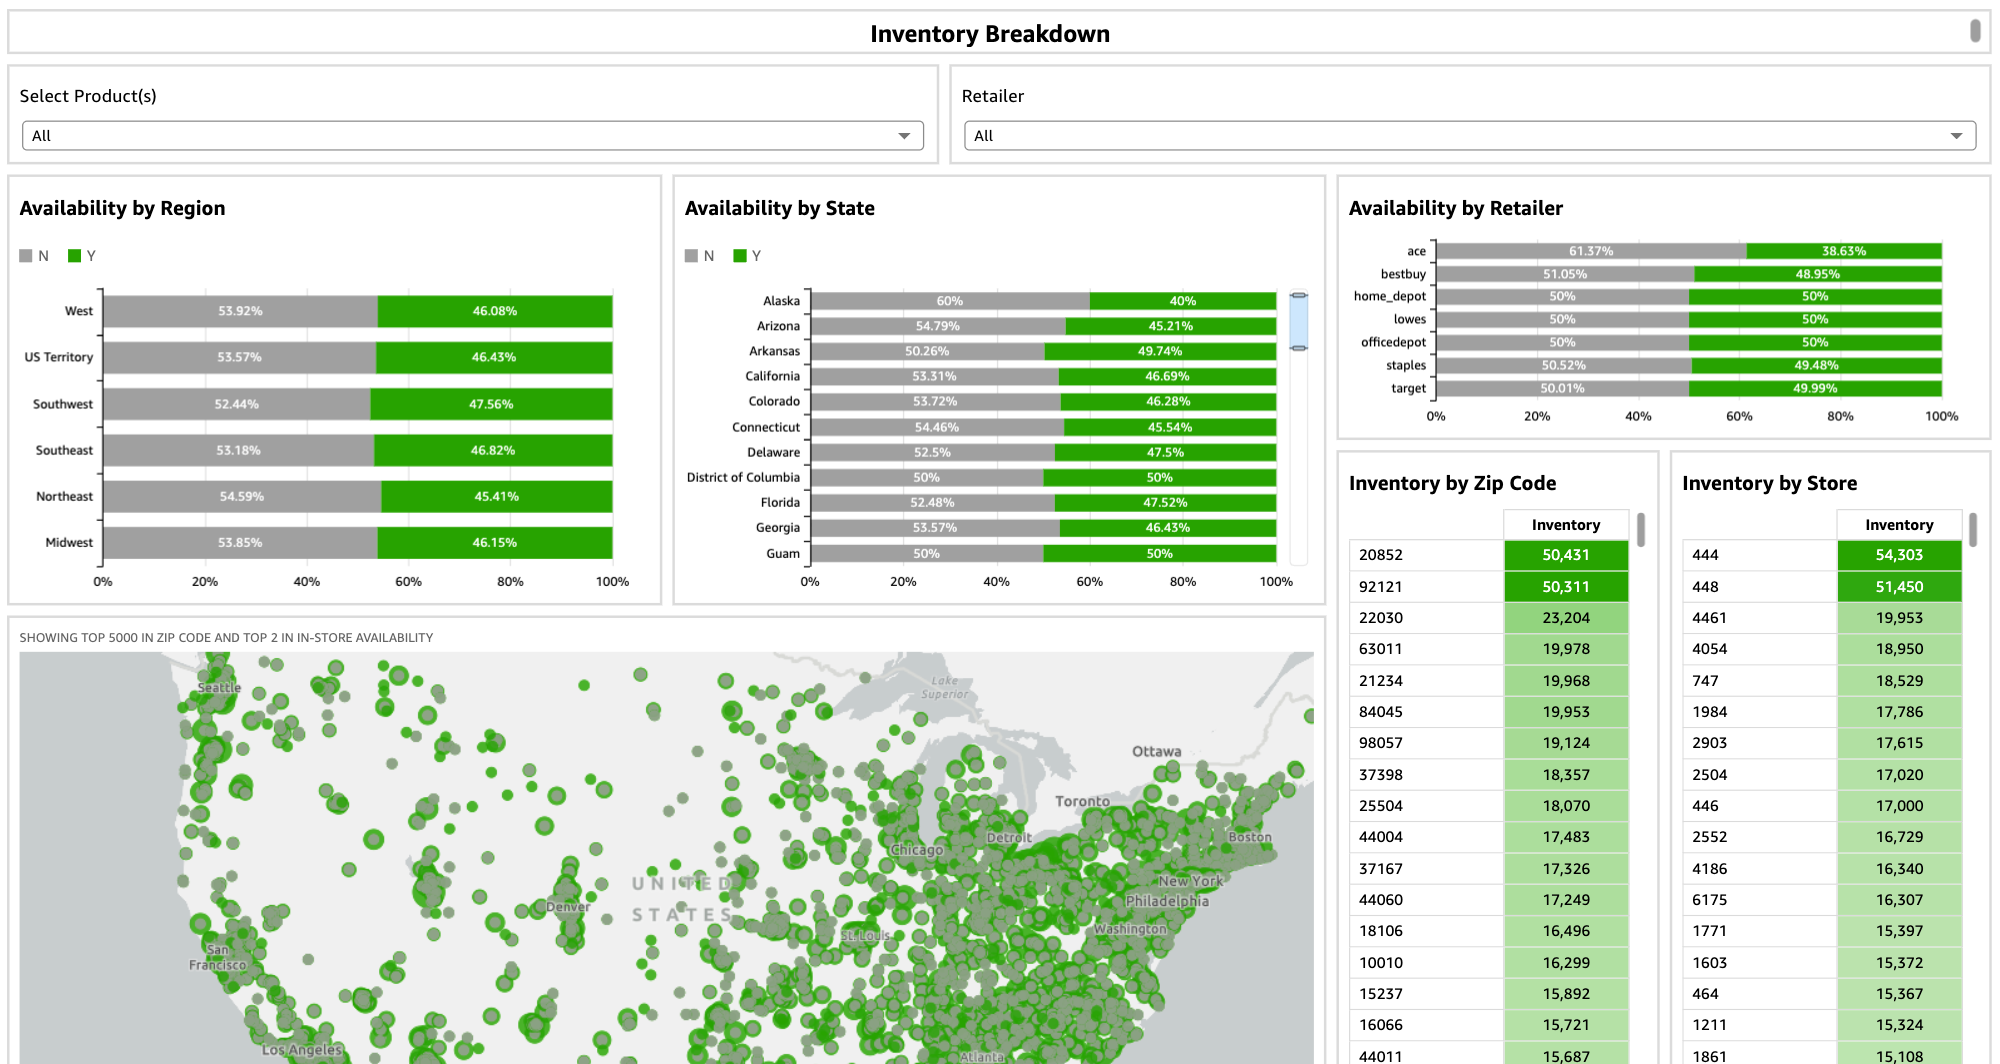
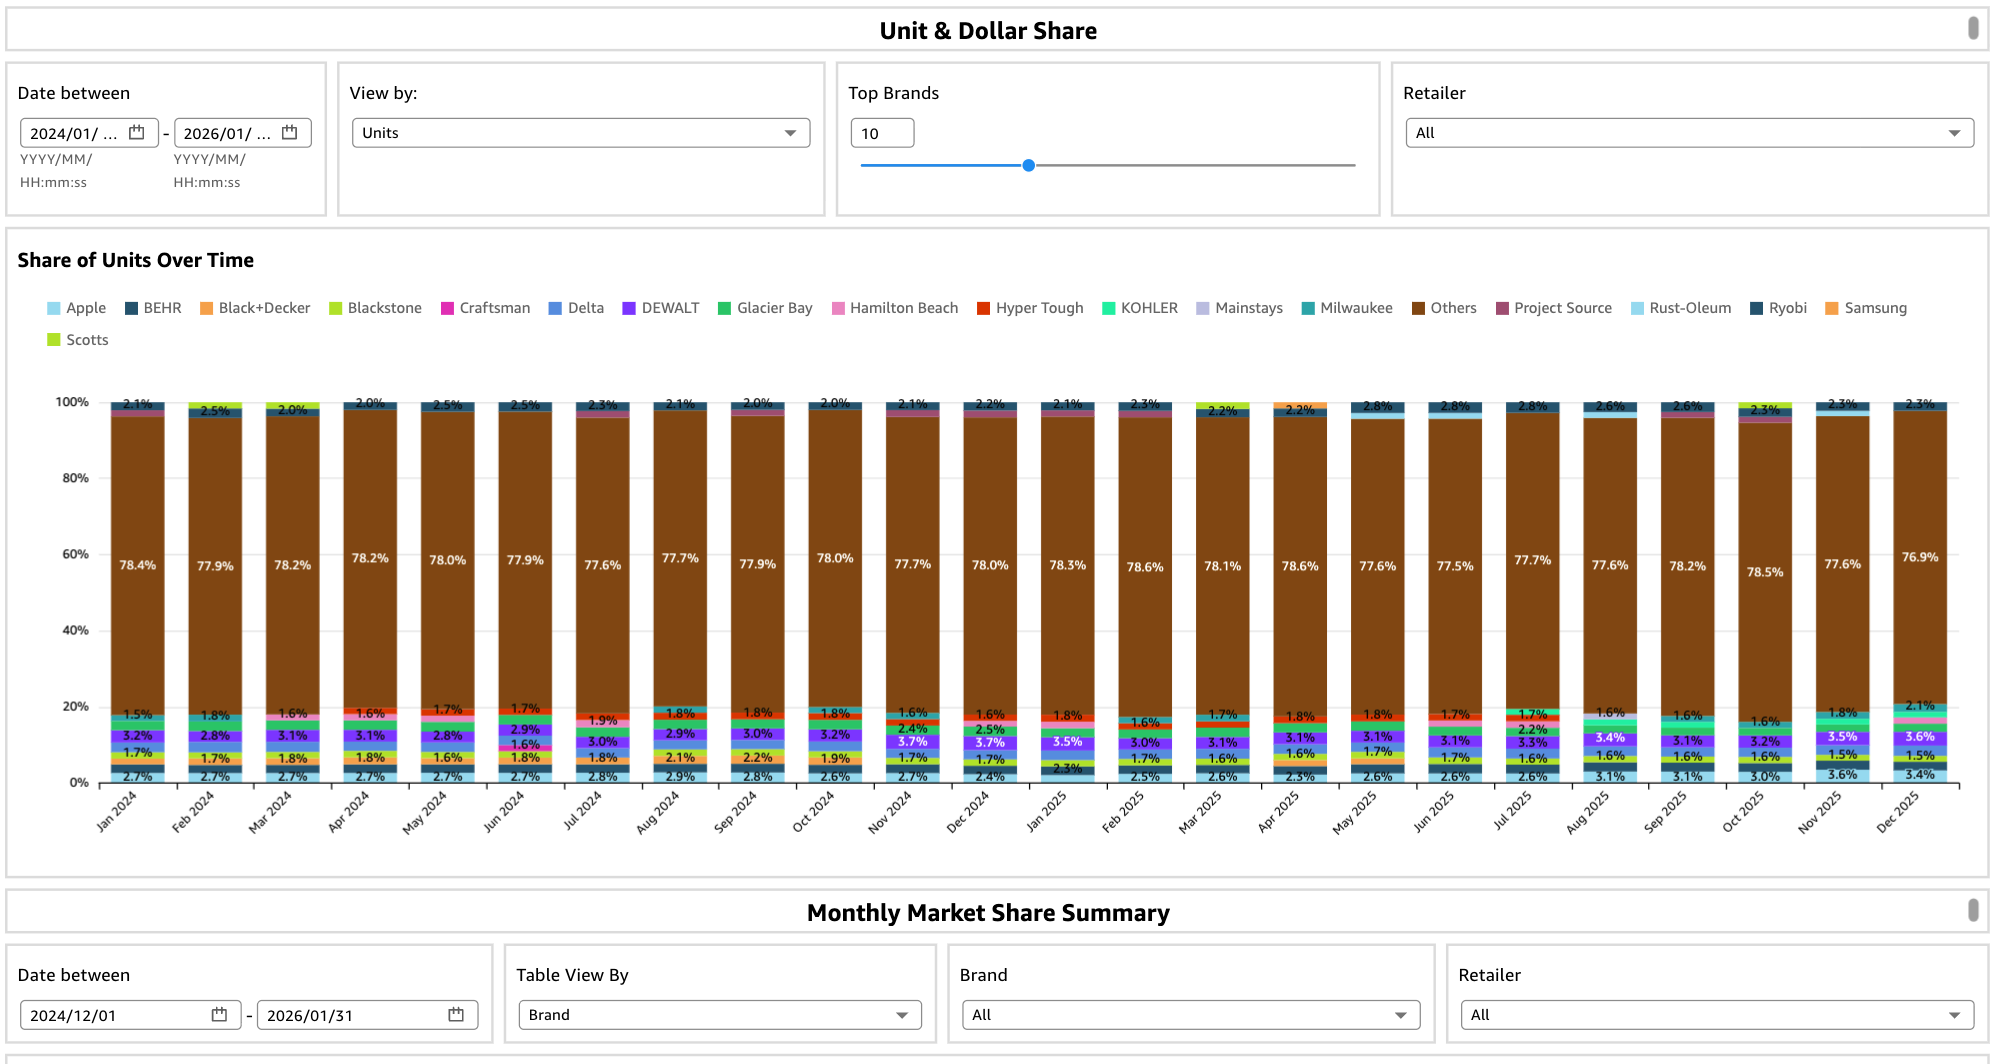
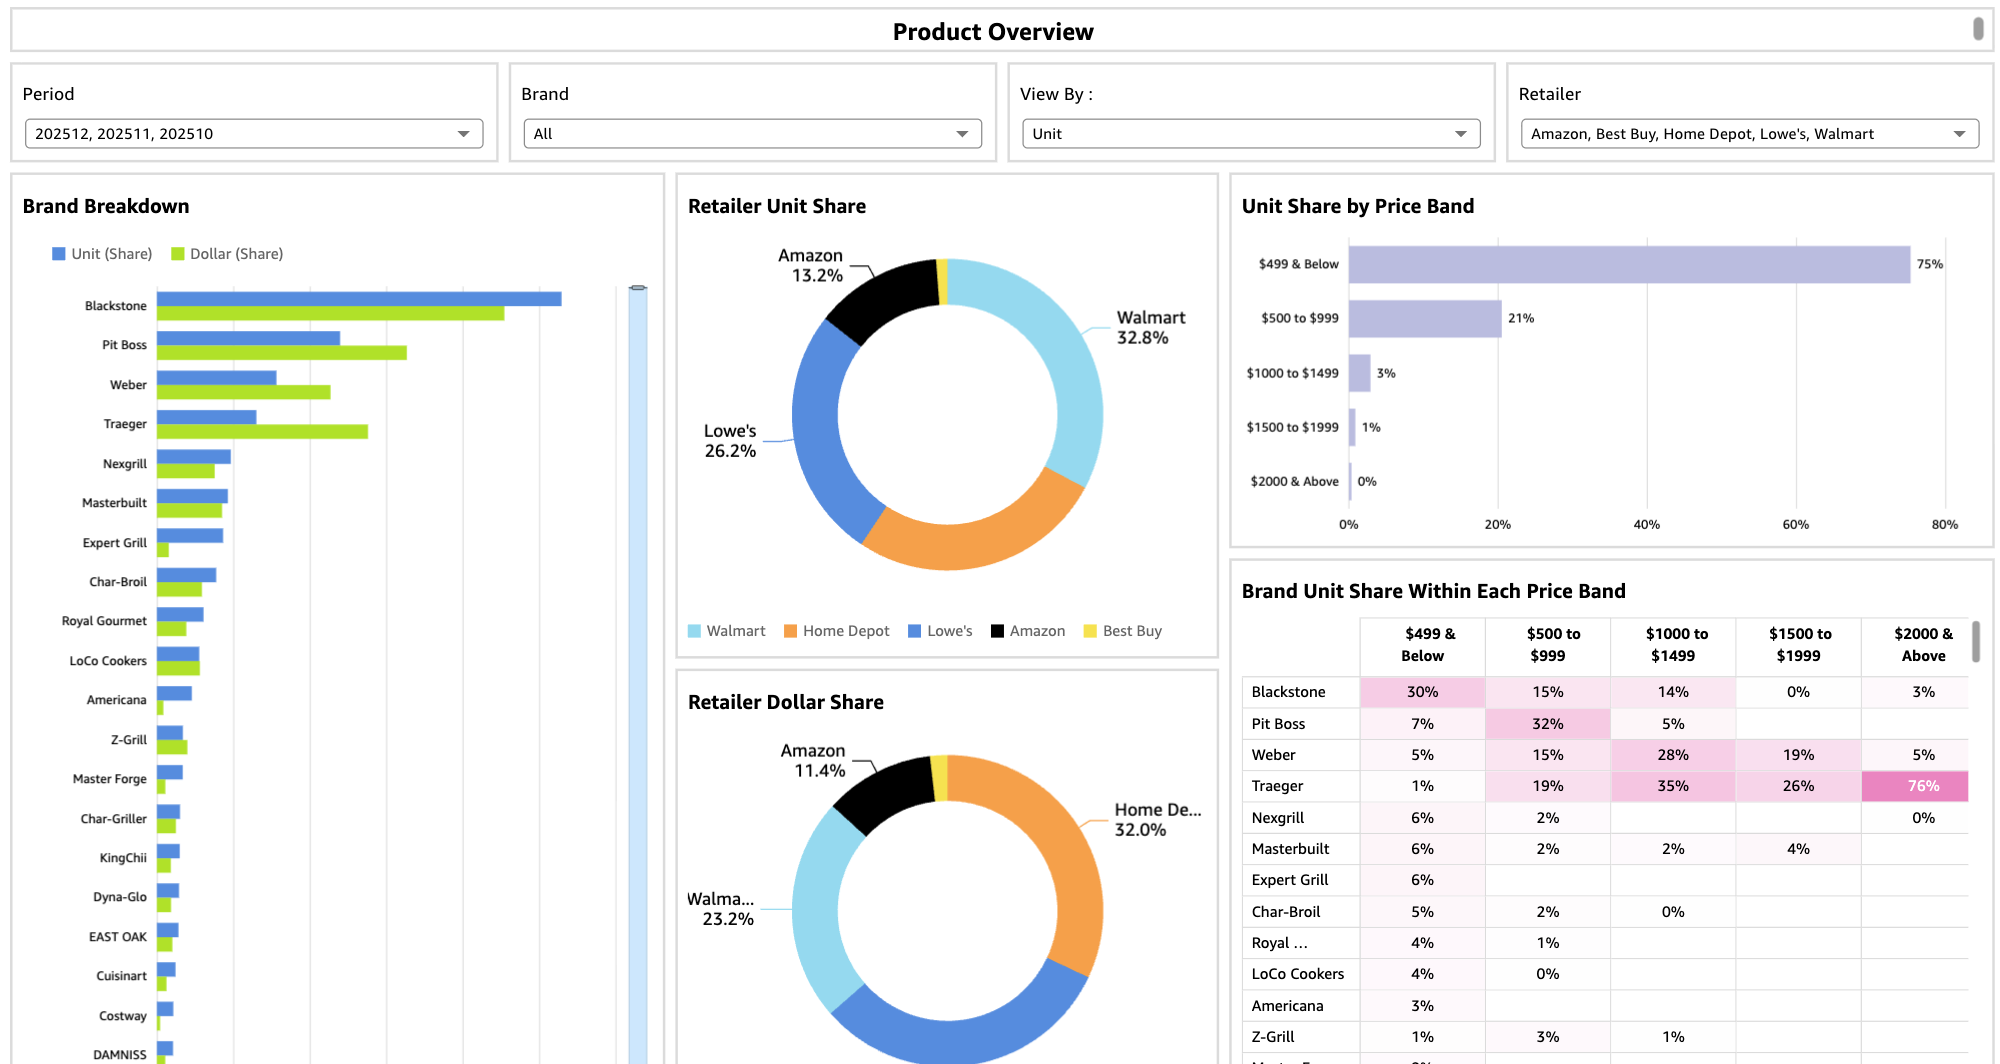
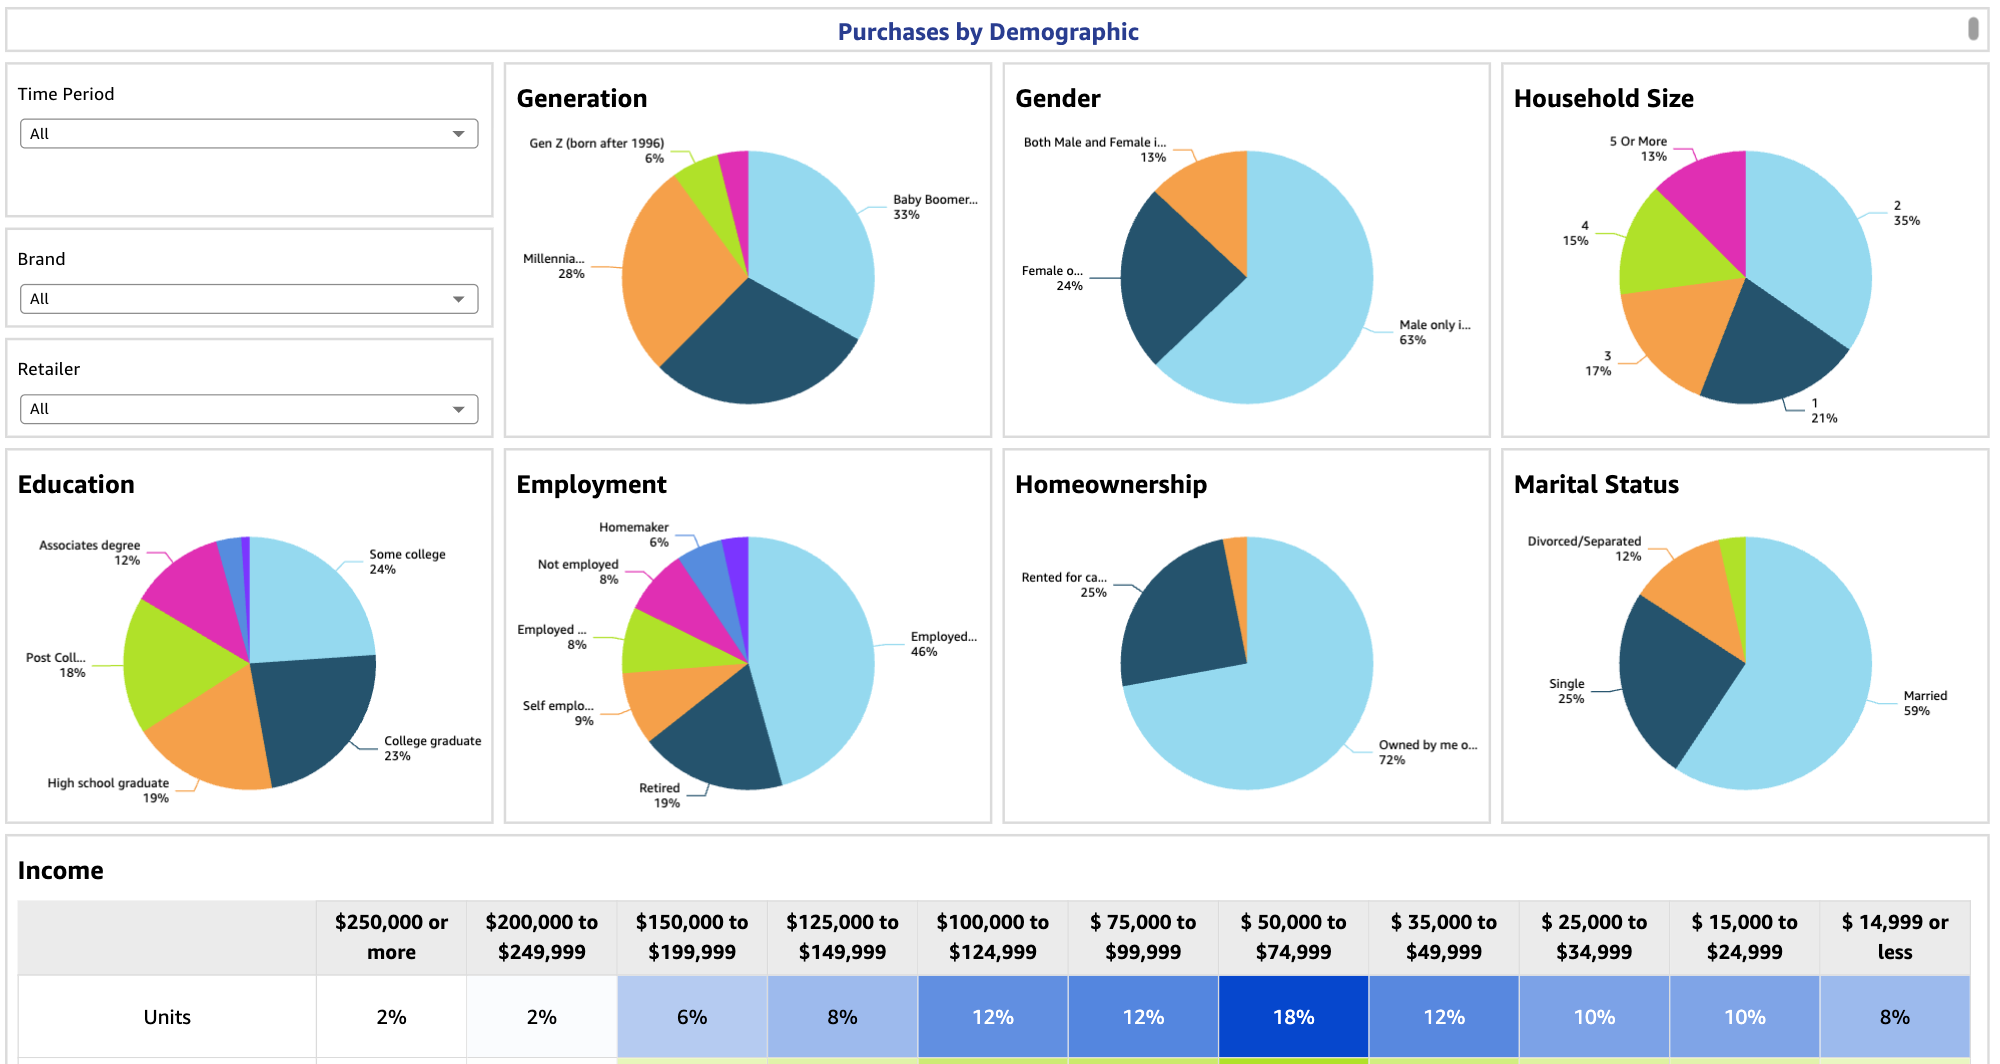
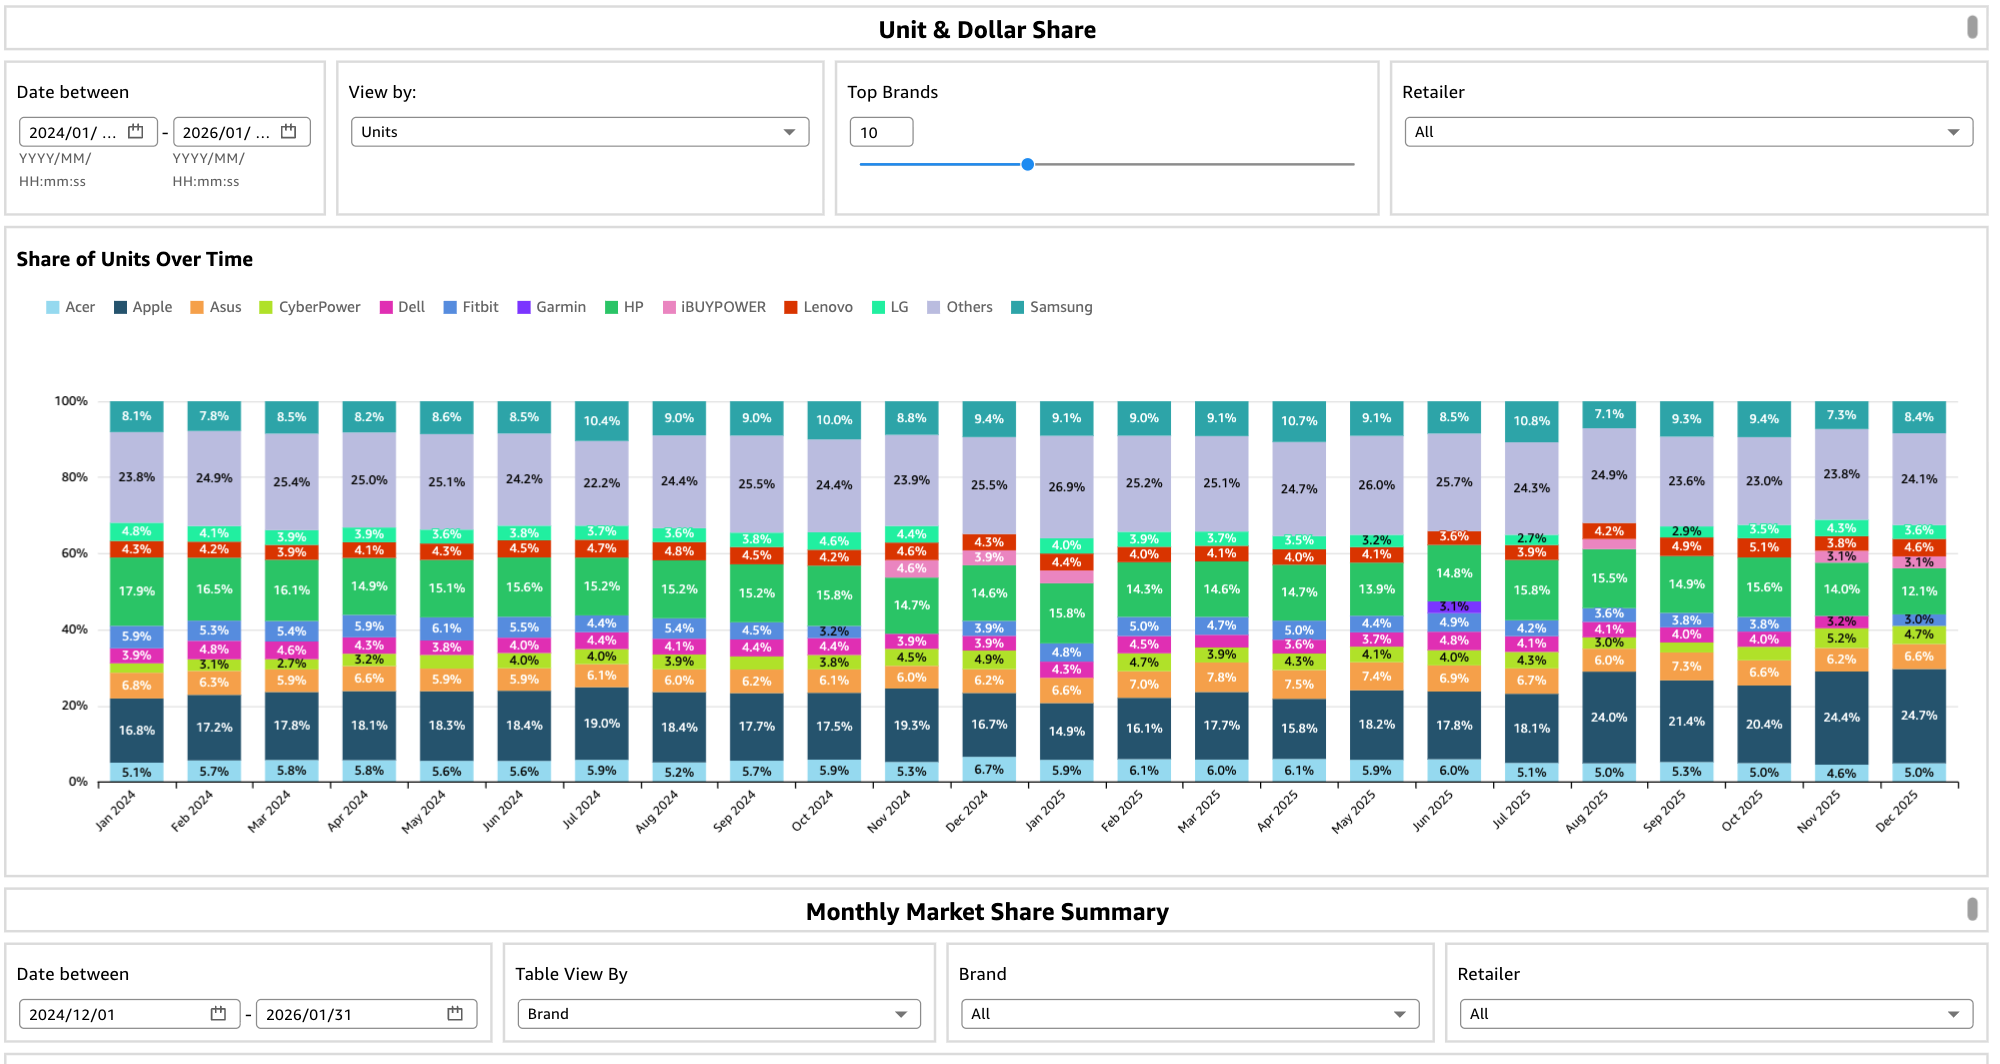
OpenBrand combines what durables shoppers do, say, and buy with how brands price, promote, and perform — all in one, connected Total Market Insights view — eliminating the need for multiple data sources across your business
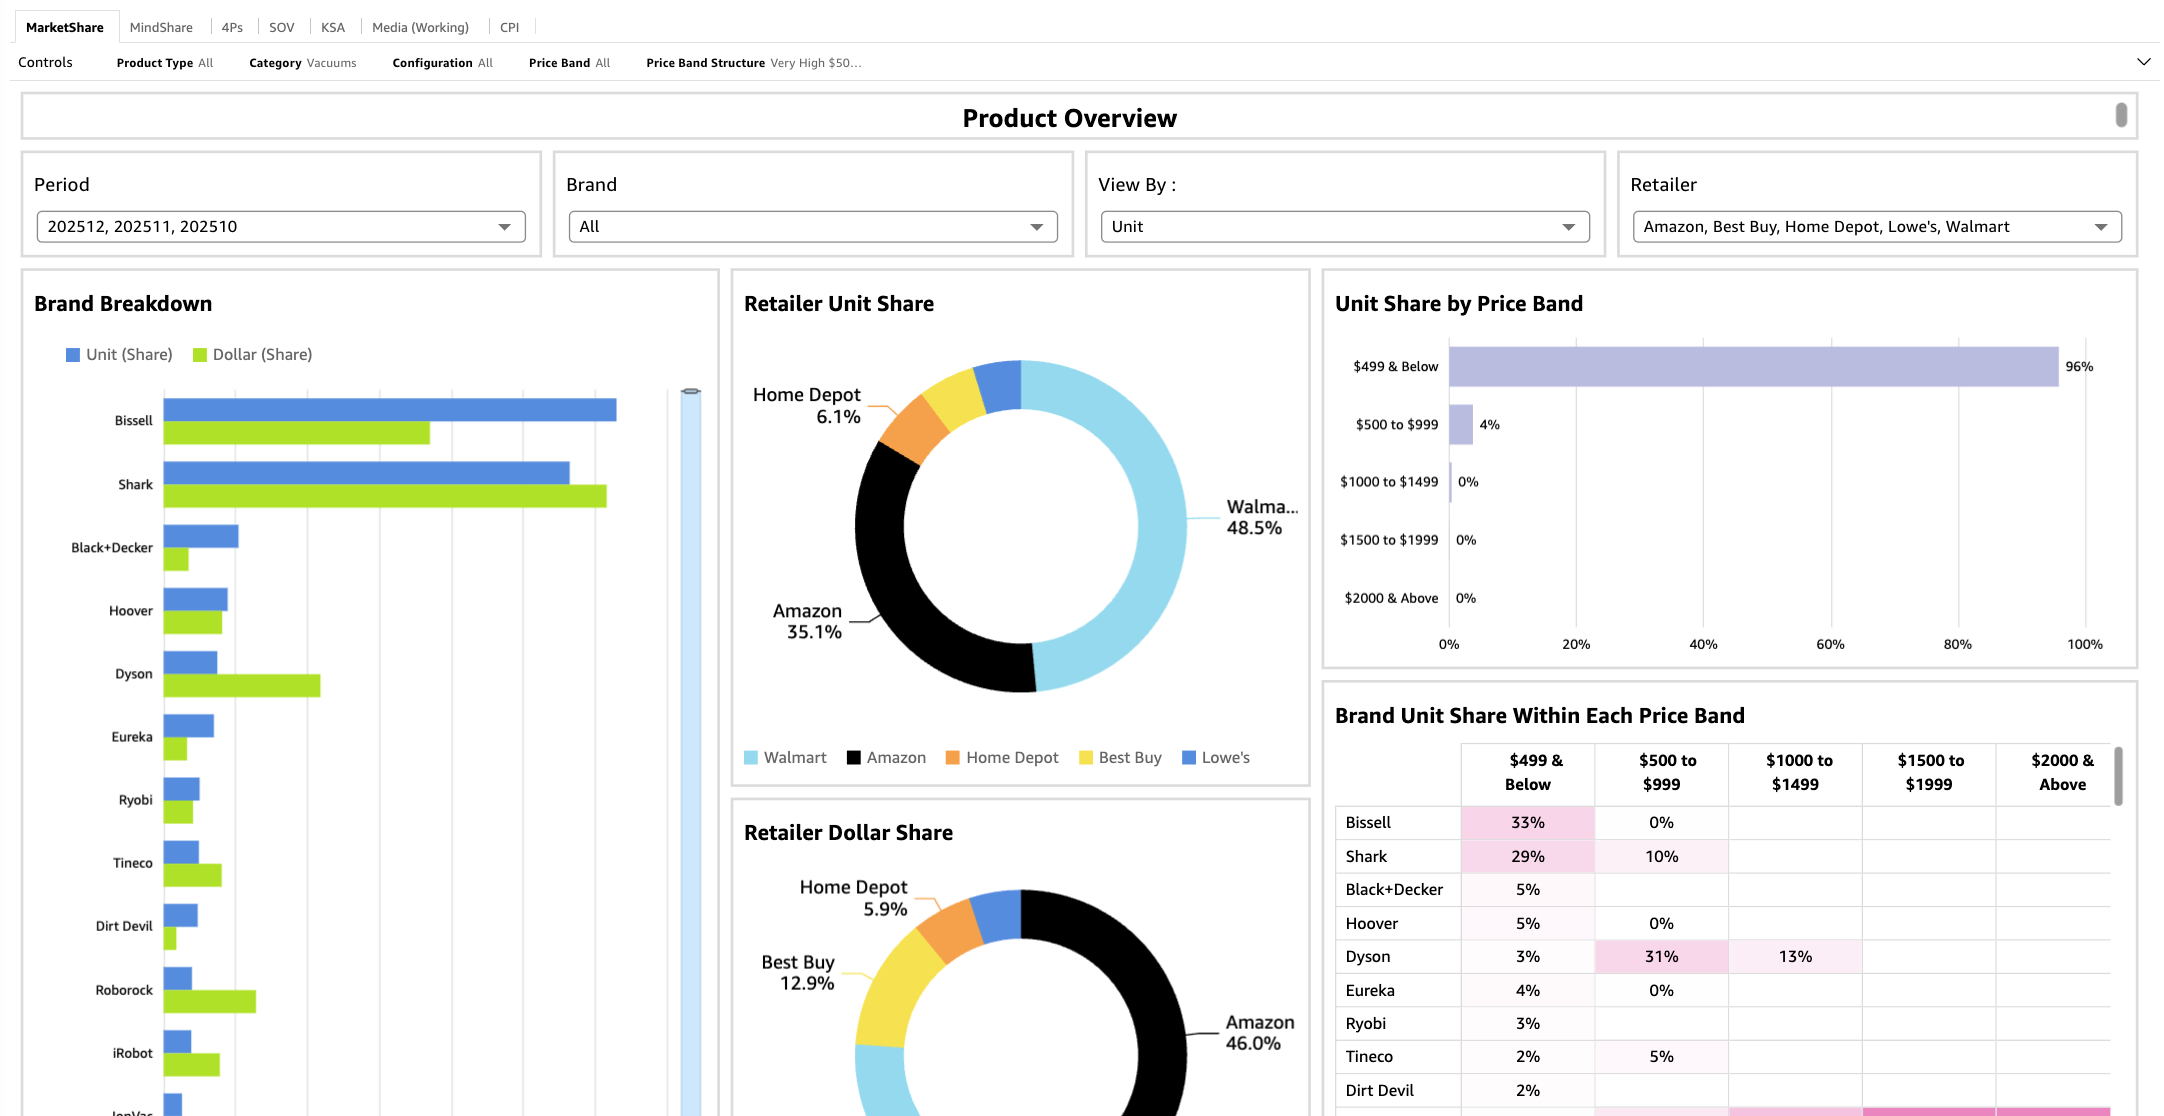
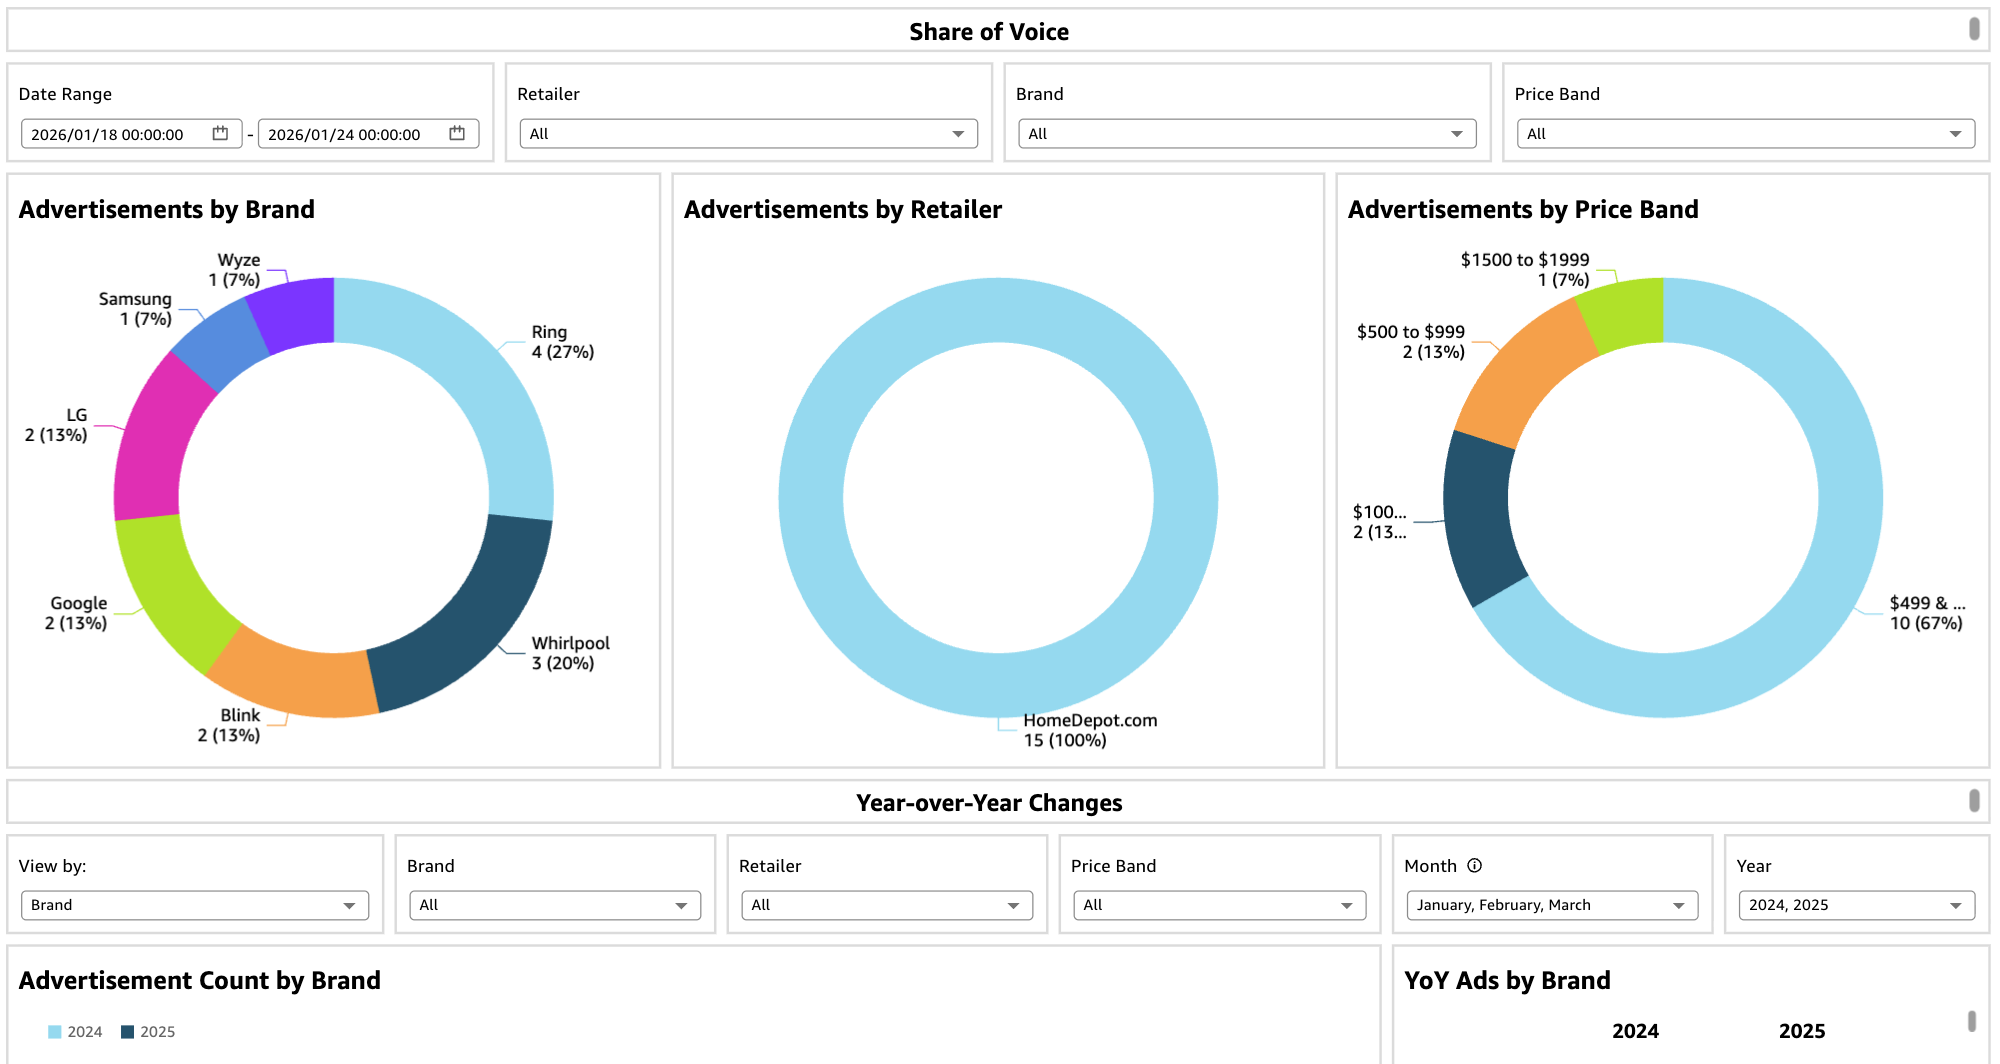
Market Share
Buyer Behavior
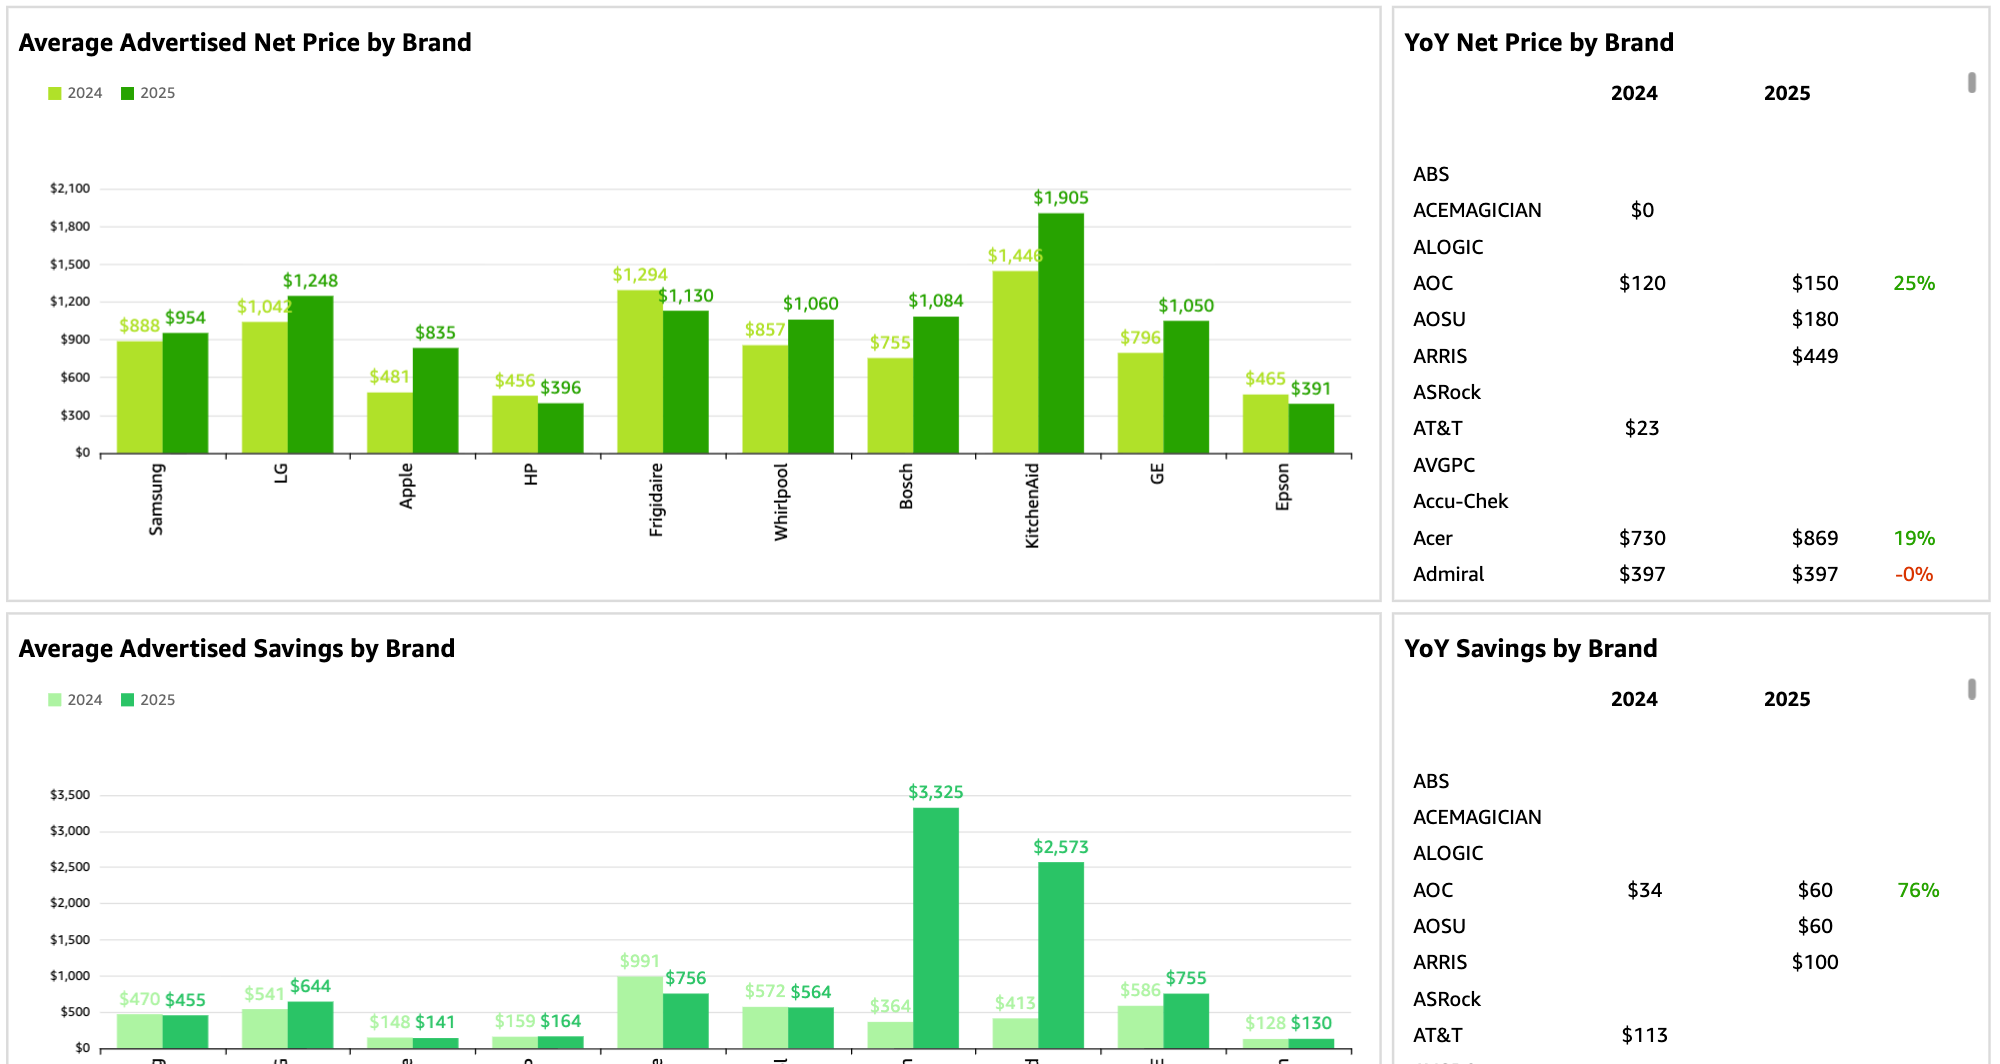
Pricing & Promotions
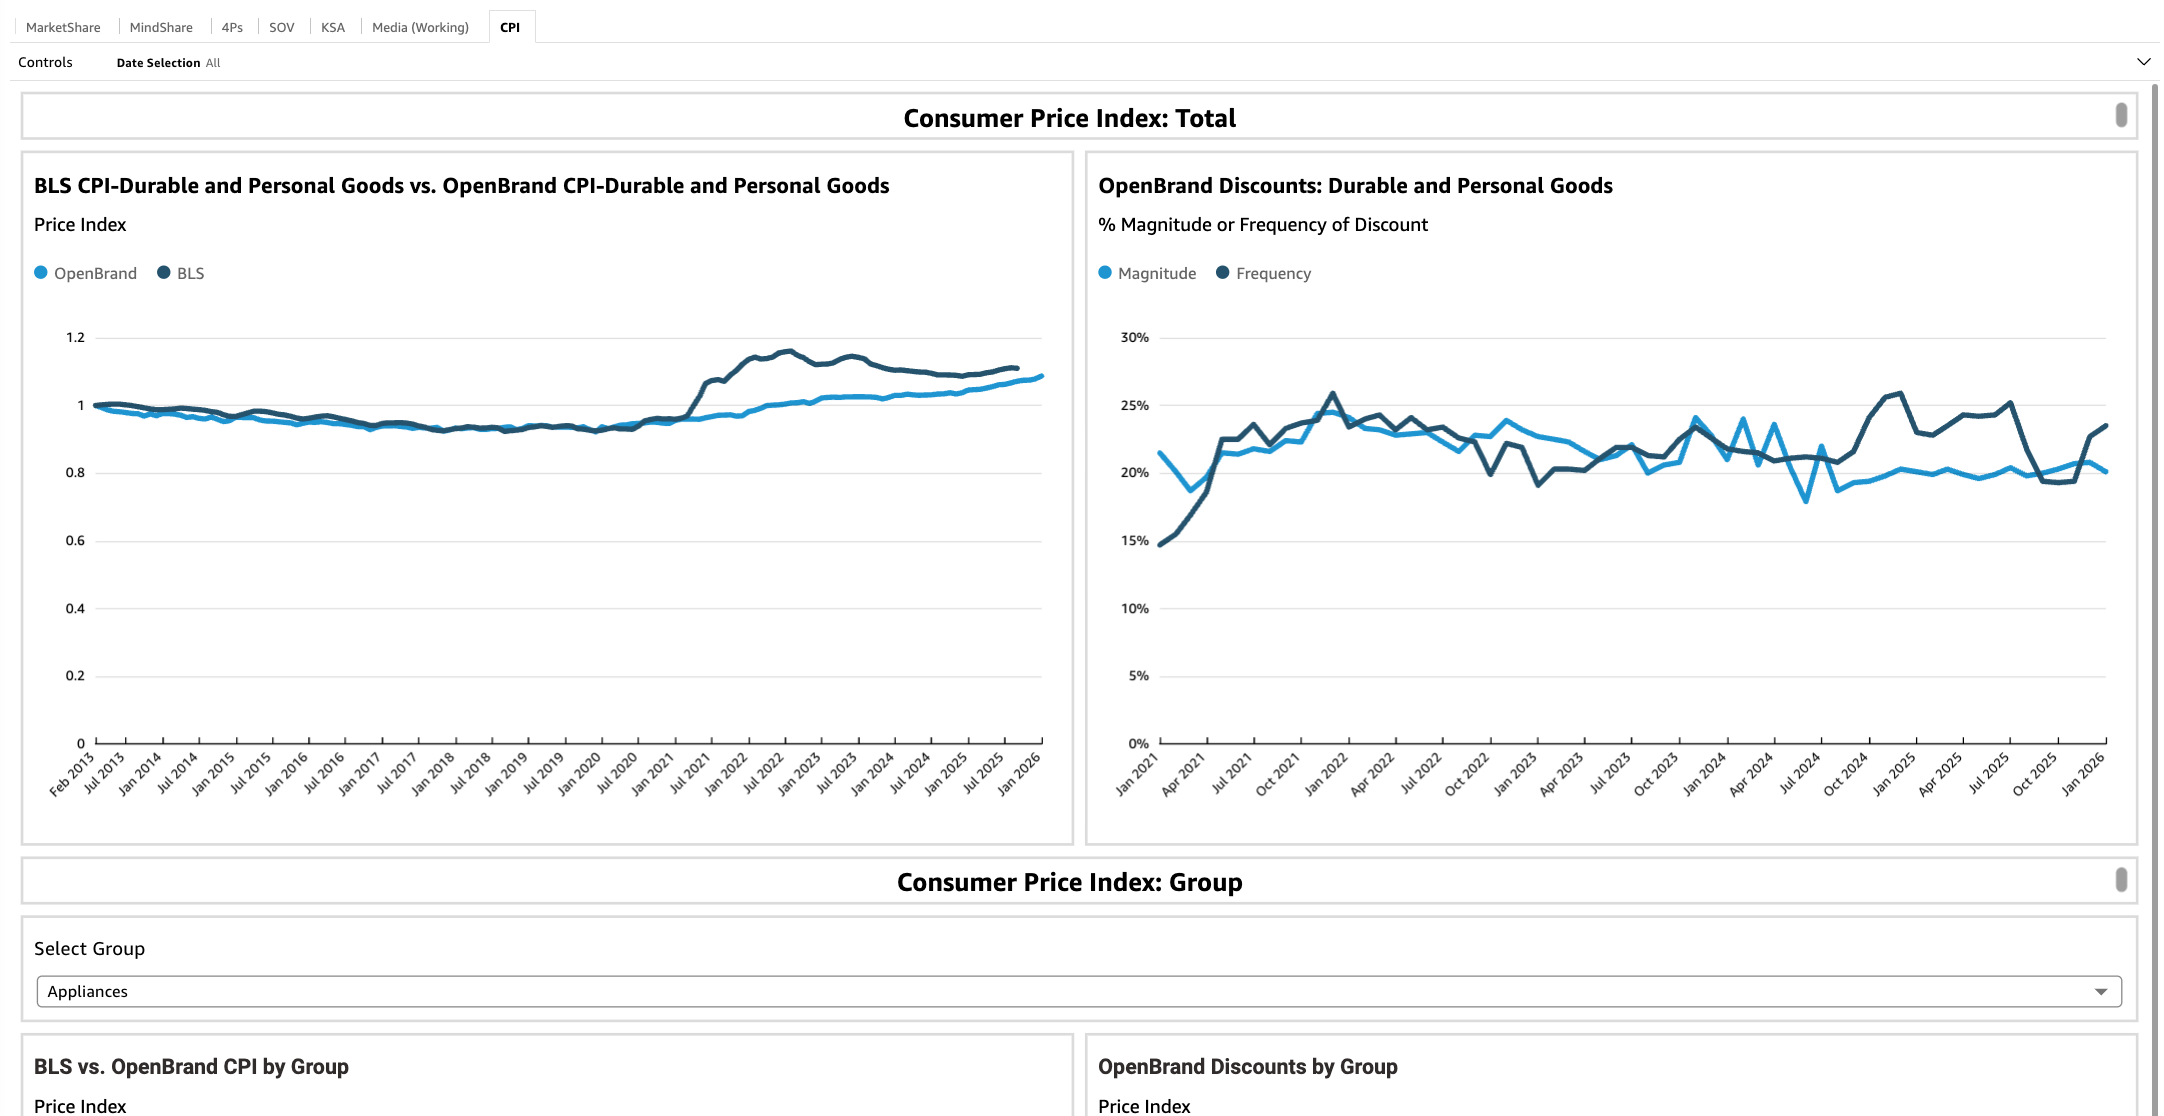
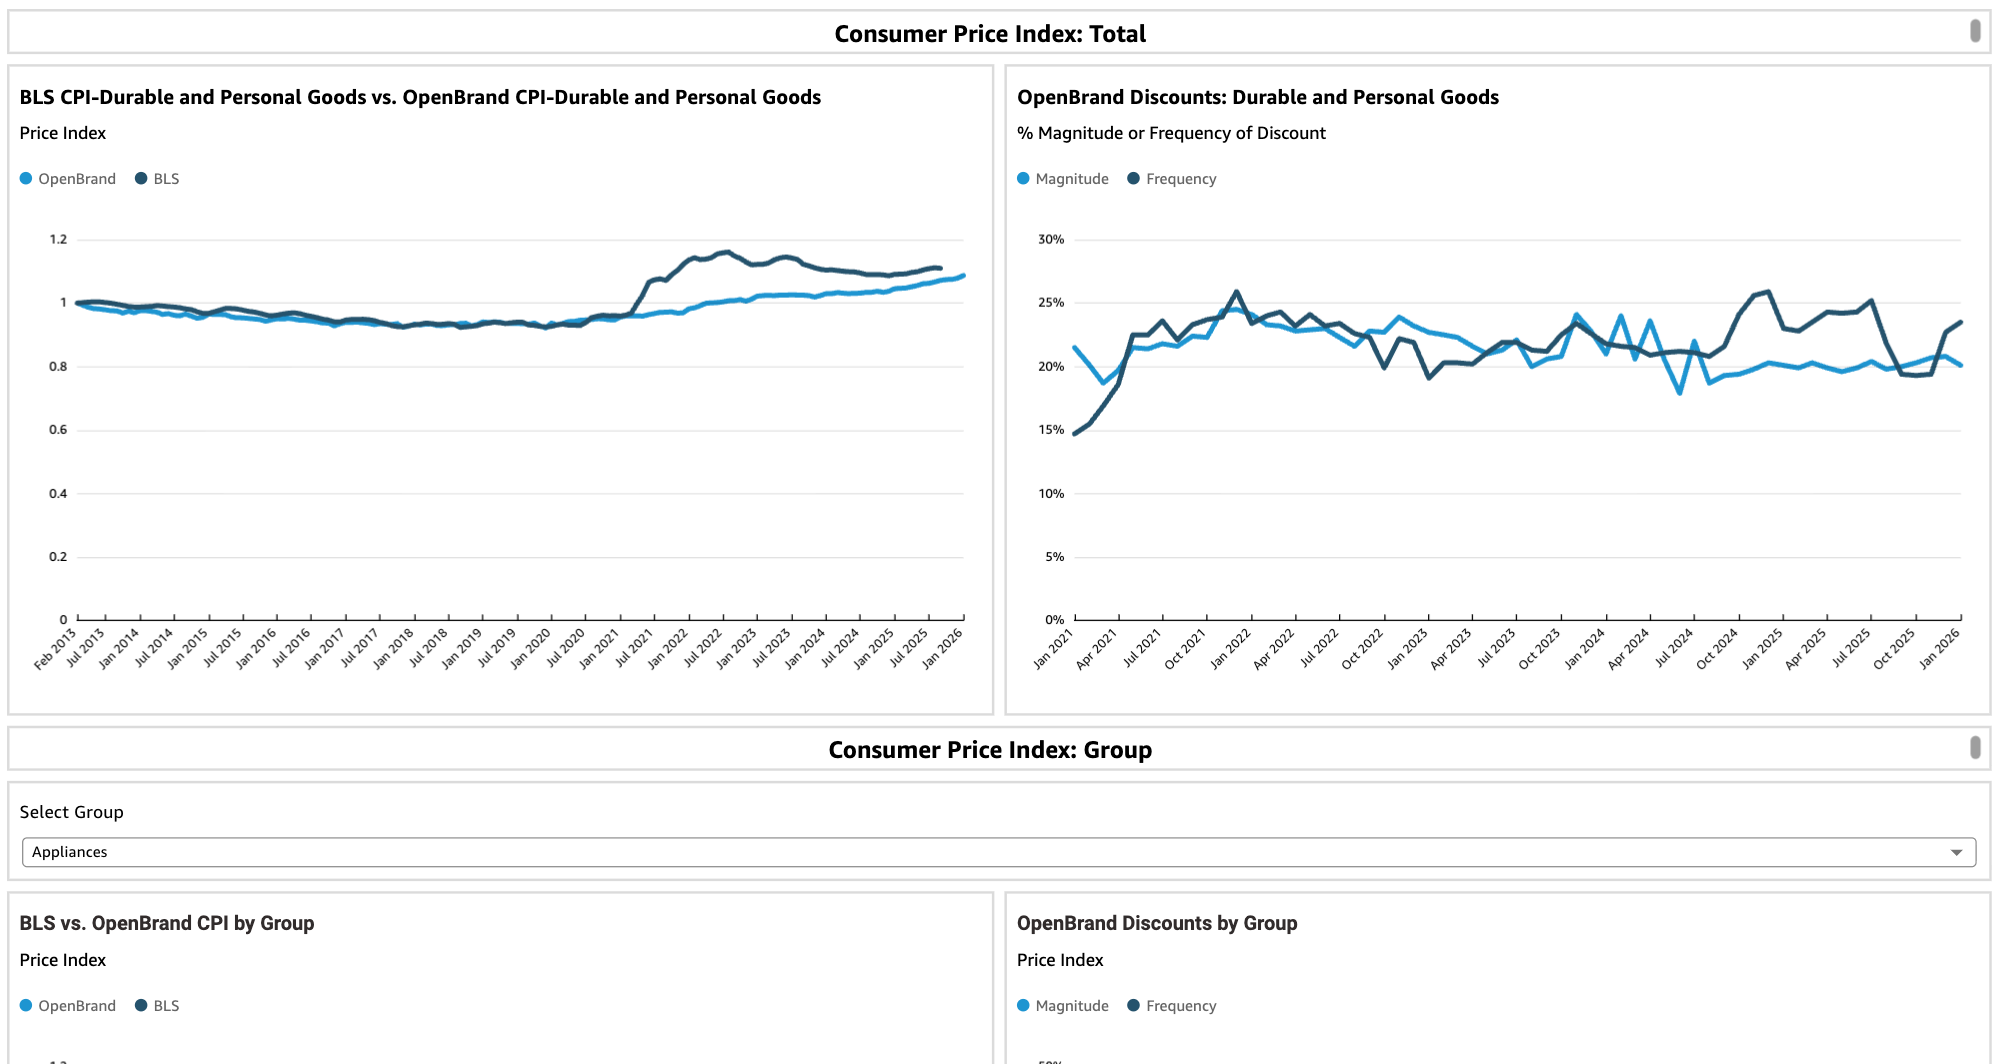
CPI & Forecasting
Built For Answering Your Biggest Market Questions
OpenBrand combines market data, AI modeling, and category expertise so you can step into your next executive review with answers and clear action plans, not assumptions.
How is my market share shifting?
Answering this simple question is harder than it should be. OpenBrand is built for share clarity.
With OpenBrand, you can:
- Identify which SKUs are gaining or losing share, even low-incidence or suppressed SKUs
- Understand how market share is distributed across retailers and brands
- Analyze share by core product specs to pinpoint performance drivers
Powered by proprietary data mosaic, dynamic AI modeling, and expert calibration.

Which competitive moves impacted share?
Share tells you what changed. Understand the key competitive factors influencing movement.
With OpenBrand, you can:
- Monitor daily pricing and promotions across key retailers (online & in-store)
- Detect new product launches and assortment changes
- Track placement, share of shelf, and out-of-stocks
Powered by proprietary web collection, in-store pictures, and multi-year historical trend data.
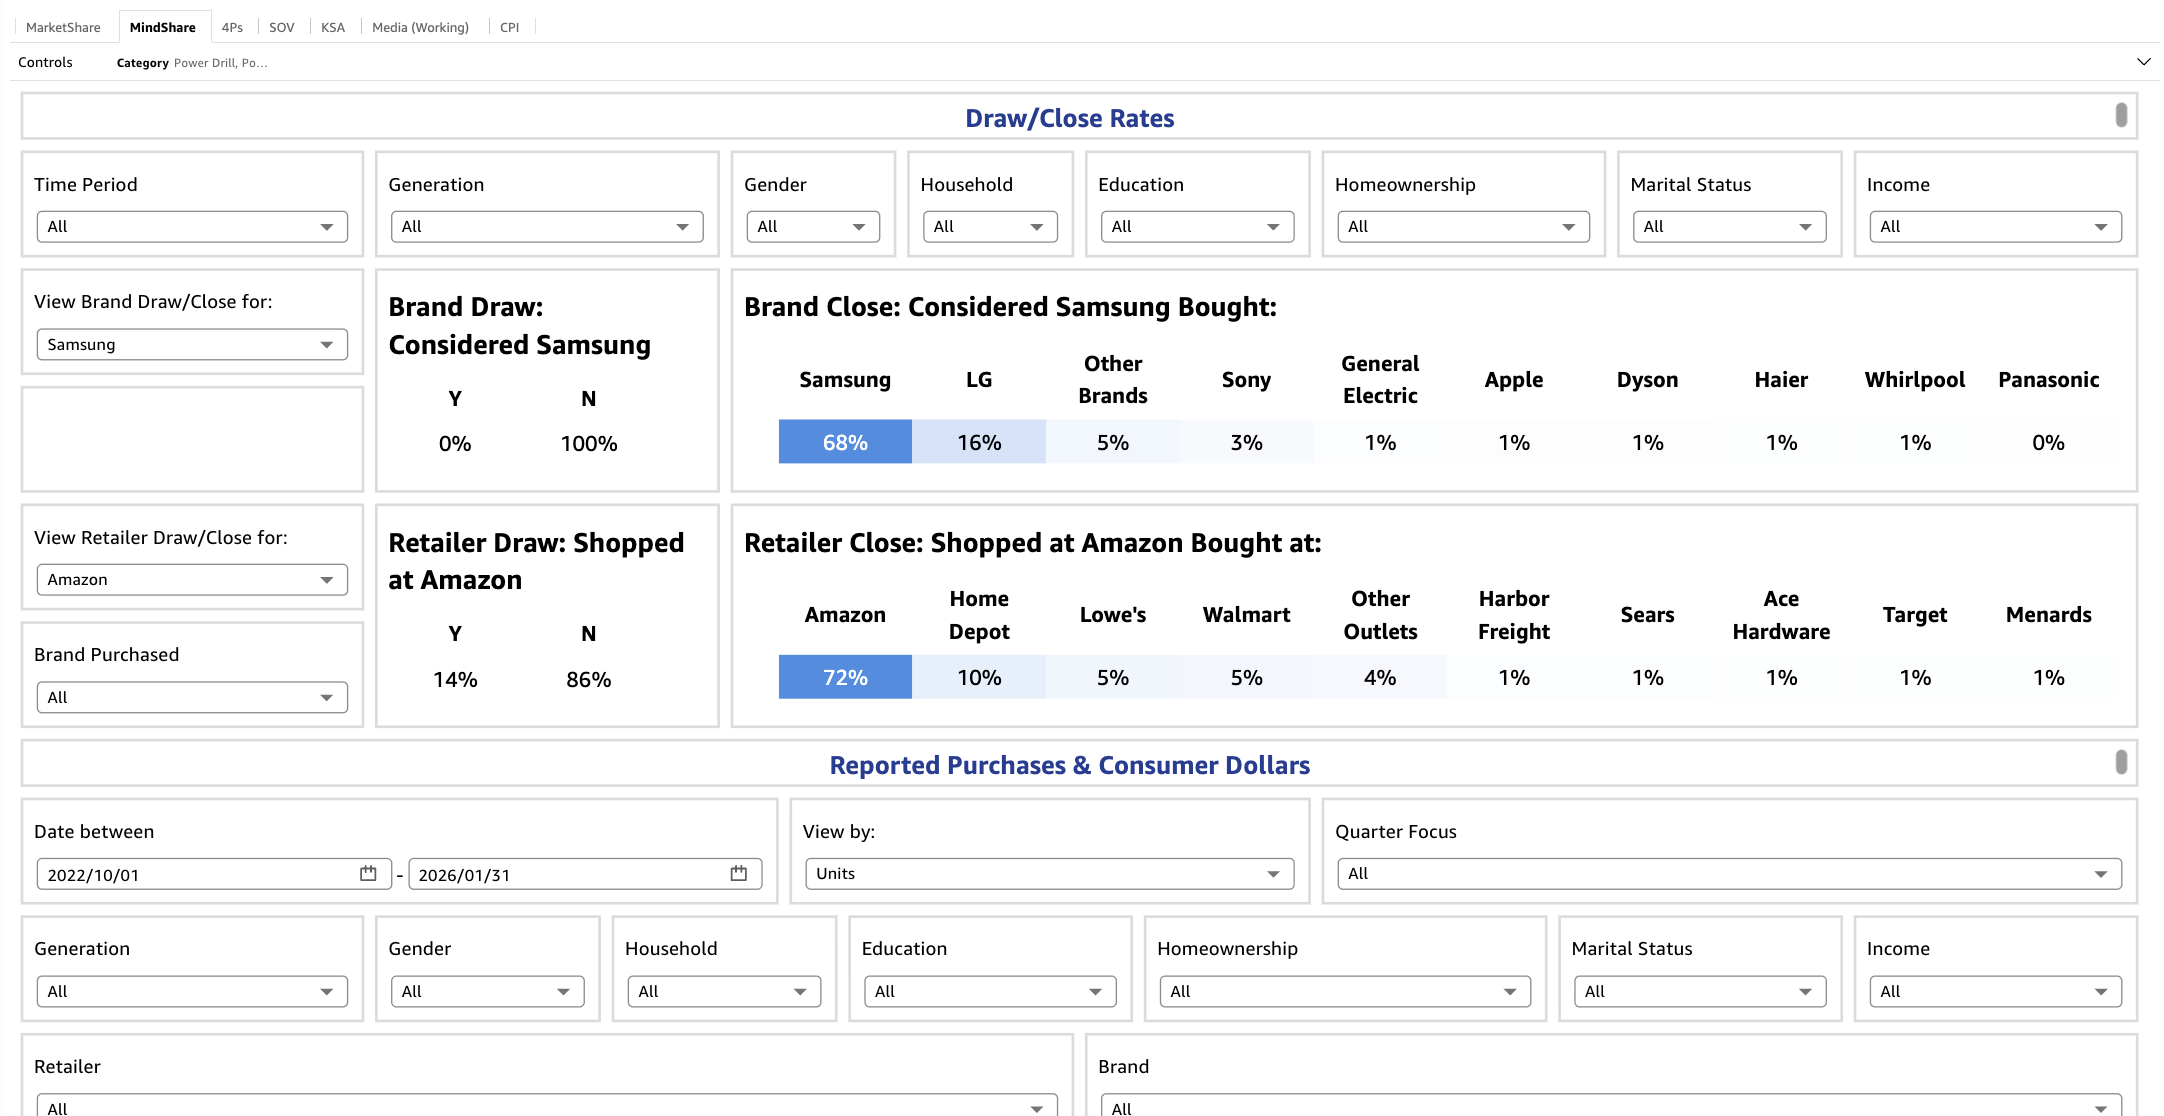
What is driving buyer decisions in my category?
Competitive moves only explain part of the story. Understanding perception impacts share change.
With OpenBrand, you can:
- Measure draw, close, and leakage across brands and retailers
- Understand how purchase behavior varies by demographic and location
- See how shifts in behavior translate directly into share movement
Powered by the longest-running durables consumer tracking survey, with daily fielding.


What's the full story behind market movement?
Category Expertise, Analyst Support. Data alone isn’t enough. Work with an analyst who knows your market inside and out.
With OpenBrand, you get:
- Dedicated analysts who specialize in your products
- Data built and calibrated using deep product and specification knowledge
- Validation of anomalies and interpretation of shifts before insights reach your team
- Clear, retailer-ready stories and recommendations from complex data
Powered by 9 category experts with 100+ years of combined industry experience.
data and insights built for

Built to Power Your Business
While organizations can leverage each of these building blocks independently there is even more power in the unified results that define OpenBrand’s market intelligence offering.
By bringing all of these pieces together, we have created a truly end-to-end solution that helps brands and retailers know their share, understand why they are winning or losing, and win more.
Ready to see the unmatched market data available for your business?
EXPLORE OUR DATA
Public Quarterly Market Dashboards
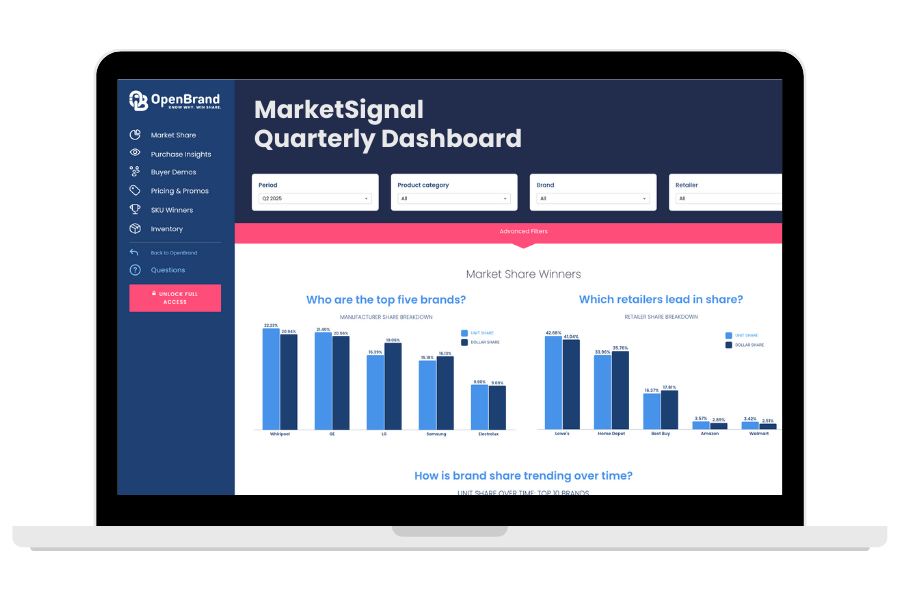
OpenBrand’s data is available to the public through MarketSignal, our quarterly overview dashboards, delivering market share, pricing, promotions, and purchase insights.
Read our latest blogs and insights
US Small Appliance Market Trends: Brand & Retailer Market Share Insights
Latest Update: June 2026 The small appliance market heading into 2026 is defined by three forces…

Consumer Price Index: Durable Goods | June 2026
This is the July 2026 release of the OpenBrand Consumer Price Index (CPI) – Durable Goods…
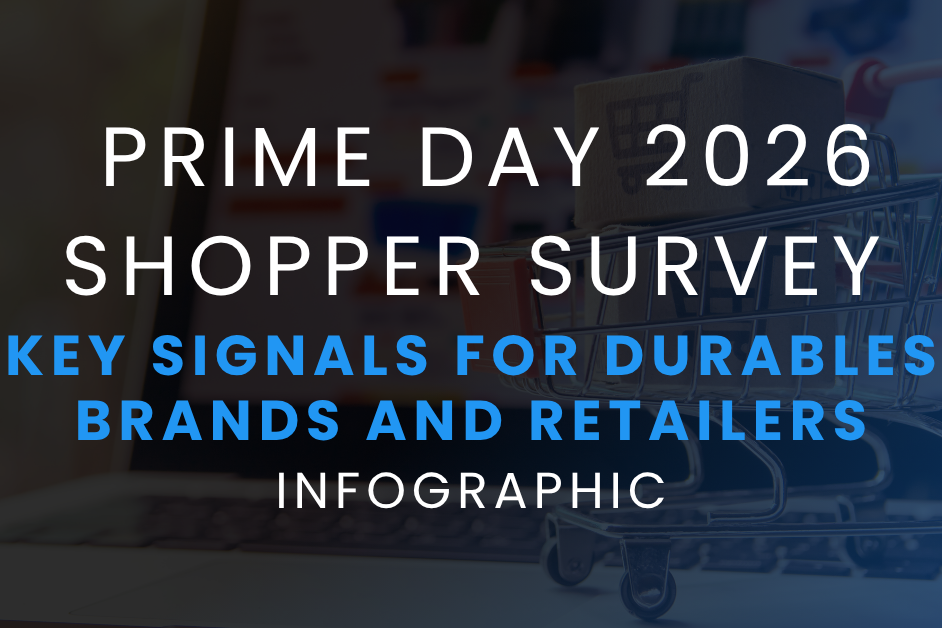
Prime Day 2026 Shopper Survey: Key Signals for Durables Brands and Retailers
Prime Day 2026 still drove strong shopper participation, but OpenBrand’s latest survey shows a…
What Prime Day 2026 Told Retailers and Brands: A Category-by-Category Read from OpenBrand’s Analysts
Prime Day is no longer a two-day Amazon event that the rest of retail watches from the sidelines.…
