


Consumer Price Index: Durable Goods | June 2026
This is the July 2026 release of the OpenBrand Consumer Price Index (CPI) – Durable Goods report that covers price movements in June 2026.
DISCLAIMER: This report is provided ‘as is’ for informational purposes only. OpenBrand makes no representations or warranties regarding the accuracy, completeness, or reliability of the data. Users assume all risks associated with their use of this report. OpenBrand shall not be liable for any losses or damages arising from the use of this report.
Prime Week Discounts Not Enough to Tamper Inflationary Pressures
In June, price growth for consumer durable goods accelerated with a month-over-month (MoM) increase of +0.79%. This is up from a revised monthly +0.05% increase in May. Across our four product groups, three showed month-over-month acceleration, with appliances showing the only price growth decline.
Prime Week has become a defining moment for discounting strategy in the durable goods sector and is now a mature, calibrated promotional environment rather than a race to ever-deeper markdowns. In the immediate years after the pandemic, Prime events were shorter bursts characterized by very broad discounting, even if the price cuts themselves were relatively modest. More recently, the pattern has shifted toward longer promotional windows but less widespread participation, reinforcing that these events are still mostly about discount breadth rather than deep, margin-eroding discounts. Across 2021–2026, average Prime Week discount magnitudes on durables have hovered in a tight band around the broader month’s pricing – typically within a couple of percentage points of the rest-of-month average – underscoring that the real story is which products are on sale, not how dramatically they’re marked down.
Overall discount frequency during Prime Week reached 28.5%, up from 24.4% in the rest of June, signaling a meaningful but targeted expansion of what’s on deal rather than an aggressive dive on price. That expansion was not evenly distributed: home improvement and recreation saw the largest jumps in discounting, with Prime Week coverage rising to 20.5% and 34.7% of items respectively, compared with 15.2% and 26.3% during the rest of the month.
For the Communication & Recreation Groups, Amazon’s Prime Week discounting was still focused on quantity over quality, but differed on value products versus premium: smartphones saw almost 80% of Prime Week deals occurring under the $800 price range. Headphones, however, focused discounts on higher end products, so the dollar savings amount was in-line with last year, but the amount of discount was smaller.
Retailers used very different discount playbooks during this year’s Prime Week event – not only compared to one another, but also compared to last year. During Prime Week 2025, Amazon, Best Buy, Home Depot and Walmart all increased discount frequency above their July baselines, with Walmart in particular moving from roughly one-quarter of assortment on sale to well over half. In 2026, however, Amazon, Home Depot, Lowe’s and Walmart discount frequency was smaller during Prime Week than the prior year, while Best Buy and Target all increased their discount frequency.
At the same time, discount magnitude changes were mixed in 2026: Best Buy and Walmart deepened Prime‑adjacent cuts versus 2025. Amazon’s average discount depths, by contrast, stayed relatively stable year over year and closer to their non‑event baselines, while Home Depot, Lowe’s, Target and Walmart all decreased their discount magnitudes during Prime Week 2026 versus the rest of June. This emphasizes how merchants are relying more on breadth of deals than on steeper price cuts to compete in the Prime event spotlight.
For durable goods brands and retailers, this combination of steady discount magnitudes and shifting breadth has a practical implication. Because Prime Week discounts are no longer dramatically deeper than the rest of the month, winning share increasingly depends on being included in the promotional set during the event window rather than racing to the lowest price.
Table of Contents
- Key CPI Takeaways for June 2026 & Macroeconomic Outlook
- Product Group Highlights
- CPI 2026 Forecast: Macroeconomic Summary
- Methodology
June 2026 OpenBrand CPI Summary and Macroeconomic Outlook
Overall OpenBrand Consumer Price Index Movement: The OpenBrand CPI of Durable Goods recorded a +0.79% monthly change in June. All product groups except Appliances experienced price increases this month.
Discount Trends: June brought mixed changes in discount activity to the durable goods sector, with magnitude month-over-month falling to 19.2% of all durable goods from 19.9% in the month prior. The typical frequency remained flat compared to the month prior at 24.4%.
Product Group Price Trends: All product groups except Appliances experienced an uptick in prices and the rate of growth from the month prior. The group summary is as follows:
- Appliance Group (-0.02%)
- Communication Group (+1.13%)
- Home Improvement Group (+1.03%)
- Recreation Group (+1.81%)
Product Group Highlights
CPI: Appliances
Prices for appliances remained flat compared to last month, remaining at -0.02%. Magnitude decreased from 17.4% to 16.9%, while frequency grew by 4 percentage points from 38.0% to 42.0% from May to June. The lack of price change was at least partially driven by the decent increase in discount frequency.
CPI: Communication
Prices of communication devices, including phones, tablets, computers, and printers, rose on a month-over-month basis to +1.13%, up from a revised -0.62% the month prior. Both discount frequency and discount magnitude decreased this month, from 16.1% to 14.0%, and 20.4% to 19.7% respectively. The acceleration in price growth was at least partially driven by the decrease in both frequency & magnitude of discounts.
CPI: Home Improvement
Prices for home improvement goods experienced an acceleration in growth this month, increasing to +1.03% on a month-over-month seasonally-adjusted basis in June, rising from -0.33% in the month prior. Discount frequency increased by over 1.5 percentage points from 13.6% to 15.2% from May to June, while discount magnitude decreased from 16.9% to 16.3% from May to June. The acceleration in price growth was at least partially driven by the decrease in the typical discount magnitude.
CPI: Recreation
The rate of price growth of recreational products, including TVs, headphones, and speaker systems, experienced acceleration this month, increasing to +1.81% on a month-over-month seasonally-adjusted basis in June, up from a revised +0.37% in May. Both discount frequency and discount magnitude decreased this month, from 30.1% to 26.3%, and 24.9% to 23.9% respectively. The acceleration in price growth was at least partially driven by the decrease in both frequency & magnitude of discounts.
Macroeconomic Outlook Update
The macroeconomic setting as we enter the second half of 2026 is defined by a cautious combination of potential growth, energy shock, and tighter‑for‑longer financial conditions for the durable goods sector.
Energy remains the pivotal factor in the current economy. Global inventories have been drawn down to multi‑decade lows: more than a billion barrels have been pulled from storage, OECD stocks sit near their lowest levels since the late 1980s. Governments and firms alike will want to rebuild reserves once flows through the Strait of Hormuz start to normalize. Even under the assumption that the strait gradually reopens beginning in July, it will likely take 8-12 months to fully restore traffic. For durable goods manufacturers, that means the full pass‑through of higher oil and transportation costs into input prices is still unfolding and in an important lag.
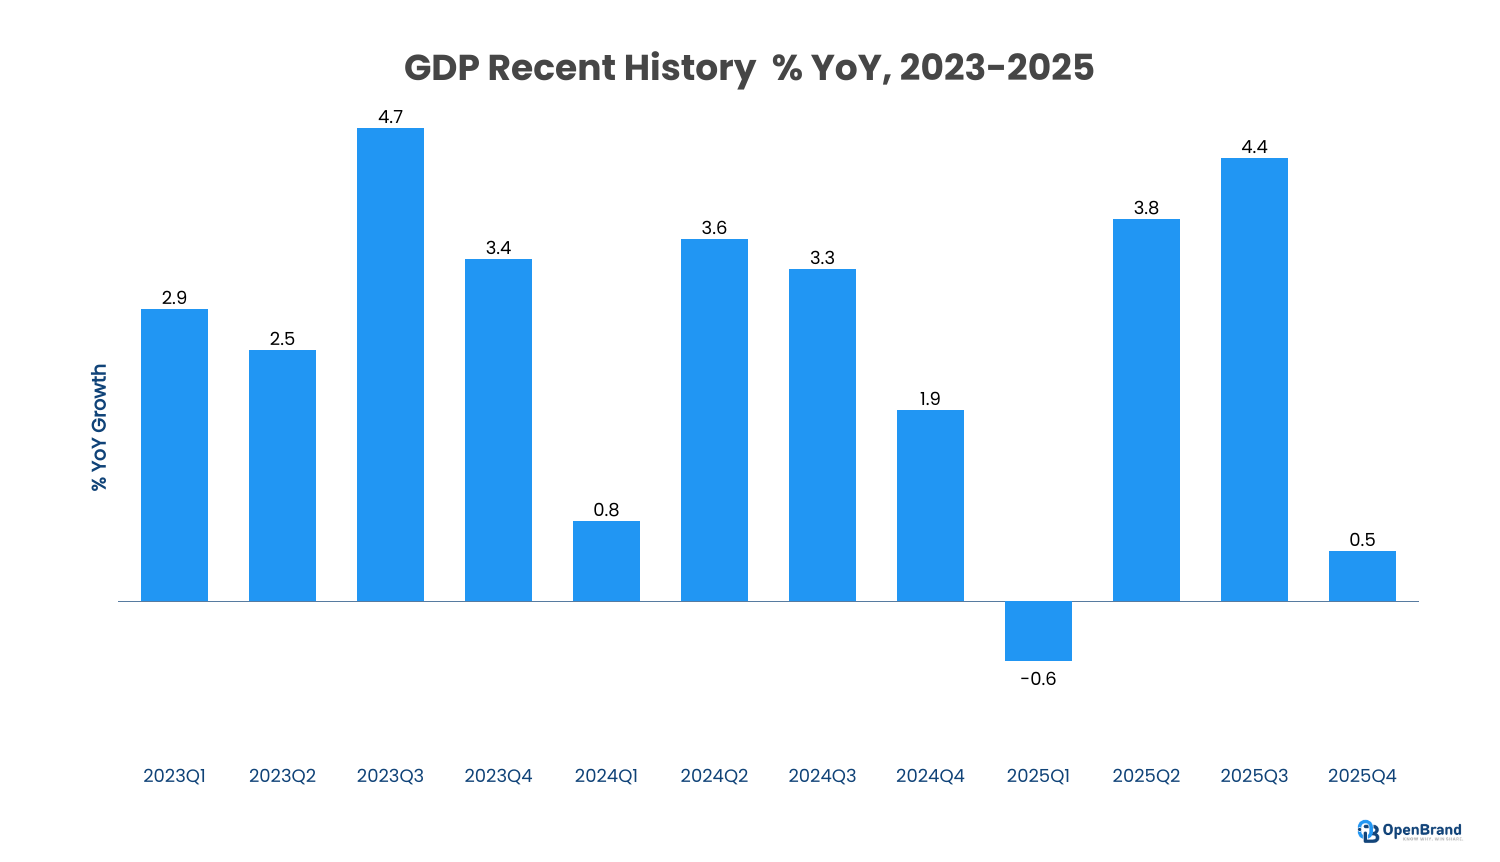
The near‑term GDP outlook has cooled as the economy works through the energy shock and regains some momentum, with growth now projected at an average of 2.1% in 2026. The spike in energy prices prior to this month undermined business confidence and household spending, and investment responses in the energy sector are slow to materialize, dampening demand for equipment, vehicles, and other long‑lived capital goods. While large tax refunds and stimulus from the One Big Beautiful Bill initially provided a catalyst to consumption, higher fuel and utility costs are absorbing much of that support, leaving less room for big‑ticket purchases. For durable goods suppliers, this translates into heightened sensitivity to purchases and pricing, particularly in consumer‑facing segments that depend on discretionary income. Consumer spending, fixed non-residential investment and exports were the sources of growth in the first quarter. Business investment is arguably the strongest counterweight to these headwinds as real fixed non-residential investment surged at a double‑digit pace in the first quarter – a critical signal for the durable goods outlook.
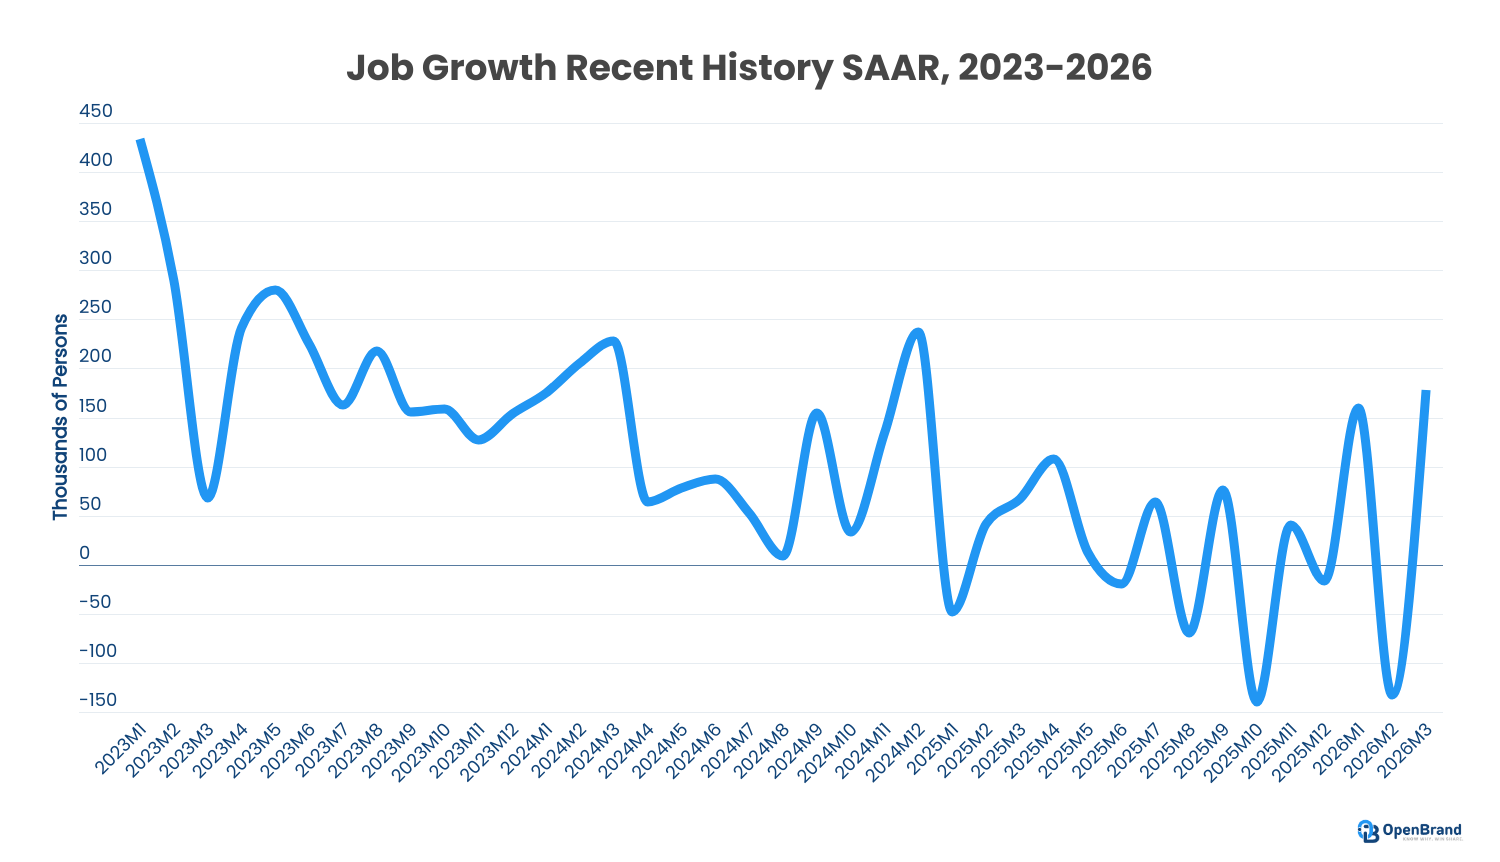
Job growth surprised to the upside in recent months, with payrolls adding more than 150,000 positions per month from March through May and 172,000 in May alone, yet the unemployment rate has held around 4.3%. Real wages are under pressure from inflation and higher energy costs, thus encouraging consumers to be more selective with purchases.
Above‑target inflation – driven by the Iran war, oil price spikes and tariffs – means the Federal Reserve is unable to make rate cuts, with the policy rate expected to stay in its current 3.5-3.75% range through the end of the decade before gradually returning toward historical norms. The 10‑year Treasury yield has drifted up to about 4.45% in June, roughly 30 basis points above where it started the year. This dampens the appetite for large, credit‑financed purchases, increasing the value of dependable cash streams and pricing power.
The existing 10% universal tariff under Section 120 of the Trade Act of 1974 is set to expire at the end of July, easing some cost pressures but not fully reversing the drag from past trade frictions. [LF1] Higher mortgage rates – pushed up in part by Middle East tensions and elevated oil prices – are interacting with tight existing‑home supply and poor affordability to limit home buying through 2026. Homebuilders face a difficult mix of rising materials costs due to tariffs and a buildup of completed inventory that will weigh on single‑family permits over the coming year.
Currently, the consumer is not stepping back entirely, but is scrutinizing every dollar more closely, while businesses are managing higher costs that will continue to shape the mix of durable goods demand well beyond 2026. With scarce oil and ongoing efforts to rebuild inventories, financing costs likely to stay high, and real incomes under pressure, the durable goods sector will be defined less by headline growth and more by how effectively firms manage volatility.
Note: This summary is based on data available as of early July 2026 and may be subject to revisions in future releases. Special thanks to Lauren Finck and Scott Peterson for their contributions to this month’s report.
For questions about the report, please contact Ralph McLaughlin at ralph@openbrand.com
For press inquiries, please contact press@openbrand.com
About the OpenBrand CPI
This report offers insights into price trends across major consumer product categories representing a select mix of both durable goods (see methodology below for more details). The data used in this report leverages OpenBrand’s industry-leading library of durable goods pricing, promotion, and availability for over 1.4 million individual products. This is more than ten times the coverage by the monthly Bureau of Labor Statistics (BLS) Consumer Price Index, allowing more timely and granular reporting of price changes in the market.
This free monthly report provides a broad summary of price changes (including promotional activity), category-specific pricing and promotional trends, and macroeconomic context. For those seeking deeper insights, weekly CPI reporting and monthly CPI forecasts (released next week) are available on a subscription basis with up to same-day SKU-level pricing data available in bulk downloadable files.
Subscribe
Get CPI & Real-Time Pricing Data Updates
The OpenBrand CPI-Durable Goods is released monthly. Join our subscription list to be notified when new CPI data is available.
OpenBrand Methodological Notes
The OpenBrand CPI of Durable Goods is constructed using a data-driven methodology that ensures accuracy, timeliness, and transparency in measuring price trends for both short and long-lasting consumer products. The methodology consists of the following key components:
Data Collection
- Real-Time Price Tracking: Prices are sourced daily from online marketplaces, retail websites, and brick-and-mortar store listings.
- Retailer & Manufacturer Data: Aggregates pricing information from major retailers, direct-to-consumer brands, and wholesale suppliers into broader consumer categories.
- Temporal Coverage: Captures price variations over time, including daily discounts and price promotions
Product Selection & Tracking
- Durable and Goods Focus: The index includes products with an expected lifespan of three years or more, such as home appliances, consumer electronics, and tools.
- Brand & Model Tracking: Individual brands and models are monitored to reflect pricing shifts within competitive product segments, including both permanent changes in listing price as well as temporary promotional pricing.
Price Calculation, Adjustments, and Weighting
- Price Calculation: Tracks month-over-month and year-over-year price movements to measure price stability in the marketplace and take into account both longer-term changes in pricing (such as changes in manufacturer’s suggested retail price) as well as more short-term changes in pricing, such as promotional discounts and sales prices.
- SKU-Removal Instead of Hedonic Adjustments: When a product (or SKU) becomes unavailable in the BLS goods basket, the BLS implements a SKU-replacement procedure whereby the next most similar product is used in its place, and a quality (hedonic) adjustment procedure is performed to get closer to an apples-to-apples price comparison. Since OpenBrand has data on nearly 100% of the SKUs pricing history in a given product category, we can simply remove that SKU from the basket and rely on price changes of the remaining SKUs in that basket. This eliminates the need for hedonic adjustment in the OpenBrand CPI basket.
- Weighting and Aggregation Method: A weighted geometric mean formula is used to minimize volatility and improve stability in price trend analysis at both the product grouping and category level. Instead of using sales-volume weights when aggregating the index, we take an alternative approach by using persistence-based weights for aggregation. Instead of more frequently purchased items getting more weight in the BLS’ CPI calculation, OpenBrand takes a more novel approach by weighting items with a more established price history in the market more heavily in our CPI calculation than items with a less established history.
Reporting & Updates
- High-Frequency Updates: Published freely on a monthly basis, with a subscription option for daily summaries across categories, sub-categories, and individual products.
- Comparative Benchmarks: We aggregate pricing as analogously as possible to traditional BLS CPI measures for benchmarking purposes.
- Transparency & Accessibility: Provides both open and paid data access for journalists, researchers, businesses, and policymakers.
By leveraging real-time data and advanced statistical techniques, the OpenBrand CPI offers an accurate and dynamic measure of pricing trends, helping businesses and consumers make informed decisions in an evolving economic landscape.
OpenBrand CPI - Durable Goods
Groups and Products
Appliance Group
Air Conditioners
Air Purifiers
Beverage Coolers
Blenders
Coffee Makers
Cooktops & Wall Ovens
Countertop Cooking
Countertop Microwaves
Dehumidifiers
Dishwashers
Dryers
Freezers
Icemakers
Laundry
Ranges
Refrigerators
Vacuums
Washers
OTR (Over-the Range Microwaves)
Communications Group
Business Printers
Desktops
Printers
Headsets
HED
Ink
Large Printers
MFP Copiers
Monitors
Notebooks
Personal & SOHO Printers
Projectors
Smartphones
Tablets & Detachables
Toner
Wearables
Wireless Routers
Recreation Group
Bluetooth Speakers
Bluray
Digital Camcorders
Digital Cameras
Headphones
Media Players
Photo Paper
Sewing Machines
Sound Bars
Speaker Systems
TVs
VAW Speakers
Home Improvement Group
Bathroom Faucets
Bathroom Sinks
Bathroom Vanity
Bathtubs
Cutting Machines
Carpets
Door Locks
Exterior Paints
Exterior Stains
Floor Tiles
Garden Hoses
Generators
Grass Seed
Handhelds
Hand Tools
Hardwood Flooring
Interior Paints
Interior Stains
Kitchen Cabinets
Kitchen Cleanup
Kitchen Faucets
Lawn Fertilizer
Lawn Products
Log Splitters
Mowers
Outdoor Cooking
Outdoor Cooking Accessories
Paint Supplies
Pesticides
Shower Stall and Enclosures
Power Tools
Power Tools Accessories
Pressure Washer
Replacement Batteries
Shower Doors
Shower Heads
Smart Doorbells
Smart Locks
Smart Cameras
Smart Thermostats
Snow Throwers
Spray Paint
Toilets
Vinyl Flooring
Water Filtration
Weed Killer
PREPARED BY
Contact Us
For questions about the report, contact Ralph McLaughlin at ralph@openbrand.com
For press inquiries, contact press@openbrand.com
For full data access on a subscription basis, click the button below to request a demo of the offering.

What Prime Day Data Reveals About Consumer Behavior and Retailer Strategy
Over the last decade, Amazon Prime Day has evolved from a short-lived retail event into a bellwether for broader consumer and market trends. Each year, Prime Day offers a real-time read on how shoppers are responding to economic conditions, the ways in which retailers are adjusting their promotional strategies, and what both mean for the U.S. macroeconomic environment.
This year’s event highlighted three important themes: consumers continue to spend more on durables than they expect, retailers are retooling their discounting strategies, and the June promotions weren’t enough to keep a lid on inflation.
Consumers continue to outspend their expectations
Consumer sentiment data from the University of Michigan and The Conference Board both remain below last year’s levels, driven largely by ongoing concerns about energy prices and a softening labor market.
Prior to Prime Day, consumers surveyed by OpenBrand said they planned to spend much less than they ultimately did when the event came around.
This gap between stated intent and actual behavior has become an increasingly consistent feature of today’s consumer landscape. While households report in surveys that they are budgeting or express concerns about the broader economy, many are still willing to open their wallets when presented with compelling promotions.
In the case of Prime Day, this was particularly true for those shopping durables categories including home goods and consumer electronics.
And consumers didn’t just spend at Amazon—they took advantage of deals at Walmart and Target, which also offered discounts over the Prime Day period.
For retailers, this underscores the fact that shoppers remain highly engaged when the value proposition is strong, even if consumer sentiment data suggests otherwise.
Retailers are extending promotional periods instead of deepening discounts
This year was the second that Amazon extended Prime Day across four days instead of two. Across the retail landscape, promotional windows throughout the year—including Black Friday and back to school—have expanded as retailers compete for consumer attention over longer periods of time.
Rather than relying on short-lived, aggressive markdowns, retailers are instead spreading smaller discounts across these extended shopping periods.
At Walmart, for instance, the depth of discounts was smaller over the Prime Day period than during the rest of June, but promotions were much more widespread. Target and Home Depot followed a similar strategy.
This approach may be the result of retailers understanding that consumers are busy people who don’t necessarily have the time to shop over a two-day sprint during the work week. By widening the window, they are likely capturing more sales and protecting their margins.
Discount frequency increased the most in the recreation, home improvement, and appliance categories during the four-day Prime Day event, while communication showed little difference from the rest of June. This may reflect markdowns of over 20% on both Google and Samsung smartphones over the Prime Day period.
Prime Day discounts weren’t enough to keep a lid on durables inflation
In May, OpenBrand’s CPI report and durables macroeconomic summary showed that consumer durable prices remained surprisingly subdued in May despite elevated energy costs, helped by deep Memorial Day discounting. That dynamic didn’t continue in June: OpenBrand’s CPI for durable and personal goods was up 0.79% from the prior month, led by a 1.81% increase in the recreation category and a 1.13% increase in the communication category.
While promotional activity alone does not determine inflation, significant promotions can put sustained downward pressure on effective selling prices, helping to moderate inflation even as underlying costs remain elevated in parts of the economy. It’s possible that as retailers offer discounts across longer stretches of the year—rather than deep discounts over shorter periods—prices will appear elevated.
Looking for deeper insights?
Sign up below to receive our complete CPI report on July 13, featuring detailed data, expert analysis, and key takeaways for your business. The OpenBrand CPI-Durable Goods is released monthly. Join our subscription list to be notified when new CPI data is available.
PREPARED BY

Consumer Price Index: Durable Goods | May 2026
This is the June 2026 release of the OpenBrand Consumer Price Index (CPI) – Durable Goods report that covers price movements in May 2026.
DISCLAIMER: This report is provided ‘as is’ for informational purposes only. OpenBrand makes no representations or warranties regarding the accuracy, completeness, or reliability of the data. Users assume all risks associated with their use of this report. OpenBrand shall not be liable for any losses or damages arising from the use of this report.
Durable Goods Price Growth Slows Amidst Big Memorial Day Promotions
In May, price growth for consumer durable goods remained nearly flat with a month-over-month (MoM) increase of +0.02%. This is down from a revised monthly +0.43% increase in April. Across our four product groups, three showed month-over-month deceleration, with recreation showing the only price growth uptick. May showcased Memorial Day Weekend promotions, which helped contribute to the month-over-month flatness.
Memorial Day continues to be an important promotional event for the durable goods sector, but the nature of this promotion has evolved considerably. In 2026, discount activity rebounded sharply compared to recent years, with a discount frequency of 29.9% during Memorial Day Weekend compared with 24.2% during the remainder of May. Memorial Day Weekend 2026 saw the most aggressive promotional activity since 2022, with both the highest discount frequency and the widest gap between Memorial Day Weekend promotional activity relative to the rest of May.
Promotions across the Home Improvement and Communication groups were notably aggressive in May 2026. Memorial Day Weekend 2026 saw retailers lean heavily on promotions across several durable goods categories, though discount activity varied significantly by sector. Home Improvement discount frequency increased sharply, climbing from 13.4% to 20.3%. Within the Home Improvement sector, Door Locks, Kitchen Faucets, and Log Splitters in particular saw a dramatic increase in discount frequency. Discount frequency jumped to some of the highest levels observed during the past two years notably for Kitchen Faucets and Log Splitters.
Communications products saw one of the largest promotional increases in May 2026, with discount frequency rising to 26.3% over Memorial Day Weekend from 16% in the rest of the month. More broadly, smartphones, wearables, and printers all posted notable gains in discount frequency. For wearables, the May 2026 increase in promotional activity was driven by broader promotional coverage from major brands, as well as inventory-clearing efforts ahead of upcoming product launches. Looking ahead, the growing availability of affordable, feature-rich devices could keep promotional pressure elevated as brands compete to defend market share.
For smartphones, the May 2026 increase in promotional activity reflected stronger year-over-year incentives from major brands along with broader discounting across product lines, plus aggressive carrier-led launch offers. Smartphones, in particular, stood out not only in May 2026 but also at the end of 2025.
Table of Contents
- Key CPI Takeaways for May 2026 & Macroeconomic Outlook
- Product Group Highlights
- CPI 2026 Forecast: Macroeconomic Summary
- Methodology
May 2026 OpenBrand CPI Summary and Macroeconomic Outlook
Overall OpenBrand Consumer Price Index Movement: The OpenBrand CPI of Durable Goods recorded a +0.02% monthly change in May, notching the twenty-third consecutive month-over-month increase. All product groups except Recreation experienced price declines this month.
Discount Trends: May brought mixed changes in discount activity to the durable goods sector, with magnitude month-over-month rising to 19.9% of all durable goods from 19.8% in the month prior. The typical frequency decreased to 24.3%, down from 25.7% the month prior.
Product Group Price Trends: All product groups experienced a slowdown in the rate of growth from the month prior, with prices of all groups except Recreation declining month-over-month. The group summary is as follows:
- Appliance Group (-0.04%)
- Communication Group (-0.35%)
- Home Improvement Group (-0.33%)
- Recreation Group (+0.33%)
Product Group Highlights
CPI: Appliances
Prices for appliances decreased on a month-over-month basis in May to -0.04%, falling from a revised +0.11% in the month prior. The frequency and magnitude of discounts both fell in May. Frequency decreased more than 3 percentage points from 40.9% to 37.8%, while magnitude fell slightly from 17.4% to 17.3% from April to May. The decrease in both frequency and magnitude of discounts would lead us to expect an increase in prices, however, since prices of appliances decreased in May, it could be that shelf prices were set higher.
CPI: Communication
Prices of communication devices, including phones, tablets, computers, and printers, fell on a month-over-month basis to -0.35%, down from a revised +0.44% the month prior. Both discount frequency and discount magnitude increased this month, from 15.8% to 16.0%, and 20.1% to 20.5% respectively. The deceleration in price growth was at least partially driven by the increase in both frequency & magnitude of discounts.
CPI: Home Improvement
Prices for home improvement goods experienced a deceleration in growth this month, decreasing to -0.33% on a month-over-month seasonally-adjusted basis in May, falling from a revised +0.11% in the month prior, showing the first monthly decrease in the last 26 months. The deceleration in price growth was at least partially driven by the increase in the typical discount frequency.
CPI: Recreation
The rate of price growth of recreational products, including TVs, headphones, and speaker systems, experienced deceleration this month, decreasing to +0.33% on a month-over-month seasonally-adjusted basis in May, down from a revised +0.89% in April. The deceleration in prices was at least partially driven by the increase in the typical discount magnitude, up from 24.6% in April to 24.9% in May.
Macroeconomic Outlook Update
The macroeconomic backdrop heading into the second half of 2026 is layered, mixed bag for the durable goods sector.
Energy costs remain above pre-conflict levels, even as Brent Crude fell in May following a late-April peak tied to the ongoing Middle East conflict. The initial shock from the sharp run-up in oil prices that began in earnest in late February has not yet fully worked its way through the production and transportation pipeline, meaning the full drag on input costs for durable goods manufacturers is still materializing. That’s an important caveat for anyone interpreting the first quarter’s relative resilience as a signal of sustained strength.
Real GDP growth is expected to continue building on gains into the second quarter of 2026, though the picture is more complicated than the headline suggests. The Q1 rebound was supported in part by a normalization of government spending following the prior quarter’s shutdown. In other words, some of the improvement was a catch-up effect, not a reflection of organic momentum. Consumer spending and business investment held up, but the full weight of the energy price shock hasn’t landed yet. For durable goods categories, this creates a demand environment that is fragile at the edges, where discretionary and big-ticket purchases are particularly exposed as household budgets increasingly absorb elevated energy costs.
The interest rate environment offers little relief. The 10-year Treasury yield is expected to hold in the 4.25 – 4.30% range through the year-end, keeping long-term borrowing costs elevated. For housing-related durable goods, such as appliances, home improvement materials, and related categories, the combination of high financing costs and constrained affordability continues to cap demand potential. The 30-year mortgage rate reached 6.44% in May, and homebuilders are simultaneously contending with rising material costs tied to tariffs. That’s a double squeeze that shows no sign of easing meaningfully in the near term.
The labor market is not showing signs of collapse. Job growth increased for a third straight month in May with a surprising gain of 172,000, driving the three month total to well over 500,000. On the other hand, consumer sentiment fell by 14.2% from May 2025 to May 2026, and growth in Personal Consumer Expenditures softened in April. While falling consumer sentiment does not bode well for expectations of consumer durables consumption, these are not crisis signals: the link between consumer sentiment and consumer behaviors appears to have been diverging sharply over the past two years.
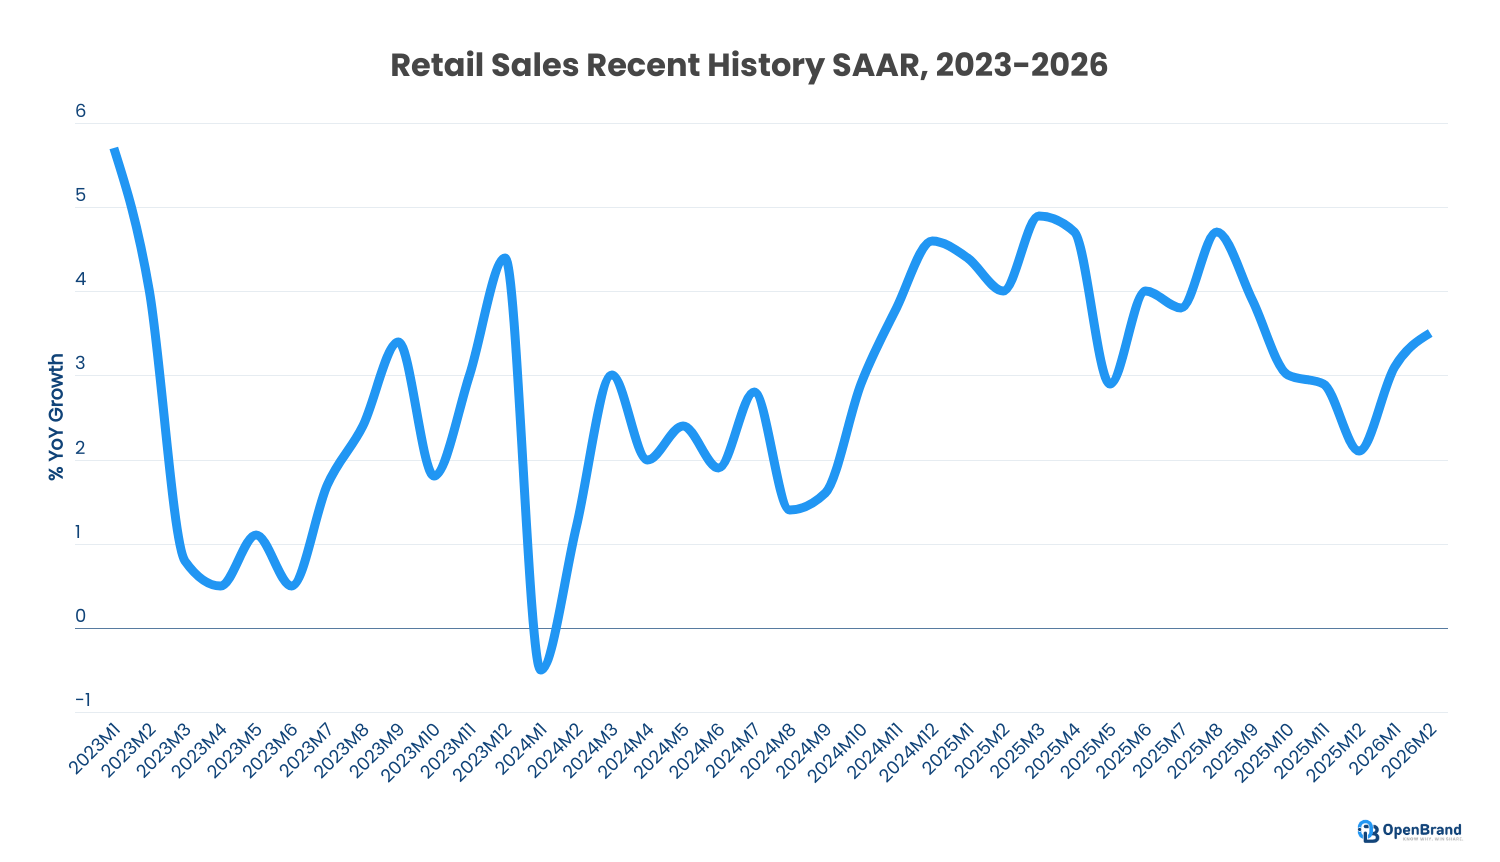
Retail Sales, however, continue to climb, with year-over-year growth reaching levels not seen since early 2023, but it’s worth noting that after controlling for inflation, the growth was nominally small. It tells us that even in an environment of cooling sentiment and rising caution, consumers are still spending, but they’re just being more selective about it.
The housing market continues to act as a structural constraint on housing-sensitive durable goods demand. Elevated mortgage rates have kept existing-home supply limited, as many current homeowners remain locked into sub-market rates they are understandably reluctant to give up. That inventory squeeze caps the pipeline of home sales that typically drive demand for appliances, flooring, fixtures, and related categories.
Looking ahead, the sector is caught between resilient underlying demand and a set of persistent, compounding headwinds. The most hopeful development is the recent easing in oil prices, but it’s worth keeping in perspective. Prices are still well above where they were before the current Middle East conflict began, and the impact of elevated energy costs is still rippling through supply chains. With housing affordability, labor market momentum, and borrowing costs all pointing in the same cautious direction, the operating environment for durable goods is likely to remain uneven in the second half of 2026. The consumer isn’t pulling back entirely, but they’re paying closer attention to every dollar spent.
Note: This summary is based on data available as of early June 2026 and may be subject to revisions in future releases. Special thanks to Lauren Finck and Scott Peterson for their contributions to this month’s report.
For questions about the report, please contact Ralph McLaughlin at ralph@openbrand.com
For press inquiries, please contact press@openbrand.com
About the OpenBrand CPI
This report offers insights into price trends across major consumer product categories representing a select mix of both durable goods (see methodology below for more details). The data used in this report leverages OpenBrand’s industry-leading library of durable goods pricing, promotion, and availability for over 1.4 million individual products. This is more than ten times the coverage by the monthly Bureau of Labor Statistics (BLS) Consumer Price Index, allowing more timely and granular reporting of price changes in the market.
This free monthly report provides a broad summary of price changes (including promotional activity), category-specific pricing and promotional trends, and macroeconomic context. For those seeking deeper insights, weekly CPI reporting and monthly CPI forecasts (released next week) are available on a subscription basis with up to same-day SKU-level pricing data available in bulk downloadable files.
Subscribe
Get CPI & Real-Time Pricing Data Updates
The OpenBrand CPI-Durable Goods is released monthly. Join our subscription list to be notified when new CPI data is available.
OpenBrand Methodological Notes
The OpenBrand CPI of Durable Goods is constructed using a data-driven methodology that ensures accuracy, timeliness, and transparency in measuring price trends for both short and long-lasting consumer products. The methodology consists of the following key components:
Data Collection
- Real-Time Price Tracking: Prices are sourced daily from online marketplaces, retail websites, and brick-and-mortar store listings.
- Retailer & Manufacturer Data: Aggregates pricing information from major retailers, direct-to-consumer brands, and wholesale suppliers into broader consumer categories.
- Temporal Coverage: Captures price variations over time, including daily discounts and price promotions
Product Selection & Tracking
- Durable and Goods Focus: The index includes products with an expected lifespan of three years or more, such as home appliances, consumer electronics, and tools.
- Brand & Model Tracking: Individual brands and models are monitored to reflect pricing shifts within competitive product segments, including both permanent changes in listing price as well as temporary promotional pricing.
Price Calculation, Adjustments, and Weighting
- Price Calculation: Tracks month-over-month and year-over-year price movements to measure price stability in the marketplace and take into account both longer-term changes in pricing (such as changes in manufacturer’s suggested retail price) as well as more short-term changes in pricing, such as promotional discounts and sales prices.
- SKU-Removal Instead of Hedonic Adjustments: When a product (or SKU) becomes unavailable in the BLS goods basket, the BLS implements a SKU-replacement procedure whereby the next most similar product is used in its place, and a quality (hedonic) adjustment procedure is performed to get closer to an apples-to-apples price comparison. Since OpenBrand has data on nearly 100% of the SKUs pricing history in a given product category, we can simply remove that SKU from the basket and rely on price changes of the remaining SKUs in that basket. This eliminates the need for hedonic adjustment in the OpenBrand CPI basket.
- Weighting and Aggregation Method: A weighted geometric mean formula is used to minimize volatility and improve stability in price trend analysis at both the product grouping and category level. Instead of using sales-volume weights when aggregating the index, we take an alternative approach by using persistence-based weights for aggregation. Instead of more frequently purchased items getting more weight in the BLS’ CPI calculation, OpenBrand takes a more novel approach by weighting items with a more established price history in the market more heavily in our CPI calculation than items with a less established history.
Reporting & Updates
- High-Frequency Updates: Published freely on a monthly basis, with a subscription option for daily summaries across categories, sub-categories, and individual products.
- Comparative Benchmarks: We aggregate pricing as analogously as possible to traditional BLS CPI measures for benchmarking purposes.
- Transparency & Accessibility: Provides both open and paid data access for journalists, researchers, businesses, and policymakers.
By leveraging real-time data and advanced statistical techniques, the OpenBrand CPI offers an accurate and dynamic measure of pricing trends, helping businesses and consumers make informed decisions in an evolving economic landscape.
OpenBrand CPI - Durable Goods
Groups and Products
Appliance Group
Air Conditioners
Air Purifiers
Beverage Coolers
Blenders
Coffee Makers
Cooktops & Wall Ovens
Countertop Cooking
Countertop Microwaves
Dehumidifiers
Dishwashers
Dryers
Freezers
Icemakers
Laundry
Ranges
Refrigerators
Vacuums
Washers
OTR (Over-the Range Microwaves)
Communications Group
Business Printers
Desktops
Printers
Headsets
HED
Ink
Large Printers
MFP Copiers
Monitors
Notebooks
Personal & SOHO Printers
Projectors
Smartphones
Tablets & Detachables
Toner
Wearables
Wireless Routers
Recreation Group
Bluetooth Speakers
Bluray
Digital Camcorders
Digital Cameras
Headphones
Media Players
Photo Paper
Sewing Machines
Sound Bars
Speaker Systems
TVs
VAW Speakers
Home Improvement Group
Bathroom Faucets
Bathroom Sinks
Bathroom Vanity
Bathtubs
Cutting Machines
Carpets
Door Locks
Exterior Paints
Exterior Stains
Floor Tiles
Garden Hoses
Generators
Grass Seed
Handhelds
Hand Tools
Hardwood Flooring
Interior Paints
Interior Stains
Kitchen Cabinets
Kitchen Cleanup
Kitchen Faucets
Lawn Fertilizer
Lawn Products
Log Splitters
Mowers
Outdoor Cooking
Outdoor Cooking Accessories
Paint Supplies
Pesticides
Shower Stall and Enclosures
Power Tools
Power Tools Accessories
Pressure Washer
Replacement Batteries
Shower Doors
Shower Heads
Smart Doorbells
Smart Locks
Smart Cameras
Smart Thermostats
Snow Throwers
Spray Paint
Toilets
Vinyl Flooring
Water Filtration
Weed Killer
PREPARED BY
Contact Us
For questions about the report, contact Ralph McLaughlin at ralph@openbrand.com
For press inquiries, contact press@openbrand.com
For full data access on a subscription basis, click the button below to request a demo of the offering.

The Appliance Market Is Weak, But It’s Not Falling Apart
While recent warnings about the appliance market collapsing deserve to be taken seriously, they should not be taken literally. Reports argue that North American appliance demand has fallen to levels similar to the Global Financial Crisis (GFC), driven by falling consumer confidence amid the conflict in Iran, citing a 7.4% first-quarter industry decline and a 10% March decline in U.S. appliance demand. That is a real slowdown, especially for manufacturers with high fixed costs and heavy North American exposure. But recent public data releases (more on this below) does not support a broader “near collapse” narrative for the appliance sector—at least not in Q1.
The better read is this: appliances are in a correction after the pandemic pull-forward. Appliance sales are being squeezed by weak housing turnover, tariff-related pricing turbulence, higher household energy bills, and a sudden fuel-cost shock.
According to the National Association of Realtors, existing-home sales remained sluggish in March 2026, down 3.6% from February and below the prior-year pace. While the market had optimism that lower rates would help the housing market, and thus the appliance market, rebound, that hasn’t yet happened.
What’s more, the White House’s April 2025 tariff announcement added a baseline 10% tariff on all countries and higher reciprocal tariffs for certain trading partners, and later steel-tariff expansions swept refrigerators, dryers, washing machines, dishwashers, freezers, stoves, ovens, and disposals into derivative-product coverage.
The pressure did not stop there: an April 2026 White House proclamation revised Section 232 metals tariffs so derivative articles substantially made of steel, aluminum, or copper are subject to 25% on full value, while products made entirely or almost entirely of those metals pay 50% on full value. EIA electricity data show residential electricity prices also rose 9.5% year over year in January 2026, a reminder that energy bills can pressure household budgets while also changing the value proposition for efficient appliances. Oil added another hit to discretionary purchasing power: EIA’s petroleum market update reported that crude oil and petroleum-product prices increased significantly in the first quarter of 2026, with average U.S. retail gasoline at $3.99 per gallon and diesel at $5.40 per gallon on March 30, the highest real levels in more than two years.
While these are certainly near-term headwinds, other evidence does not support the case for a prolonged catastrophe.
The Clean Comparison: Q1 2026 Versus the Last Two Shocks
The strongest test of the “worst since the Global Financial Crisis” claim is not whether the performance of the appliance market appears weak today. It is whether the current public data resembles the two most obvious stress periods: the 2008-2009 crisis and the 2020 pandemic recession. On that test, the evidence is much less dramatic than the headline.
If we line up three quarterly year-over-year measures—real electronics and appliance store retail sales, real appliance shipments and the BEA’s real appliance quarterly quantity index—all three surely softened in the first quarter of the year, but none looks remotely like the GFC trough. In the first three months of the year, real electronics and appliance retail sales were up 2.4% year over year, the BEA real appliance quantity index was up 1.7%, and real appliance shipments were down just 0.3%.
The GFC comparison is stark. The same data show real electronics and appliance retail sales falling 14.7% year over year in the second quarter of 2009, the BEA real appliance quantity index falling 13.2%, and real appliance shipments falling 16.5%. The current quarter is softer than normal, but the gap between today’s data and those GFC readings is the difference between a late-cycle slowdown and a true demand shock.
The pandemic comparison is more complicated, but it still does not support a “sector collapse” narrative for the start of this year. These same data show real electronics and appliance retail sales plunging 41.2% year over year in the second quarter of 2020, almost certainly reflecting store closures and channel disruption as much as end-demand destruction. Yet the BEA real appliance quantity index was still up 6.7% year over year in the second quarter of 2020, and real appliance shipments were down 7.7%. In other words, 2020 was a channel shock with a violent retail-sales air pocket; the current period looks more like a mild deceleration across several indicators.
Sentiment and the Iran War are Not Enough to Explain a Down Quarter
The recent appliance doomsday argument also points to weak consumer sentiment resulting from (?) the Iran war. CNBC reported that a well-known appliance manufacturer attributed a “recession-level decline” in the U.S. industry to the conflict in Iran and a drop in consumer confidence in late February and March. That may be directionally right as a description of household anxiety, especially given the fuel-price shock. But it is a weaker explanation for a full-quarter appliance-demand collapse than the headline suggests.
Start with sentiment. The University of Michigan survey is still useful as a measure of mood, but it has become a much less reliable guide to actual spending behavior. Recent research from Brookings found that since the pandemic, consumer attitudes have become “divorced” from underlying economic conditions and that consumers showed “no evidence of any belt-tightening” in aggregate spending even while sentiment remained deeply depressed. That builds on an older Brookings review of the Michigan sentiment index, which found that sentiment’s incremental forecasting value is small once other readily available economic variables are included. In plain English, low sentiment can help explain why households feel bad. It no longer predicts, by itself, that they are cutting appliance purchases at recession-trough rates.
The timing of the Iran war has a similar problem. The initial U.S. military operation began on February 28, which means the shock effectively arrived only in the March. That timing can plausibly affect March traffic, confidence, gasoline prices, and big-ticket caution. It is harder to argue that a conflict beginning at the end of February explains the full first-quarter pattern unless the weakness was already present for other reasons.
The Caveat: Inventories are a Yellow Flag of Caution
The bearish case gets stronger on inventories. The Census M3 household-appliance inventory-to-shipments ratio reached 1.77 in the first quarter, above the 1.32 GFC-window peak and the 1.45 pandemic-window peak. That is not a trivial warning sign. It suggests the manufacturer side may be carrying too much product relative to current shipment velocity, which can pressure pricing, margins, production schedules, and promotional intensity.
But even here, the interpretation should be careful. The Census full report says inventories are reported at current cost or market value, so the ratio can be pushed around by price, mix, and valuation changes as well as by physical unit overhang. In a sector dealing with tariff-related input cost changes, pricing resets, and volatile metals exposure under the April 2026 metals-tariff revisions, a high dollar-value inventory ratio is a serious caution flag but not a clean unit-demand collapse signal.
Trade Association Data is Better Than Vibes, But it Still Has Limits
What’s also likely the case is that appliance manufacturers’ leadership also has access to trade association shipment data and is using that data to support the claim that shipments are the worst since the GFC. If this is the case, it’s important to note that industry association shipment data often depends on manufacturer participation, reporting coverage, and revisions. The Association of Home Appliance Manufacturers (AHAM) provides detailed appliance shipment data, but data access is behind a paywall. That paywall matters because outsiders cannot easily inspect the full history, category definitions, revisions, or reporting consistency behind any headline monthly figure.
The AHAM data can still be useful, especially because it is closer to appliance units than broader retail proxies. But it is still an industry shipment series, not a complete read on consumer sell-through, and it is subject to the same, if not greater, weaknesses as the public sources: manufacturer participation, changing coverage, revisions, timing noise, and potential gaps between factory shipments and end-market demand. Even the public Census M3 program, which is more transparent than most private or association series, has limits: the Census M3 full report says the survey is voluntary, based on roughly 4,700 reporting units representing about 3,000 companies, and not based on a probability sample; Census also says estimates are subject to survey error and revision.
That does not make these data useless. It means balanced, triangulated interpretation and contextualization is important. A single quarter of weak manufacturer-reported industry demand can be a genuine warning sign without being a definitive macro diagnosis. If participation, late responses, revisions, pricing resets, and channel inventory shifts all move at once, the first estimate can easily make the cycle look more dramatic than it will look after revisions, especially if other signals point in different directions.
The Bearish Case is Real, but Narrower than a GFC-Style “Collapse”
There are several legitimate reasons to stay cautious. The still-soft housing market shown in NAR’s existing-home-sales data is a drag because fewer moves mean fewer appliance packages tied to home sales, renovations, and builder activity. Tariff and pricing changes under the April 2025 tariff regime can pull demand forward, then create an air pocket after list-price increases. Higher electricity, gasoline, and diesel costs shown in EIA electricity data and EIA petroleum-price reporting can also make households more cautious about big-ticket purchases, even when efficient appliances have a long-run savings story.
But those factors describe a cyclical squeeze, not an industry implosion. Replacement demand still exists. The installed base still ages. Efficiency upgrades still matter. Most importantly, BEA, Census MARTS, and Census M3 data still show 2026Q1 real appliance demand, retail-channel sales, shipments, and orders performing far better than the clear stress points of the Global Financial Crisis or the pandemic recession.
There is also a credible case for upside if the macro backdrop stops getting worse. A rebound in the U.S. housing market would matter because stronger turnover would support appliance packages tied to home sales, renovations, and replacement activity after the softness visible in NAR’s existing-home-sales data. A resolution of the Iran conflict would not erase the first-quarter shock, but it could ease the fuel-price and confidence pressure described in EIA’s petroleum-price reporting. And a more predictable tariff environment, after the 2025 and 2026 changes laid out by the White House and the later metals-tariff revisions, would give manufacturers and retailers a clearer basis for pricing, promotion, and inventory decisions.
A Better Read on the 2026 Appliance Market
Recent earnings doomsday comments are best read as a company-level and category-cycle warning, not a clean read-through to the entire appliance industry. However, comments from manufacturers’ leadership captures something important: the market is uncomfortable, discretionary demand is weak, inventories are elevated, and pricing is messy. But if the claim is that the first quarter of the year looked like the GFC or pandemic recession and that a collapse is imminent, I’m not buying it based on analysis of other publicly available data. At least not yet.
A better headline is simpler: though the appliance industry has softened and the cycle is uneven, it is not yet showing signs of a collapse.
Uncover How This Impacts Your Business
If you’re trying to make sense of what this means for your business, it’s worth getting a current read on the market. You can connect with our Chief Economist, Ralph McLaughlin, for a more grounded view of where things are heading.

Consumer Price Index: Durable Goods | April 2026
This is the May 2026 release of the OpenBrand Consumer Price Index (CPI) – Durable Goods report that covers price movements in April 2026.
DISCLAIMER: This report is provided ‘as is’ for informational purposes only. OpenBrand makes no representations or warranties regarding the accuracy, completeness, or reliability of the data. Users assume all risks associated with their use of this report. OpenBrand shall not be liable for any losses or damages arising from the use of this report.
Promotions Limit Appliance Price Growth Despite Macroeconomic Pressures
In April, price growth for consumer durable goods accelerated with a month-over-month (MoM) increase of +0.42%. This is up from a revised monthly +0.38% increase in March. Across our four product groups, three showed month-over-month acceleration, with home improvement showing the only price growth slowdown. While the appliance group is amongst the three that showed an acceleration in price growth month-over-month, the longer run trend has been downwards. In this month’s OpenBrand CPI-DG report, we take a deeper look at what (and who) has been driving this trend.
Appliance prices have generally trended downward in recent years due to globalized manufacturing, strong retail competition, and production efficiencies that have limited pricing power. More recently, despite rising oil prices, appliance prices have shown little increase as manufacturers and retailers absorb higher costs or offset them through promotions and supply chain adjustments. In this release of the OpenBrand CPI of Durable Goods, we take a deeper dive into appliance price movements.
Much of this downward trend has been driven by smaller appliances—such as air purifiers, countertop cooking products, and vacuums—where rapid innovation, lower price points, and intense competition have put consistent downward pressure on prices. In contrast, price movements among larger appliances have been more mixed: refrigerators have generally trended flat to slightly downward, while categories like dishwashers and ranges have seen more upward pressure, reflecting differences in cost structures, feature upgrades, and pricing dynamics across major appliance segments.
While larger appliances have not experienced the same degree of price easing as smaller appliances, promotional activity suggests the story is more nuanced. As shown in the chart below, LG Electronics stands out with significantly higher promotional activity compared to the same period last year, indicating that even in categories with more stable or rising price trends, consumers can still find meaningful deals through increased discounting.
Table of Contents
- Key CPI Takeaways for April 2026 & Macroeconomic Outlook
- Product Group Highlights
- CPI 2026 Forecast: Macroeconomic Summary
- Methodology
April 2026 OpenBrand CPI Summary and Macroeconomic Outlook
Overall OpenBrand Consumer Price Index Movement: The OpenBrand CPI of Durable Goods recorded a +0.42% monthly change in April, notching the twenty-second consecutive month-over-month increase and 24th of the last 25th months. All product groups experienced price growth this month.
Discount Trends: April brought mixed changes in discount activity to the durable goods sector, with magnitude month-over-month falling to 19.1% of all durable goods from 19.3% in the month prior. The typical frequency increased to 25.7%, up from 25.2% the month prior.
Product Group Price Trends: Prices of all groups climbed month-over-month, while all product groups except Home Improvement experienced a slowdown in the rate of growth from the month prior. The group summary is as follows:
- Appliance Group (+0.08%)
- Communication Group (+0.50%)
- Home Improvement Group (+0.14%)
- Recreation Group (+0.87%)
Product Group Highlights
CPI: Appliances
Prices for appliances increased on a month-over-month basis in April to +0.08%, rising from a revised -0.01% in the month prior. The positive price growth was at least partially driven by the typical discount magnitude decreasing to 17.0% from 17.2%, while the frequency of discounts increased to 41.3% from 41.1% the month prior. The discount frequency has been trending upwards for numerous months for the appliance group, beginning in December 2025 and continuing into 2026.
CPI: Communication
Prices of communication devices, including phones, tablets, computers, and printers, rose on a month-over-month basis to +0.50%, up from a revised +0.33% the month prior. Discount frequency decreased from 15.2% to 14.7%, while magnitude remained unchanged at 19.3% from March to April. The acceleration in price growth was at least partially driven by the decrease in frequency of discounts.
CPI: Home Improvement
Prices for home improvement goods experienced a deceleration in growth this month, decreasing to +0.14% on a month-over-month seasonally-adjusted basis in April, falling from a revised +0.44% in the month prior, showing 55 consecutive month-over-month flat or monthly increases. The deceleration in price growth was at least partially driven by the increase in the typical discount frequency (up almost 2 percentage points from last month).
CPI: Recreation
The rate of price growth of recreational products, including TVs, headphones, and speaker systems, experienced acceleration this month, increasing to +0.87% on a month-over-month seasonally-adjusted basis in April, up from a revised +0.67% in March. Both discount magnitude (from 23.7% in March to 23.8% in April) and discount frequency (from 31.7% in March to 32.0% in April) grew slightly this month, but prices for the recreation group also grew. Given this price growth in the face of both a higher discount magnitude and an increase in frequency of discounts, it is most likely that shelf prices for recreation products were set higher in April.
Macroeconomic Outlook Update
As of May 2026, the outlook for the U.S. durable goods sector is mixed, shaped by both cost pressures and resilient consumer activity. Key demand indicators are showing signs of strength: Retail Sales and Consumer Confidence are both on the rise in 2026. Personal Consumer Expenditures are up by $195.4 billion as of March 2026.
A sharp rise in global energy prices, driven largely by disruptions in the Middle East and constrained flows through the Strait of Hormuz, however, has significantly increased production, transportation, and input costs. Oil benchmarks such as Brent Crude are now projected to average around $105 per barrel in the second quarter, a dramatic upward revision that is feeding into broader inflation.
For durable goods manufacturers, this translates into sustained cost pressure across materials like steel, plastics, and electronic components, as well as higher logistics expenses. As a result, pricing flexibility remains limited, keeping appliance and other durable goods prices elevated despite promotional activity.
At the same time, monetary policy has turned more restrictive, adding another layer of pressure to interest-rate-sensitive purchases. The Federal Open Market Committee is now expected to delay rate cuts until December 2026. This shift is already weighing on demand: real GDP growth is decreasing in 2026. For the durable goods sector this environment suggests increased reliance on discounting to stimulate sales.
Labor market conditions are also softening, further complicating the outlook. The hiring rate continues to fall, currently reported at 3.1%. Large layoffs are not currently happening, but nor are companies increasing their hiring. Slower income growth and rising uncertainty are likely to dampen consumer confidence, particularly for discretionary durable goods purchases. For manufacturers and retailers of durable goods, this combination of cost inflation and weakening demand creates a difficult balancing act between maintaining margins and preserving market share.
Looking ahead, persistently high oil prices could further erode growth and push inflation higher, potentially delaying monetary easing even longer. Additional geopolitical escalation or damage to key energy infrastructure could amplify these effects. Until more relief occurs – such as what is happening with keeping tariffs below the maximum rate – then, the durable goods sector is likely to operate in a constrained environment defined by elevated costs, cautious consumers, and limited policy support.
Note: This summary is based on data available as of early May 2026 and may be subject to revisions in future releases. Special thanks to Jordan Carter, Lauren Finck, and Bryce Tecson for their contributions to this month’s report.
For questions about the report, please contact Ralph McLaughlin at ralph@openbrand.com
For press inquiries, please contact press@openbrand.com
About the OpenBrand CPI
This report offers insights into price trends across major consumer product categories representing a select mix of both durable goods (see methodology below for more details). The data used in this report leverages OpenBrand’s industry-leading library of durable goods pricing, promotion, and availability for over 1.4 million individual products. This is more than ten times the coverage by the monthly Bureau of Labor Statistics (BLS) Consumer Price Index, allowing more timely and granular reporting of price changes in the market.
This free monthly report provides a broad summary of price changes (including promotional activity), category-specific pricing and promotional trends, and macroeconomic context. For those seeking deeper insights, weekly CPI reporting and monthly CPI forecasts (released next week) are available on a subscription basis with up to same-day SKU-level pricing data available in bulk downloadable files.
Subscribe
Get CPI & Real-Time Pricing Data Updates
The OpenBrand CPI-Durable Goods is released monthly. Join our subscription list to be notified when new CPI data is available.
OpenBrand Methodological Notes
The OpenBrand CPI of Durable Goods is constructed using a data-driven methodology that ensures accuracy, timeliness, and transparency in measuring price trends for both short and long-lasting consumer products. The methodology consists of the following key components:
Data Collection
- Real-Time Price Tracking: Prices are sourced daily from online marketplaces, retail websites, and brick-and-mortar store listings.
- Retailer & Manufacturer Data: Aggregates pricing information from major retailers, direct-to-consumer brands, and wholesale suppliers into broader consumer categories.
- Temporal Coverage: Captures price variations over time, including daily discounts and price promotions
Product Selection & Tracking
- Durable and Goods Focus: The index includes products with an expected lifespan of three years or more, such as home appliances, consumer electronics, and tools.
- Brand & Model Tracking: Individual brands and models are monitored to reflect pricing shifts within competitive product segments, including both permanent changes in listing price as well as temporary promotional pricing.
Price Calculation, Adjustments, and Weighting
- Price Calculation: Tracks month-over-month and year-over-year price movements to measure price stability in the marketplace and take into account both longer-term changes in pricing (such as changes in manufacturer’s suggested retail price) as well as more short-term changes in pricing, such as promotional discounts and sales prices.
- SKU-Removal Instead of Hedonic Adjustments: When a product (or SKU) becomes unavailable in the BLS goods basket, the BLS implements a SKU-replacement procedure whereby the next most similar product is used in its place, and a quality (hedonic) adjustment procedure is performed to get closer to an apples-to-apples price comparison. Since OpenBrand has data on nearly 100% of the SKUs pricing history in a given product category, we can simply remove that SKU from the basket and rely on price changes of the remaining SKUs in that basket. This eliminates the need for hedonic adjustment in the OpenBrand CPI basket.
- Weighting and Aggregation Method: A weighted geometric mean formula is used to minimize volatility and improve stability in price trend analysis at both the product grouping and category level. Instead of using sales-volume weights when aggregating the index, we take an alternative approach by using persistence-based weights for aggregation. Instead of more frequently purchased items getting more weight in the BLS’ CPI calculation, OpenBrand takes a more novel approach by weighting items with a more established price history in the market more heavily in our CPI calculation than items with a less established history.
Reporting & Updates
- High-Frequency Updates: Published freely on a monthly basis, with a subscription option for daily summaries across categories, sub-categories, and individual products.
- Comparative Benchmarks: We aggregate pricing as analogously as possible to traditional BLS CPI measures for benchmarking purposes.
- Transparency & Accessibility: Provides both open and paid data access for journalists, researchers, businesses, and policymakers.
By leveraging real-time data and advanced statistical techniques, the OpenBrand CPI offers an accurate and dynamic measure of pricing trends, helping businesses and consumers make informed decisions in an evolving economic landscape.
OpenBrand CPI - Durable Goods
Groups and Products
Appliance Group
Air Conditioners
Air Purifiers
Beverage Coolers
Blenders
Coffee Makers
Cooktops & Wall Ovens
Countertop Cooking
Countertop Microwaves
Dehumidifiers
Dishwashers
Dryers
Freezers
Icemakers
Laundry
Ranges
Refrigerators
Vacuums
Washers
OTR (Over-the Range Microwaves)
Communications Group
Business Printers
Desktops
Printers
Headsets
HED
Ink
Large Printers
MFP Copiers
Monitors
Notebooks
Personal & SOHO Printers
Projectors
Smartphones
Tablets & Detachables
Toner
Wearables
Wireless Routers
Recreation Group
Bluetooth Speakers
Bluray
Digital Camcorders
Digital Cameras
Headphones
Media Players
Photo Paper
Sewing Machines
Sound Bars
Speaker Systems
TVs
VAW Speakers
Home Improvement Group
Bathroom Faucets
Bathroom Sinks
Bathroom Vanity
Bathtubs
Cutting Machines
Carpets
Door Locks
Exterior Paints
Exterior Stains
Floor Tiles
Garden Hoses
Generators
Grass Seed
Handhelds
Hand Tools
Hardwood Flooring
Interior Paints
Interior Stains
Kitchen Cabinets
Kitchen Cleanup
Kitchen Faucets
Lawn Fertilizer
Lawn Products
Log Splitters
Mowers
Outdoor Cooking
Outdoor Cooking Accessories
Paint Supplies
Pesticides
Shower Stall and Enclosures
Power Tools
Power Tools Accessories
Pressure Washer
Replacement Batteries
Shower Doors
Shower Heads
Smart Doorbells
Smart Locks
Smart Cameras
Smart Thermostats
Snow Throwers
Spray Paint
Toilets
Vinyl Flooring
Water Filtration
Weed Killer
PREPARED BY
Contact Us
For questions about the report, contact Ralph McLaughlin at ralph@openbrand.com
For press inquiries, contact press@openbrand.com
For full data access on a subscription basis, click the button below to request a demo of the offering.
The State of Durables: How the 2026 Oil Shock is Shifting Economic Expectations
Insights from OpenBrand’s Q2 State of Durables Macroeconomic Update
While the economic outlook for 2026 remains broadly positive, the recent oil price shock has introduced fresh uncertainty. Rising energy costs have added pressure across both supply chains and household budgets, tempering expectations for a full post-tariff recovery this year.
The consumer durables market sits at the center of this tension. On one hand, pent-up demand, improving supply chains, and expectations for a housing market rebound could support a solid year for products like appliances and electronics. But higher input costs and shifting consumer priorities may begin to weigh on purchasing behavior as energy prices remain elevated.
As the broader economy continues to show mixed signals, the strength of consumer demand will depend on how quickly stability returns to energy markets and how inflationary pressures are contained. In this environment, brands and retailers will have to continue to adapt to unpredictable supply chains and adjust pricing as consumers grow increasingly pessimistic about the state of the economy.
In our latest State of Durables macroeconomic update, OpenBrand CEO Greg Munves and I broke down our latest insights across macroeconomic indicators including inflation, consumer sentiment, and more. Watch the full episode above or read on for more insights.
Inflation in Durables
Data tracked by OpenBrand showed that price growth across consumer durable goods rose modestly in March, with a month-over-month increase of +0.43%, a slight uptick from February. While there has been some speculation that inflation would accelerate more significantly in March due to spiking oil prices, some of the muted rise could have been due to a barrage of discounting events at the end of the month, led by Amazon.
The US is a net energy exporter—meaning that it doesn’t depend on other countries for its energy supply—which may help shelter the American economy from the worst of the 2026 oil shock. That said, gas prices have risen significantly in recent weeks, weighing on household budgets. And producers pay transportation, shipping, and logistics costs that are directly impacted by higher energy costs and can trickle into consumer prices.
In the months ahead, we’re watching to see whether the energy shock is a short-lived hit or a prolonged macroeconomic headwind. That will impact retailer pricing and promotion decisions this summer, as well as whether consumers tighten their spending or trade down to more affordable options.
GDP Impact on Durables
The government shutdown at the end of the year negatively impacted overall economic growth, though we expect that impact to be short-lived, with a rebound in the first and second quarters of this year. In addition to the government reopening in mid-November, the One Big Beautiful Bill Act may also act as a stimulus as a result of Americans receiving larger-than-usual tax refunds.
Consumers often use tax refunds or other bonuses to make long-awaited home improvements. As Greg noted in the discussion: What better way to spend your refund from the government than on a new refrigerator or oven?
Labor Market
Slow job growth in January and February of this year, in addition to revisions to 2025 data that put net job growth close to zero, created some pessimism when it comes to the US labor market. In March, however, payrolls increased by over 170,000, according to data from the Bureau of Labor Statistics.
Federal Reserve research indicates that the so-called “breakeven” point for job growth may be settling near zero, driven by a shrinking labor force participation rate, weak population growth, and low net immigration. As a result, negative job growth may be almost as likely as positive job growth in any given month, as was represented at the start of this year. A few years ago, a payrolls increase of less than 100,000 would’ve raised alarms, but the Federal Reserve research suggests that such figures are probably part of a new normal.
Productivity has also increased as a result of AI and other innovations, which may substitute for the decline in worker participation in the years ahead. One of the major sources of economic growth may be less about hiring people, and more about productivity and investment in data centers and technology. If the productivity trend continues, this would actually tend to push prices downwards, all else equal.
U.S. Retail Sales and Consumer Sentiment Trends
At the start of the year, the American consumer continued to show signs of resiliency. In February, consumer spending grew by 3.7% from a year earlier, representing widespread growth across in-store shopping, general merchandise, and more.
Despite the uptick in expenditures, University of Michigan consumer sentiment numbers show that the American consumer is the most pessimistic they’ve been in the 80 year history of the dataset.
The question here is whether to trust how people feel about the economy or how they actually act. A similar dynamic emerged with tariffs last year; when a huge dive in consumer sentiment contrasted with data that suggested consumers didn’t spend any less.
I might not feel too great about my lawn care bill, Greg said in the discussion, but that doesn’t necessarily mean I’m going to stop taking care of my lawn.
As the impact of the 2026 oil shock moves through the economy, we’re watching to see whether expenditure data from March and beyond will ultimately match what appears to me a broadly negative feeling about the state of the economy.
Key Considerations During 2026 Oil Shock
For Durables Brands and Retailers
- With oil-driven cost pressures top-of-mind across the economy, brands and retailers will need to carefully manage pricing and promotions to protect margins without leading to demand destruction.
- Close monitoring of macroeconomic signals-especially inflation trends, productivity investments, and geopolitical developments-is essential to anticipate changes in consumer demand and adjust strategy accordingly.
- Clear differentiation—either through quality, features, or price—is key to attracting consumers as larger-than-usual tax refunds stimulate spending.
- Supply chain flexibility remains a priority as volatility in energy prices puts pressure on transportation and logistics for many brands and manufacturers.
Want to better understand how to adapt to the changing macroeconomic environment? OpenBrand offers a Durables-grade Consumer Price Index that provides a nuanced look at price inflation specific to the market, real-time pricing data, and custom economic forecasting based on ever-shifting scenarios.
Subscribe to OpenBrand's Newsletter
Monthly State of Durables Updates
Subscribe to our newsletter for monthly updates on how the current macroeconomic environment is impacting the durables market – and get our quarterly State of Durables update delivered to your inbox.

Consumer Price Index: Durable Goods | March 2026
This is the April 2026 release of the OpenBrand Consumer Price Index (CPI) – Durable Goods report that covers price movements in March 2026.
DISCLAIMER: This report is provided ‘as is’ for informational purposes only. OpenBrand makes no representations or warranties regarding the accuracy, completeness, or reliability of the data. Users assume all risks associated with their use of this report. OpenBrand shall not be liable for any losses or damages arising from the use of this report.
Inflation Inches Up in March in the Face of Big Spring Sale Promotions
In March, price growth for consumer durable goods accelerated after a slight slowdown in February, with a month-over-month (MoM) increase of +0.43%. This is up from a revised monthly +0.37% increase in the month prior. Across our four product groups, all showed month-over-month acceleration, with the appliance group continuing to show moderate price declines. While there has been some speculation that inflation would accelerate much faster in March due to spiking oil prices, some of the muted rise could have been due to a barrage of discounting events in the last week of April, led by Amazon.
During the Spring 2026 discounting period, BestBuy.com and Walmart.com were leading the pack on markdowns in durable goods. BestBuy.com’s promotions climbed just above 41%, giving it the broadest discounting stance among the major retailers tracked, with Walmart.com close behind at roughly 24%. Amazon.com followed with discounts near 37%, while Target.com and HomeDepot.com trailed at about 20% and just under 10%, respectively. For shoppers, the Spring 2026 landscape meant the most aggressive deals were concentrated at BestBuy.com, with Walmart.com also competing strongly on price.
The more interesting story, however, is how far each merchant moved away from its “normal” discounting pattern during the Spring 2026 discounting period. Target.com shows the most pronounced shift, with discounts roughly doubling from 7.5% in early March to about 20% in that discount window—a clear sign of a late‑month promotional push. Walmart.com also meaningfully increased promotions, stepping up from roughly 21% to about 24%, whereas Amazon.com and BestBuy.com layered in only modest additional discounting and HomeDepot.com actually eased back from its early‑March levels. In absolute terms, BestBuy.com was the standout discounter, but in relative terms, Target.com’s surge in promotional intensity marks it as the retailer that leaned hardest into deals as March drew to a close.
Table of Contents
- Key CPI Takeaways for March 2026 & Macroeconomic Outlook
- Product Group Highlights
- CPI 2026 Forecast: Macroeconomic Summary
- Methodology
March 2026 OpenBrand CPI-DPG Summary and Macroeconomic Outlook
Overall OpenBrand Consumer Price Index Movement: The OpenBrand CPI of Durable Goods recorded a +0.43% monthly change in March, notching the sixteenth consecutive month-over-month increase and 21st of the last 22nd months. There was a decent increase in price growth this month. This increase is within a range we typically see when going into March from February.
Discount Trends: March brought mixed changes in discount activity to the durable goods sector, with frequencies month-over-month falling to 19.0% of all durable goods from 19.3% in the month prior. The typical magnitude increased to 25.1%, up from 23.0% the month prior.
Product Group Price Trends:
All product groups experienced an uptick in the rate of growth from the month prior, with prices of all groups except Appliances climbing month-over-month. The group summary is as follows:
- Appliance Group (-0.04%)
- Communication Group (+0.59%)
- Home Improvement Group (+0.67%)
- Recreation Group (+0.77%)
Product Group Highlights
CPI: Appliances
Prices for appliances increased on a month-over-month basis in March to -0.04%, rising from a revised -0.11% in the month prior. The positive price growth was at least partially driven by the typical discount magnitude decreasing to 17.0% from 17.9%, while the frequency of discounts increased over 4.5 percentage points to 42.2% from 37.6% the month prior. This is the largest increase in discount frequency month-over-month when looking at the past 13 Marches, which is four percentage points higher than its last peak in month-over-month discount frequency growth, for the Appliance group. This large increase in discount frequency could be attributed to tariffs currently making less of an impact on pricing, allowing both manufacturers and retailers to pass along these savings to consumers.
CPI: Communication
Prices of communication devices, including phones, tablets, computers, and printers, rose on a month-over-month basis to +0.59%, up from a revised -0.12% the month prior. The frequency and magnitude of discounts both grew in March. Frequency increased from 14.5% to 15.1%, while magnitude grew from 19.0% to 19.3% from February to March. The increase in both frequency and magnitude of discounts would lead us to expect a decrease in prices, however, since prices of communication devices increased in March, it could be that shelf prices were set higher.
CPI: Home Improvement
Prices for home improvement goods experienced a deceleration in growth this month, increasing to +0.67% on a month-over-month seasonally-adjusted basis in March, growing from a revised +0.51% in the month prior, showing 36 consecutive month-over-month flat or monthly increases. The acceleration in price growth was at least partially driven by the decrease in both the typical discount frequency (10.6% from 10.7% the month prior) and the typical magnitude of discounts (16.1% from 16.4% the month prior).
CPI: Recreation
The rate of price growth of recreational products, including TVs, headphones, and speaker systems, experienced acceleration this month, increasing to +0.77% on a month-over-month seasonally-adjusted basis in March, up from a revised +0.74% in February. Some of this increase in the pace of price growth is at least partially due to a slight decrease in the average magnitude of discounts – down to 23.8% from 24.0%.
The frequency of discounts experienced an uncharacteristically high increase for March– up sharply to 32.3% in March from 29.3% in February (increasing by 3 percentage points). With this large increase in discount frequency, we would expect prices to fall for recreation products. Since prices rose this month, it is most likely that shelf prices for recreation products were set higher.
Macroeconomic Outlook Update
As of April 2026, the U.S. macroeconomic backdrop reflects a transition from a disinflationary environment toward a more uncertain, shock-driven phase. Entering the year, underlying inflation—particularly in core goods—had been moderating, supported by easing supply chains, softer demand for consumer durables, and normalization in categories like appliances, vehicles, and furnishings. This trend pointed toward stable or even modestly declining prices for many durable goods, especially as retailers continued to rely on discounting to stimulate demand.
However, the escalation of the military conflict involving Iran has introduced a meaningful upside risk to inflation through energy markets. Oil prices have risen sharply amid concerns about disruptions to global supply, particularly through the Strait of Hormuz, which handles a significant share of global energy flows. Recent price spikes—pushing crude oil toward or above $100 per barrel—are already feeding into higher gasoline and transportation costs, with broader pass-through effects expected across goods categories.
The impact on durable goods prices is likely to be indirect but material. Higher energy costs raise input prices for manufacturing, shipping, and logistics, which can slow or reverse the recent disinflation in goods. At the same time, there is typically a lagged demand effect: while consumers initially absorb higher fuel costs, real consumption tends to weaken in subsequent months, putting downward pressure on discretionary categories. This creates a mixed environment where cost pressures push prices up even as weakening demand limits pricing power.
From a macro perspective, this dynamic introduces a mild stagflationary risk. Elevated energy prices are expected to lift headline inflation in the near term—potentially by several tenths of a percentage point—while also weighing on GDP growth and household spending. The Federal Reserve is therefore likely to face a policy tradeoff, as tightening policy to combat energy-driven inflation could further dampen growth, while easing risks allowing inflation expectations to reaccelerate.
Overall, the outlook for price growth in 2026 has shifted from a steady moderation to a more uneven path. Durable goods prices are likely to remain relatively subdued compared to recent years but may stabilize or rise modestly as energy costs filter through supply chains. The key determinant going forward will be the duration of the conflict and whether energy prices remain elevated or begin to normalize later in the year.
Note: This summary is based on data available as of early April 2025 and may be subject to revisions in future releases.
For questions about the report, please contact Ralph McLaughlin at ralph@openbrand.com
For press inquiries, please contact press@openbrand.com
About the OpenBrand CPI
This report offers insights into price trends across major consumer product categories representing a select mix of both durable goods (see methodology below for more details). The data used in this report leverages OpenBrand’s industry-leading library of durable goods pricing, promotion, and availability for over 1.4 million individual products. This is more than ten times the coverage by the monthly Bureau of Labor Statistics (BLS) Consumer Price Index, allowing more timely and granular reporting of price changes in the market.
This free monthly report provides a broad summary of price changes (including promotional activity), category-specific pricing and promotional trends, and macroeconomic context. For those seeking deeper insights, weekly CPI reporting and monthly CPI forecasts (released next week) are available on a subscription basis with up to same-day SKU-level pricing data available in bulk downloadable files.
Subscribe
Get CPI & Real-Time Pricing Data Updates
The OpenBrand CPI-Durable Goods is released monthly. Join our subscription list to be notified when new CPI data is available.
OpenBrand Methodological Notes
Special Note on Methodology Update — OpenBrand Consumer Price Index
Change to the OpenBrand CPI of Durable Goods
Beginning with this release, personal care products will no longer be included in the OpenBrand Consumer Price Index (CPI monthly report. February was the final month in which personal care categories are incorporated into the headline index.
This methodological update reflects a strategic refinement of the OpenBrand CPI’s core objective: to measure price and discount trends exclusively within the consumer durable goods sector. While personal care products provide valuable insight into broader retail pricing dynamics, their pricing behavior and promotional cycles differ meaningfully from those of durable goods. Removing these categories will enhance the precision and interpretability of the index as a focused measure of durable goods inflation and discounting activity.
To preserve historical continuity and analytical comparability, all future releases of the OpenBrand CPI and the OpenBrand CPI NowCast will include back-calculated index values with personal care products removed. This revised historical series will allow users to evaluate long-term trends on a consistent methodological basis and ensure that month-over-month and year-over-year comparisons remain accurate.
This refinement strengthens the OpenBrand CPI’s role as a high-frequency, data-driven indicator of pricing power, discount intensity, and inflation trends across consumer durable goods. We believe this update will improve clarity for policymakers, industry stakeholders, investors, and media users who rely on the index for timely insight into the durable goods marketplace.
Adding Seasonal Adjustment
We now seasonally adjust our Consumer Price Index of Durable so that month-to-month changes are easier to interpret. Seasonal adjustment removes the predictable price patterns that tend to show up at the same time each year, such as holiday promotions, end-of-season markdowns, model changeovers, and other recurring retail cycles. This allows the index to better reflect underlying price movement rather than normal seasonal swings.
This matters especially for durablel goods, where pricing can be heavily influenced by promotions and product timing throughout the year. By seasonally adjusting the index, we can provide a clearer read on inflation trends and make comparisons across months more meaningful for clients and other users of the data.
We perform the adjustment itself using the U.S. Census Bureau’s X-13 seasonal adjustment method, a widely used statistical approach for monthly economic data. This procedure estimates and removes recurring seasonal patterns from the raw index while preserving the underlying trend and irregular month-to-month movements. We then calculate monthly changes from the seasonally adjusted index, which produces a cleaner measure of inflation momentum than using the unadjusted series alone.
Methodological Notes
The OpenBrand CPI of Durable Goods is constructed using a data-driven methodology that ensures accuracy, timeliness, and transparency in measuring price trends for both short and long-lasting consumer products. The methodology consists of the following key components:
Data Collection
- Real-Time Price Tracking: Prices are sourced daily from online marketplaces, retail websites, and brick-and-mortar store listings.
- Retailer & Manufacturer Data: Aggregates pricing information from major retailers, direct-to-consumer brands, and wholesale suppliers into broader consumer categories.
- Temporal Coverage: Captures price variations over time, including daily discounts and price promotions
Product Selection & Tracking
- Durable and Goods Focus: The index includes products with an expected lifespan of three years or more, such as home appliances, consumer electronics, and tools.
- Brand & Model Tracking: Individual brands and models are monitored to reflect pricing shifts within competitive product segments, including both permanent changes in listing price as well as temporary promotional pricing.
Price Calculation, Adjustments, and Weighting
- Price Calculation: Tracks month-over-month and year-over-year price movements to measure price stability in the marketplace and take into account both longer-term changes in pricing (such as changes in manufacturer’s suggested retail price) as well as more short-term changes in pricing, such as promotional discounts and sales prices.
- SKU-Removal Instead of Hedonic Adjustments: When a product (or SKU) becomes unavailable in the BLS goods basket, the BLS implements a SKU-replacement procedure whereby the next most similar product is used in its place, and a quality (hedonic) adjustment procedure is performed to get closer to an apples-to-apples price comparison. Since OpenBrand has data on nearly 100% of the SKUs pricing history in a given product category, we can simply remove that SKU from the basket and rely on price changes of the remaining SKUs in that basket. This eliminates the need for hedonic adjustment in the OpenBrand CPI basket.
- Weighting and Aggregation Method: A weighted geometric mean formula is used to minimize volatility and improve stability in price trend analysis at both the product grouping and category level. Instead of using sales-volume weights when aggregating the index, we take an alternative approach by using persistence-based weights for aggregation. Instead of more frequently purchased items getting more weight in the BLS’ CPI calculation, OpenBrand takes a more novel approach by weighting items with a more established price history in the market more heavily in our CPI calculation than items with a less established history.
Reporting & Updates
- High-Frequency Updates: Published freely on a monthly basis, with a subscription option for daily summaries across categories, sub-categories, and individual products.
- Comparative Benchmarks: We aggregate pricing as analogously as possible to traditional BLS CPI measures for benchmarking purposes.
- Transparency & Accessibility: Provides both open and paid data access for journalists, researchers, businesses, and policymakers.
By leveraging real-time data and advanced statistical techniques, the OpenBrand CPI offers an accurate and dynamic measure of pricing trends, helping businesses and consumers make informed decisions in an evolving economic landscape.
OpenBrand CPI - Durable Goods
Groups and Products
Appliance Group
Air Conditioners
Air Purifiers
Beverage Coolers
Blenders
Coffee Makers
Cooktops & Wall Ovens
Countertop Cooking
Countertop Microwaves
Dehumidifiers
Dishwashers
Dryers
Freezers
Icemakers
Laundry
Ranges
Refrigerators
Vacuums
Washers
OTR (Over-the Range Microwaves)
Communications Group
Business Printers
Desktops
Printers
Headsets
HED
Ink
Large Printers
MFP Copiers
Monitors
Notebooks
Personal & SOHO Printers
Projectors
Smartphones
Tablets & Detachables
Toner
Wearables
Wireless Routers
Recreation Group
Bluetooth Speakers
Bluray
Digital Camcorders
Digital Cameras
Headphones
Media Players
Photo Paper
Sewing Machines
Sound Bars
Speaker Systems
TVs
VAW Speakers
Home Improvement Group
Bathroom Faucets
Bathroom Sinks
Bathroom Vanity
Bathtubs
Cutting Machines
Carpets
Door Locks
Exterior Paints
Exterior Stains
Floor Tiles
Garden Hoses
Generators
Grass Seed
Handhelds
Hand Tools
Hardwood Flooring
Interior Paints
Interior Stains
Kitchen Cabinets
Kitchen Cleanup
Kitchen Faucets
Lawn Fertilizer
Lawn Products
Log Splitters
Mowers
Outdoor Cooking
Outdoor Cooking Accessories
Paint Supplies
Pesticides
Shower Stall and Enclosures
Power Tools
Power Tools Accessories
Pressure Washer
Replacement Batteries
Shower Doors
Shower Heads
Smart Doorbells
Smart Locks
Smart Cameras
Smart Thermostats
Snow Throwers
Spray Paint
Toilets
Vinyl Flooring
Water Filtration
Weed Killer
PREPARED BY
Contact Us
For questions about the report, contact Ralph McLaughlin at ralph@openbrand.com
For press inquiries, contact press@openbrand.com
For full data access on a subscription basis, click the button below to request a demo of the offering.

Consumer Price Index: Durable and Personal Goods | February 2026
This is the March 2026 release of the OpenBrand Consumer Price Index (CPI) – Durable and Personal Goods report that covers price movements in February 2026.
DISCLAIMER: This report is provided ‘as is’ for informational purposes only. OpenBrand makes no representations or warranties regarding the accuracy, completeness, or reliability of the data. Users assume all risks associated with their use of this report. OpenBrand shall not be liable for any losses or damages arising from the use of this report.
Inflation Growth Cools in February, Led by Falling Prices in Appliances and Communications
In February, price growth for consumer durables and personal goods accelerated after a strong but typical uptick in January, with a month-over-month (MoM) increase of +0.26%. This is down from a revised monthly +0.90% increase in the month prior. Across our five product groups, four showed month-over-month deceleration, with both the appliance and communications group showing moderate price declines. See below for more detail on which categories specially helped drive the decrease in these groups.
Within those groups, we see consistently strong downward movement in prices across the component categories. Within appliances, a full 14 of 16 categories saw price declines in February. Those appliance categories with the largest monthly declines include refrigerators (-0.76%), laundry (-0.71%), icemakers (-0.68%), vacuums (-0.62%), and countertop cooking (-0.52%).
Within communications, a little under a third of categories (5 of 18) witnessed price month-over-month price declines in February. Those communications categories with the largest monthly declines include wireless routers (-1.14%), ink (-0.66%), toner (-0.26%), monitors (-0.22%), and tablets/detachables (-0.14%).
Table of Contents
- Key CPI Takeaways for February 2026 & Macroeconomic Outlook
- Product Group Highlights
- CPI 2026 Forecast: Macroeconomic Summary
- Methodology
February 2026 OpenBrand CPI-DPG Summary and Macroeconomic Outlook
Overall OpenBrand Consumer Price Index Movement: The OpenBrand CPI of Durable and Personal Goods recorded a +0.26% monthly change in February, notching the fifteenth consecutive month-over-month increase and 20th of the last 21st months. Although there was a sharp decrease in price growth this month, this pattern is inline with what we typically see occurring as we move from January to February.
Discount Trends: February brought mixed changes in discount activity to the durables and personal goods sector, with frequencies remaining relatively flat month-over-month climbing only slightly to 22.7% of all durable and personal goods from 22.6% in the month prior. The typical magnitude decreased to 19.5%, down from 19.9% the month prior.
Product Group Price Trends: All product groups except personal care experienced a slowdown in the rate of growth from the month prior, with prices of all groups except appliances and communication climbing month-over-month. The group summary is as follows:
- Appliance Group (-0.25%)
- Communication Group (-0.23%)
- Home Improvement Group (+0.47%)
- Personal Care Group (+0.75%)
- Recreation Group (+0.54%)
Product Group Highlights
CPI: Appliances
Prices for appliances decreased on a month-over-month basis in February to -0.25%, falling from a revised +0.32% in the month prior. The negative price growth was at least partially driven by the frequency of discounts increasing to 37.6% from 36.8% the month prior, while the typical discount magnitude decreased only slightly to 17.7% from 17.9%.
CPI: Communication
Prices of communication devices, including phones, tablets, computers, and printers, fell on a month-over-month basis to -0.23%, down from a revised +0.36% the month prior. The frequency and magnitude of discounts both grew in February. Frequency increased from 13.5% to 14.5%, while magnitude grew by almost 1.5 percentage points from 17.6% to 19.0% from January to February. The decrease in prices of communication devices most likely was led by the growth in both the frequency & magnitude of discounts; the decrease being especially emphasized by the decent increase in magnitude of discounts.
CPI: Home Improvement
Prices for home improvement goods experienced a deceleration in growth this month, decreasing to +0.47% on a month-over-month basis in February, falling from a revised +0.70% in the month prior, showing 30 consecutive month-over-month flat or monthly increases. The deceleration in price growth was at least partially driven by the increase in the typical discount frequency (10.6% from 10.0% the month prior), while the typical magnitude of discounts decreased (16.3% from 17.3% the month prior).
CPI: Personal Care
Prices of personal care products grew sharply on a monthly basis in February by +0.75%. Some of this increase may be due to the sizeable decreases in both the magnitude of discounts (falling by almost 1.5 percentage points from 22.2% in January to 20.6% in February) & in the frequency of price discounts (falling by 2 percentage points from 23.2% in January to 21.2% in February).
CPI: Recreation
The rate of price growth of recreational products, including TVs, headphones, and speaker systems, experienced deceleration this month, decreasing to +0.54% on a month-over-month basis in February, down sharply from a revised +2.55% in January (falling by more than 2 percentage points in one month’s time).
A decrease in both the frequency of discounts – down slightly to 29.6% in February from 29.8% in January – and the average magnitude of discounts – down to 24.0% from 24.5% over the same time period – would normally lead to expectations of price increases due to the decrease in discount activity. Because this expectation did not happen this month for recreation products, it is most likely that shelf prices for recreation products went down, leading to the decrease in the rate of growth for this product group.
It should also be noted that prices for recreation products tend to fall by about 2 percentage points every February. Given this trend in prices every February, which is illustrated below, the decrease in price growth in spite of a lack of discount activity makes sense.
Macroeconomic Outlook Update
As of March 2026, the U.S. economy continues to move toward a more stable inflation environment, particularly for durable and personal goods. After several years of elevated price growth, categories such as appliances, furniture, electronics, clothing, and household supplies have seen noticeably slower increases. Improved supply chains, healthier inventories, and the fading effects of earlier tariff-related cost pressures have helped restore pricing discipline across much of the consumer goods sector. For households, this has translated into more predictable pricing and fewer sharp increases at checkout.
However, the recent escalation of military conflict involving Iran has introduced a new source of inflation risk through energy markets. Oil prices have risen in response to concerns about potential supply disruptions in the Middle East, particularly around key shipping routes. Higher crude prices have already pushed gasoline prices upward, and sustained increases could ripple through transportation and logistics costs across the economy.
For durable and personal goods, the impact of higher energy prices would likely be indirect but meaningful. Elevated fuel and shipping costs can raise production and distribution expenses, potentially slowing or temporarily reversing the moderation in goods inflation. At the same time, higher gasoline prices reduce disposable income, which could dampen demand for discretionary items such as home furnishings and electronics—limiting retailers’ ability to pass along higher costs.
If energy price increases remain contained and the conflict does not significantly disrupt global supply, the broader trend of moderating goods inflation is likely to continue through 2026. But a prolonged or escalating conflict that drives oil substantially higher would pose a renewed upside risk to overall inflation.
In short, March 2026 reflects a U.S. economy where durable and personal goods prices are stabilizing, yet energy-driven uncertainty tied to geopolitical tensions has reintroduced volatility into the inflation outlook.
Note: This summary is based on data available as of early March 2026 and may be subject to revisions in future releases.
For questions about the report, please contact Ralph McLaughlin at ralph@openbrand.com
For press inquiries, please contact press@openbrand.com
About the OpenBrand CPI
This report offers insights into price trends across major consumer product categories representing a select mix of both durable and personal goods (see methodology below for more details). The data used in this report leverages OpenBrand’s industry-leading library of durable and personal goods pricing, promotion, and availability for over 1.4 million individual products. This is more than ten times the coverage by the monthly Bureau of Labor Statistics (BLS) Consumer Price Index, allowing more timely and granular reporting of price changes in the market.
This free monthly report provides a broad summary of price changes (including promotional activity), category-specific pricing and promotional trends, and macroeconomic context. For those seeking deeper insights, weekly CPI reporting and monthly CPI forecasts (released next week) are available on a subscription basis with up to same-day SKU-level pricing data available in bulk downloadable files.
Subscribe
Get CPI & Real-Time Pricing Data Updates
The OpenBrand CPI-DPG is released monthly. Join our subscription list to be notified when new CPI data is available.
OpenBrand Methodological Notes
Special Note on Methodology Update — OpenBrand Consumer Price Index
Beginning with the February 2026 release, personal care products will no longer be included in the OpenBrand Consumer Price Index (CPI). February will represent the final month in which personal care categories are incorporated into the headline index.
This methodological update reflects a strategic refinement of the OpenBrand CPI’s core objective: to measure price and discount trends exclusively within the consumer durable goods sector. While personal care products provided valuable insight into broader retail pricing dynamics, their pricing behavior and promotional cycles differ meaningfully from those of durable goods. Removing these categories will enhance the precision and interpretability of the index as a focused measure of durable goods inflation and discounting activity.
To preserve historical continuity and analytical comparability, all future releases of the OpenBrand CPI and the OpenBrand CPI NowCast will include back-calculated index values with personal care products removed. This revised historical series will allow users to evaluate long-term trends on a consistent methodological basis and ensure that month-over-month and year-over-year comparisons remain accurate.
This refinement strengthens the OpenBrand CPI’s role as a high-frequency, data-driven indicator of pricing power, discount intensity, and inflation trends across consumer durable goods. We believe this update will improve clarity for policymakers, industry stakeholders, investors, and media users who rely on the index for timely insight into the durable goods marketplace.
Further details regarding the updated methodology and revised historical series will be made available in the technical documentation of future releases.
Methodological Notes
The OpenBrand CPI of Durable and Personal Goods is constructed using a data-driven methodology that ensures accuracy, timeliness, and transparency in measuring price trends for both short and long-lasting consumer products. The methodology consists of the following key components:
- Data Collection
- Real-Time Price Tracking: Prices are sourced daily from online marketplaces, retail websites, and brick-and-mortar store listings.
- Retailer & Manufacturer Data: Aggregates pricing information from major retailers, direct-to-consumer brands, and wholesale suppliers into broader consumer categories.
- Temporal Coverage: Captures price variations over time, including daily discounts and price promotions
- Product Selection & Tracking
- Durable and Personal Goods Focus: The index includes products with an expected lifespan of three years or more, such as home appliances, consumer electronics, and tools, as well as personal care products with a shorter lifespan, such as hair and skin care products, vitamins, over-the-counter medications, and oral care products.
- Brand & Model Tracking: Individual brands and models are monitored to reflect pricing shifts within competitive product segments, including both permanent changes in listing price as well as temporary promotional pricing.
- Price Calculation, Adjustments, and Weighting
- Price Calculation: Tracks month-over-month and year-over-year price movements to measure price stability in the marketplace and take into account both longer-term changes in pricing (such as changes in manufacturer’s suggested retail price) as well as more short-term changes in pricing, such as promotional discounts and sales prices.
- SKU-Removal Instead of Hedonic Adjustments: When a product (or SKU) becomes unavailable in the BLS goods basket, the BLS implements a SKU-replacement procedure whereby the next most similar product is used in its place, and a quality (hedonic) adjustment procedure is performed to get closer to an apples-to-apples price comparison. Since OpenBrand has data on nearly 100% of the SKUs pricing history in a given product category, we can simply remove that SKU from the basket and rely on price changes of the remaining SKUs in that basket. This eliminates the need for hedonic adjustment in the OpenBrand CPI basket.
- Weighting and Aggregation Method: A weighted geometric mean formula is used to minimize volatility and improve stability in price trend analysis at both the product grouping and category level. Instead of using sales-volume weights when aggregating the index, we take an alternative approach by using persistence-based weights for aggregation. Instead of more frequently purchased items getting more weight in the BLS’ CPI calculation, OpenBrand takes a more novel approach by weighting items with a more established price history in the market more heavily in our CPI calculation than items with a less established history.
- Reporting & Updates
- High-Frequency Updates: Published freely on a monthly basis, with a subscription option for daily summaries across categories, sub-categories, and individual products.
- Comparative Benchmarks: We aggregate pricing as analogously as possible to traditional BLS CPI measures for benchmarking purposes.
- Transparency & Accessibility: Provides both open and paid data access for journalists, researchers, businesses, and policymakers.
By leveraging real-time data and advanced statistical techniques, the OpenBrand CPI offers an accurate and dynamic measure of pricing trends, helping businesses and consumers make informed decisions in an evolving economic landscape.
OpenBrand CPI - Durable and Personal Goods
Groups and Products
Appliance Group
Air Conditioners
Air Purifiers
Beverage Coolers
Blenders
Coffee Makers
Cooktops & Wall Ovens
Countertop Cooking
Countertop Microwaves
Dehumidifiers
Dishwashers
Dryers
Freezers
Icemakers
Laundry
Ranges
Refrigerators
Vacuums
Washers
OTR (Over-the Range Microwaves)
Communications Group
Business Printers
Desktops
Headsets
HED
Ink
Large Printers
MFP Copiers
Monitors
Notebooks
Personal & SOHO Printers
Projectors
Smartphones
Tablets & Detachables
Toner
Wearables
Wireless Routers
Recreation Group
Bluetooth Speakers
Bluray
Digital Camcorders
Digital Cameras
Headphones
Media Players
Photo Paper
Sewing Machines
Sound Bars
Speaker Systems
TVs
VAW Speakers
Home Improvement Group
Bathroom Faucets
Bathroom Sinks
Bathroom Vanity
Bathtubs
Cutting Machines
Carpets
Door Locks
Exterior Paints
Exterior Stains
Floor Tiles
Garden Hoses
Generators
Grass Seed
Handhelds
Hand Tools
Hardwood Flooring
Interior Paints
Interior Stains
Kitchen Cabinets
Kitchen Cleanup
Kitchen Faucets
Lawn Fertilizer
Lawn Products
Log Splitters
Mowers
Outdoor Cooking
Outdoor Cooking Accessories
Paint Supplies
Pesticides
Shower Stall and Enclosures
Power Tools
Power Tools Accessories
Pressure Washer
Replacement Batteries
Shower Doors
Shower Heads
Smart Doorbells
Smart Locks
Smart Cameras
Smart Thermostats
Snow Throwers
Spray Paint
Toilets
Vinyl Flooring
Water Filtration
Weed Killer
Personal Care Group
Anti-Smoking Products
Adult Incontinence
Baby Products
Bath Products
Contraceptives
Cosmetics (Eye, Facial, Nail)
Deodorants
Diabetic Products
Digestive (Lower GI, Upper GI, Hemorrhoidal)
Ear Care Products
Eye Care Products
Feminine Needs (Sanitary Napkins/Tampons & Women’s Care)
First Aid Accessories & Treatments
Foot Care Products
Fragrance
Hair Care (Coloring, Growth, Shampoo, Conditioner, Styling)
Hair Dryers
Home Health Care
Lip Preparations
Oral Care (Breath Fresheners, Accessories, Dentures, Mouthwash, Oral Hygiene, Toothpaste)
Pain (Analgesic, External & Internal)
Sexual Wellness
Shave (Non-Razor Blades, Creams, Razors)
Skin Care (Acne, Facial, Hand & Body)
Sleeping Remedies
Soap
Sun Care
Upper Respiratory (Cold/Allergy/Sinus Liquids & Tablets, Cough Drops/Lozenges, External, Nasal Products)
Vitamins, Minerals & Supplements
Wt Ctl/Nutrition (Tablets & Liquid, Powder Wipes, Towelettes)
PREPARED BY
Contact Us
For questions about the report, contact Ralph McLaughlin at ralph@openbrand.com
For press inquiries, contact press@openbrand.com
For full data access on a subscription basis, click the button below to request a demo of the offering.

How Disruption in BLS Data Collection May Impact Accurate Price Change Measurement
Appliance CPI Volatility: Signal or Measurement Noise?
Recent data reveal a striking divergence between appliance price trends measured by the OpenBrand CPI and the BLS CPI, raising important questions about data quality, sampling, and methodological challenges.
This deviation emerged immediately following the government shutdown, a period that likely disrupted standard data collection and processing workflows. In particular, the Bureau of Labor Statistics may have faced challenges related to reduced sample sizes for appliance pricing and limitations in applying hedonic adjustments when key product observations were missing. Both factors can materially affect month-to-month price estimates, especially in categories like appliances where product turnover and model replacement are high.
A Problem with BLS Data Collection?
The resulting price movements in the BLS CPI were unusually large. Appliance prices fell 5.1% month-over-month in December, followed by a 4.4% increase in January, both on a non-seasonally adjusted basis. These back-to-back swings are exceptionally large by historical standards and are what one might expect annually, rather than in a given month. The movements contrast sharply with the more stable and continuous pricing trends observed in the OpenBrand CPI, which is built on high-frequency, broad-based market pricing data.
OpenBrand’s depth and breadth of data across the consumer durables industry provides a highly accurate, real-time view of pricing and promotional activity. The OpenBrand CPI leverages millions of continuously observed price points across retailers, brands, and SKUs, allowing us to capture true market dynamics without reliance on small samples or statistical inference. As a result, the OpenBrand CPI is immune to disruptions caused by government shutdowns and does not depend on hedonic adjustments to estimate missing products. This ensures a cleaner, timelier, and more reliable signal of underlying price trends.
Taken together, the magnitude and timing of the BLS swings strongly suggest that temporary measurement disruptions, rather than fundamental market forces, drove recent volatility in appliance price measurement in the BLS CPI. If so, future releases may show partial normalization as standard sampling and processing resume.
We will be paying close attention to this deviation over the coming months, waiting to see if official appliance price measures stabilize and converge back toward broader market-based pricing signals. Understanding whether this episode reflects short-term noise or deeper structural challenges will be critical for accurately interpreting inflation trends in appliance pricing for the remainder of 2026H1.
About the Author

Consumer Price Index: Durable and Personal Goods | January 2026
This is the February 2026 release of the OpenBrand Consumer Price Index (CPI) – Durable and Personal Goods report that covers price movements in January 2026.
DISCLAIMER: This report is provided ‘as is’ for informational purposes only. OpenBrand makes no representations or warranties regarding the accuracy, completeness, or reliability of the data. Users assume all risks associated with their use of this report. OpenBrand shall not be liable for any losses or damages arising from the use of this report.
Inflation Ticks up in January, but Less than Years’ Past
In January, price growth for consumer durables and personal goods accelerated after a slight pickup in December, with a month-over-month (MoM) increase of +0.75%. This is up from a revised monthly +0.43% increase in the month prior. However, it’s important to note that the acceleration was largely driven by a sharp increase in the recreation product group, growing at a rate of +2.44% month-over-month, up from +0.35% in December. Personal care products also added to the acceleration, growing to +0.65% in January from +0.18% in December. The other three product groups – appliances, communications, and home improvement – all showed price growth deceleration on a month-to-month basis, with communications posting the sole negative read month-over-month.
While month-over-month price growth in January was the largest gain in 12 months, it’s not unusual for the first month of the year to bring relatively sharp price increases. A new year is a new opportunity for manufacturers and retailers to adjust pricing, both in response to their holiday season promotions as well in response to broader market forces. If we compare price growth in January 2026 to price growth in January over the past decade, it ranks as fourth lowest (and second of the past five) and well below the +0.96% MoM average. Thus, much of the increase this January is likely due to normal seasonal upticks at the beginning of the year, rather than acceleration of inflationary forces.
Table of Contents
- Key CPI Takeaways for January 2026 & Macroeconomic Outlook
- Product Group Highlights
- CPI 2025 Forecast: Macroeconomic Summary
- Methodology
January 2026 OpenBrand CPI-DPG Summary and Macroeconomic Outlook
Overall OpenBrand Consumer Price Index Movement: The OpenBrand CPI of Durable and Personal Goods recorded a +0.75% monthly change in January, notching the fourteenth consecutive month-over-month increase and 19th of the last 20th months. The sharp price growth this month is building on gains from last month, possibly supported most by the large increase in the prices seen in the recreation group.
Discount Trends: January brought mixed changes in discount activity to the durables and personal goods sector, with frequencies climbing month-over-month to 23.1% of all durable and personal goods from 22.5% in the month prior. The typical magnitude decreased slightly to 20.0%, down from 20.8% the month prior.
Product Group Price Trends: All product groups except communications and home improvement experienced an uptick in the rate of growth from the month prior, with prices of all groups except Communication climbing month-over-month. The group summary is as follows:
- Appliance Group (+0.24%)
- Communication Group (-0.29%)
- Home Improvement Group (+0.69%)
- Personal Care Group (+0.65%)
- Recreation Group (+2.44%)
See the full breakdown of product groupings.
Product Group Highlights
CPI: Appliances
Prices for appliances increased on a month-over-month basis in January to +0.24%, rising from a revised -0.59% in the month prior. The positive price growth was at least partially driven by the typical discount magnitude decreasing to 17.8% from 18.4%, while the frequency of discounts increased to 36.9% from 35.3% the month prior.
CPI: Communication
Prices of communication devices, including phones, tablets, computers, and printers, fell on a month-over-month basis to -0.29%, down sharply from a revised +1.31% the month prior. The frequency and magnitude of discounts were mixed in January. Frequency increased from 14.2% to 15.6%, while magnitude fell about 2 percentage points from 19.8% to 17.6% from December to January. The decrease in prices of communication devices most likely was led by the decent decrease in magnitude of discounts.
CPI: Home Improvement
Prices for home improvement goods decreased by +0.69% on a month-over-month basis in January, falling from a revised +0.88% in the month prior, showing 34 consecutive month-over-month flat or monthly increases. The deceleration in price growth was at least partially driven by a decrease in the magnitude of discounts (17.4% from 18.7% the month prior), while the typical discount frequency remained flat at 9.8%.
CPI: Personal Care
Prices of personal care products grew sharply on a monthly basis in January by +0.65%. Some of this increase may be due to a decrease in the magnitude (falling from 22.7% in December to 22.3% in January) & an increase in the frequency of price discounts (rising from 22.9% in December to 23.6% in January).
CPI: Recreation
The rate of price growth of recreational products, including TVs, headphones, and speaker systems, increased to +2.44% on a month-over-month basis in January, up sharply from a revised +0.35% in December (growing by more than 2 percentage points in one month’s time). Some of this large increase in the pace of price growth is at least partially due to a decrease in the frequency of discounts – down to 29.7% in January from 30.3% in December – but the average magnitude of discounts remaining relatively flat – up only slightly to 24.6% from 24.5% over the same time period.
Macroeconomic Outlook Update
As of February 2026, the inflation picture for U.S. consumers has continued to improve, particularly when it comes to the everyday goods and big-ticket items that strained household budgets earlier in the decade. While prices remain higher than they were before the pandemic, the pace of price growth has slowed noticeably, and in several durable and personal goods categories, prices are now flat or edging modestly lower. For many households, this marks a tangible shift from inflation anxiety to cautious relief.
The most visible progress has been in durable goods. Prices for appliances, consumer electronics, and other household durables have stabilized after years of volatility. Retailers entered the year with healthier inventory levels and face a more price-sensitive consumer, prompting more frequent discounts and promotions. With demand no longer overheating and supply chains functioning more smoothly, sellers have less pricing power than they did just a few years ago. As a result, consumers shopping for replacement or discretionary items are increasingly finding that prices are no longer rising—and in some cases are slipping modestly.
Personal goods are following a similar trajectory, and are seeing slower price increases than in prior years. Many brands are working to hold prices steady to protect market share. The competitive nature of these categories, combined with easing input and transportation costs, has reduced the need for frequent price hikes. For consumers, this translates into more predictable spending and fewer unwelcome surprises at checkout.
A key driver behind this moderation is the continued fading of tariff-related cost pressures. The inflationary effects of Trump-era tariffs, which briefly raised prices across a wide range of imported consumer goods earlier last year, are now largely behind us. Companies have had time to adjust sourcing strategies, renegotiate supplier contracts, and absorb or offset costs that once flowed directly into retail prices. By early 2026, those tariff effects are no longer a major force pushing consumer goods prices higher.
The broader economic environment reinforces this trend. Economic growth remains steady but subdued, limiting demand-driven inflation. The labor market has cooled further, easing wage pressures that often spill over into goods prices. While employment remains stable, slower wage growth is helping keep overall cost pressures in check without undermining consumer purchasing power.
Interest rates also continue to shape the consumer landscape. Financial conditions remain restrictive enough to discourage excessive borrowing, particularly for large purchases, but expectations of gradual rate relief later in the year have improved consumer sentiment. This balance has encouraged cautious spending rather than the kind of demand surge that would reignite goods inflation.
For consumers in February 2026, the practical takeaway is that the inflation environment feels calmer and more manageable. Prices for durable and personal goods are no longer racing ahead, and in some categories are beginning to drift slightly lower. While this does not mean a return to pre-pandemic price levels, it does suggest that the era of sharp, goods-driven inflation has ended.
In short, early 2026 is shaping up as a period of stabilization for consumer goods prices. As tariff effects fade fully and competitive pressures intensify, households are benefiting from slower price growth, better availability, and a renewed sense of control over everyday spending decisions—a meaningful improvement after several challenging years.
Note: This summary is based on data available as of early February 2025 and may be subject to revisions in future releases.
For questions about the report, please contact Ralph McLaughlin at ralph@openbrand.com
For press inquiries, please contact press@openbrand.com
About the OpenBrand CPI
This report offers insights into price trends across major consumer product categories representing a select mix of both durable and personal goods (see methodology below for more details). The data used in this report leverages OpenBrand’s industry-leading library of durable and personal goods pricing, promotion, and availability for over 1.4 million individual products. This is more than ten times the coverage by the monthly Bureau of Labor Statistics (BLS) Consumer Price Index, allowing more timely and granular reporting of price changes in the market.
This free monthly report provides a broad summary of price changes (including promotional activity), category-specific pricing and promotional trends, and macroeconomic context. For those seeking deeper insights, weekly CPI reporting and monthly CPI forecasts (released next week) are available on a subscription basis with up to same-day SKU-level pricing data available in bulk downloadable files.
Subscribe
Get CPI & Real-Time Pricing Data Updates
The OpenBrand CPI-DPG is released monthly. Join our subscription list to be notified when new CPI data is available.
OpenBrand Methodological Notes
The OpenBrand CPI of Durable and Personal Goods is constructed using a data-driven methodology that ensures accuracy, timeliness, and transparency in measuring price trends for both short and long-lasting consumer products. The methodology consists of the following key components:
- Data Collection
- Real-Time Price Tracking: Prices are sourced daily from online marketplaces, retail websites, and brick-and-mortar store listings.
- Retailer & Manufacturer Data: Aggregates pricing information from major retailers, direct-to-consumer brands, and wholesale suppliers into broader consumer categories.
- Temporal Coverage: Captures price variations over time, including daily discounts and price promotions
- Product Selection & Tracking
- Durable and Personal Goods Focus: The index includes products with an expected lifespan of three years or more, such as home appliances, consumer electronics, and tools, as well as personal care products with a shorter lifespan, such as hair and skin care products, vitamins, over-the-counter medications, and oral care products.
- Brand & Model Tracking: Individual brands and models are monitored to reflect pricing shifts within competitive product segments, including both permanent changes in listing price as well as temporary promotional pricing.
- Price Calculation, Adjustments, and Weighting
- Price Calculation: Tracks month-over-month and year-over-year price movements to measure price stability in the marketplace and take into account both longer-term changes in pricing (such as changes in manufacturer’s suggested retail price) as well as more short-term changes in pricing, such as promotional discounts and sales prices.
- SKU-Removal Instead of Hedonic Adjustments: When a product (or SKU) becomes unavailable in the BLS goods basket, the BLS implements a SKU-replacement procedure whereby the next most similar product is used in its place, and a quality (hedonic) adjustment procedure is performed to get closer to an apples-to-apples price comparison. Since OpenBrand has data on nearly 100% of the SKUs pricing history in a given product category, we can simply remove that SKU from the basket and rely on price changes of the remaining SKUs in that basket. This eliminates the need for hedonic adjustment in the OpenBrand CPI basket.
- Weighting and Aggregation Method: A weighted geometric mean formula is used to minimize volatility and improve stability in price trend analysis at both the product grouping and category level. Instead of using sales-volume weights when aggregating the index, we take an alternative approach by using persistence-based weights for aggregation. Instead of more frequently purchased items getting more weight in the BLS’ CPI calculation, OpenBrand takes a more novel approach by weighting items with a more established price history in the market more heavily in our CPI calculation than items with a less established history.
- Reporting & Updates
- High-Frequency Updates: Published freely on a monthly basis, with a subscription option for daily summaries across categories, sub-categories, and individual products.
- Comparative Benchmarks: We aggregate pricing as analogously as possible to traditional BLS CPI measures for benchmarking purposes.
- Transparency & Accessibility: Provides both open and paid data access for journalists, researchers, businesses, and policymakers.
By leveraging real-time data and advanced statistical techniques, the OpenBrand CPI offers an accurate and dynamic measure of pricing trends, helping businesses and consumers make informed decisions in an evolving economic landscape.
OpenBrand CPI - Durable and Personal Goods
Groups and Products
Appliance Group
Air Conditioners
Air Purifiers
Beverage Coolers
Blenders
Coffee Makers
Cooktops & Wall Ovens
Countertop Cooking
Countertop Microwaves
Dehumidifiers
Dishwashers
Dryers
Freezers
Icemakers
Laundry
Ranges
Refrigerators
Vacuums
Washers
OTR (Over-the Range Microwaves)
Communications Group
Business Printers
Desktops
Headsets
HED
Ink
Large Printers
MFP Copiers
Monitors
Notebooks
Personal & SOHO Printers
Projectors
Smartphones
Tablets & Detachables
Toner
Wearables
Wireless Routers
Recreation Group
Bluetooth Speakers
Bluray
Digital Camcorders
Digital Cameras
Headphones
Media Players
Photo Paper
Sewing Machines
Sound Bars
Speaker Systems
TVs
VAW Speakers
Home Improvement Group
Bathroom Faucets
Bathroom Sinks
Bathroom Vanity
Bathtubs
Cutting Machines
Carpets
Door Locks
Exterior Paints
Exterior Stains
Floor Tiles
Garden Hoses
Generators
Grass Seed
Handhelds
Hand Tools
Hardwood Flooring
Interior Paints
Interior Stains
Kitchen Cabinets
Kitchen Cleanup
Kitchen Faucets
Lawn Fertilizer
Lawn Products
Log Splitters
Mowers
Outdoor Cooking
Outdoor Cooking Accessories
Paint Supplies
Pesticides
Shower Stall and Enclosures
Power Tools
Power Tools Accessories
Pressure Washer
Replacement Batteries
Shower Doors
Shower Heads
Smart Doorbells
Smart Locks
Smart Cameras
Smart Thermostats
Snow Throwers
Spray Paint
Toilets
Vinyl Flooring
Water Filtration
Weed Killer
Personal Care Group
Anti-Smoking Products
Adult Incontinence
Baby Products
Bath Products
Contraceptives
Cosmetics (Eye, Facial, Nail)
Deodorants
Diabetic Products
Digestive (Lower GI, Upper GI, Hemorrhoidal)
Ear Care Products
Eye Care Products
Feminine Needs (Sanitary Napkins/Tampons & Women’s Care)
First Aid Accessories & Treatments
Foot Care Products
Fragrance
Hair Care (Coloring, Growth, Shampoo, Conditioner, Styling)
Hair Dryers
Home Health Care
Lip Preparations
Oral Care (Breath Fresheners, Accessories, Dentures, Mouthwash, Oral Hygiene, Toothpaste)
Pain (Analgesic, External & Internal)
Sexual Wellness
Shave (Non-Razor Blades, Creams, Razors)
Skin Care (Acne, Facial, Hand & Body)
Sleeping Remedies
Soap
Sun Care
Upper Respiratory (Cold/Allergy/Sinus Liquids & Tablets, Cough Drops/Lozenges, External, Nasal Products)
Vitamins, Minerals & Supplements
Wt Ctl/Nutrition (Tablets & Liquid, Powder Wipes, Towelettes)
PREPARED BY
Contact Us
For questions about the report, contact Ralph McLaughlin at ralph@openbrand.com
For press inquiries, contact press@openbrand.com
For full data access on a subscription basis, click the button below to request a demo of the offering.