


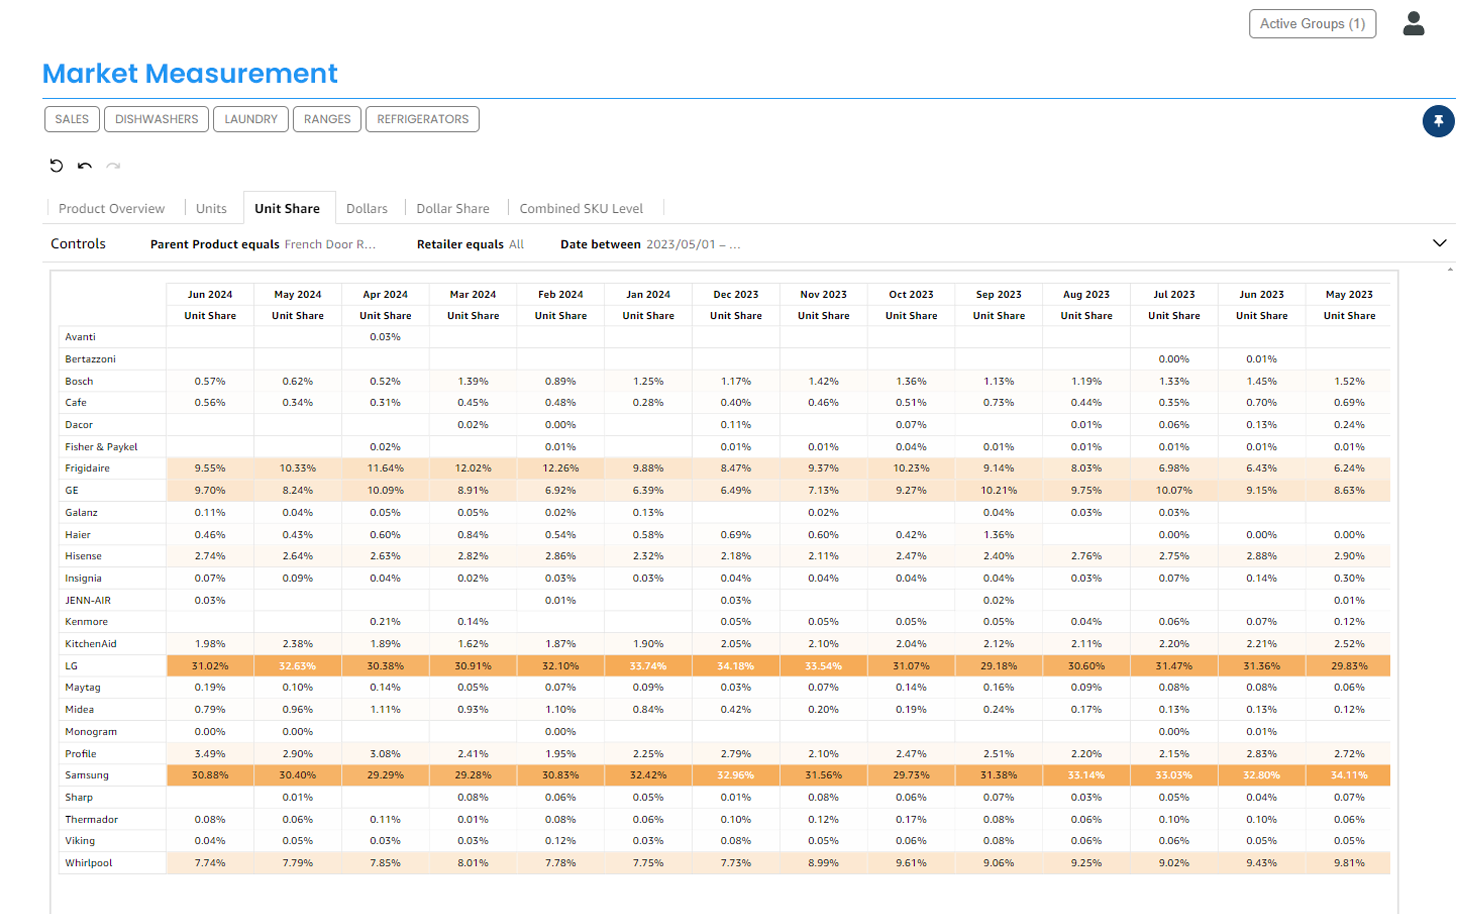
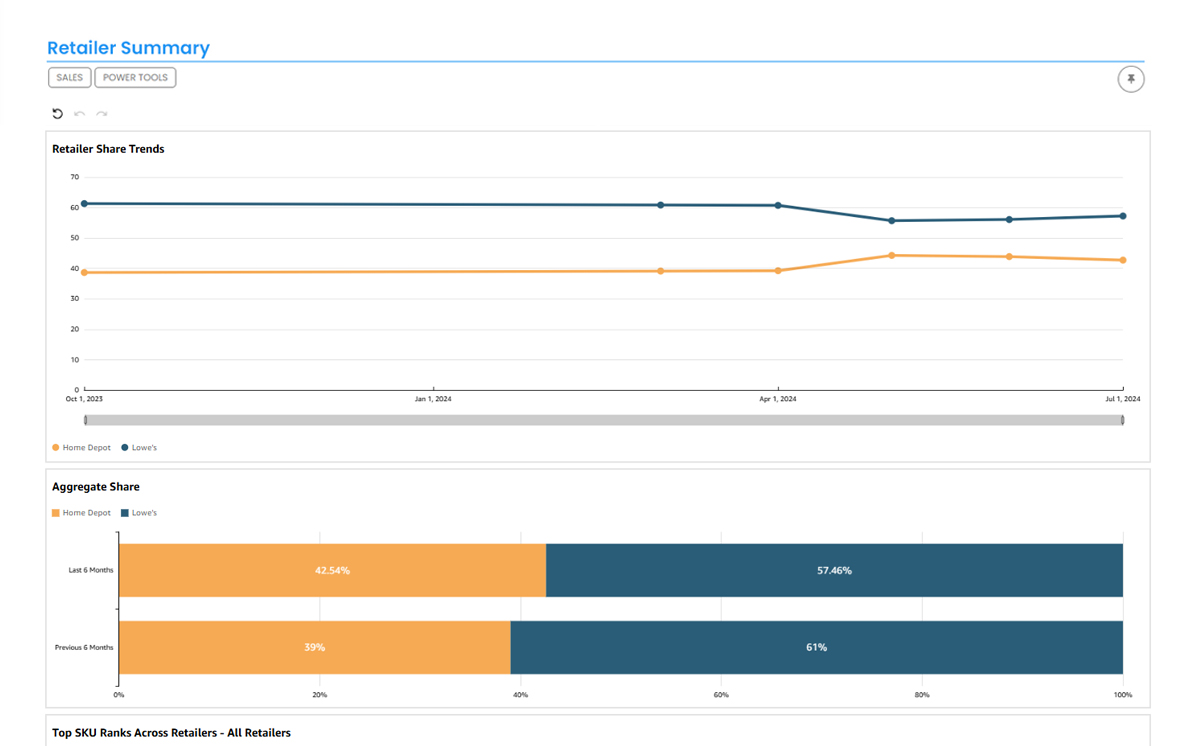
Brand & Retailer Share Winners

Trends Over Time (20 Years’ History)

Customer
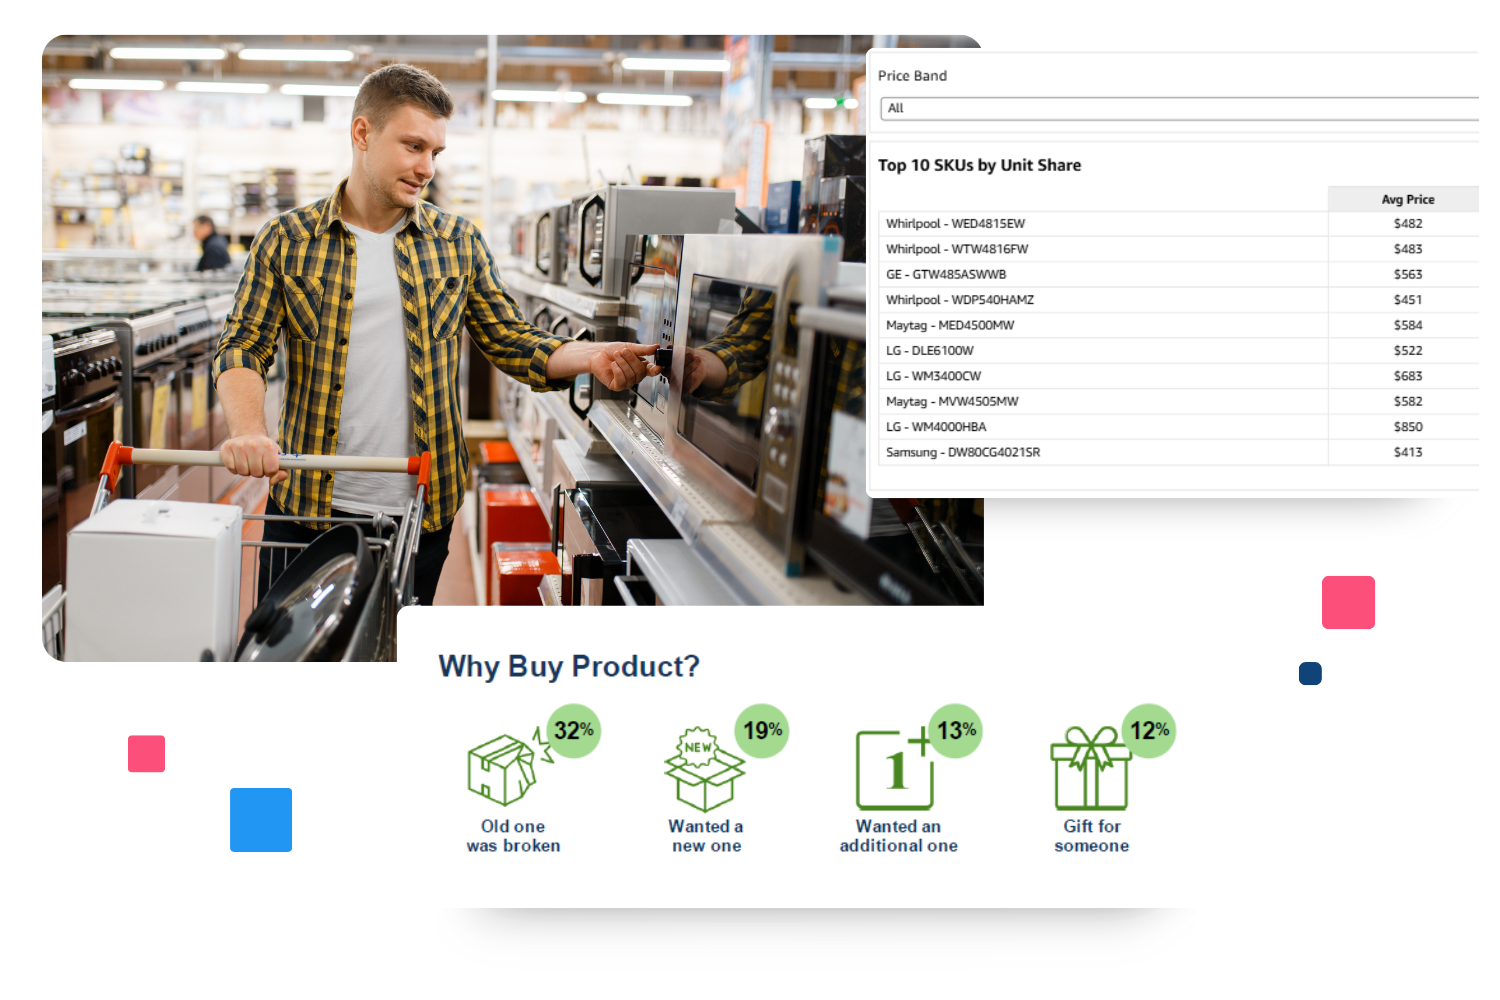
Purchase Drivers

Draw, Close & Leakage Data

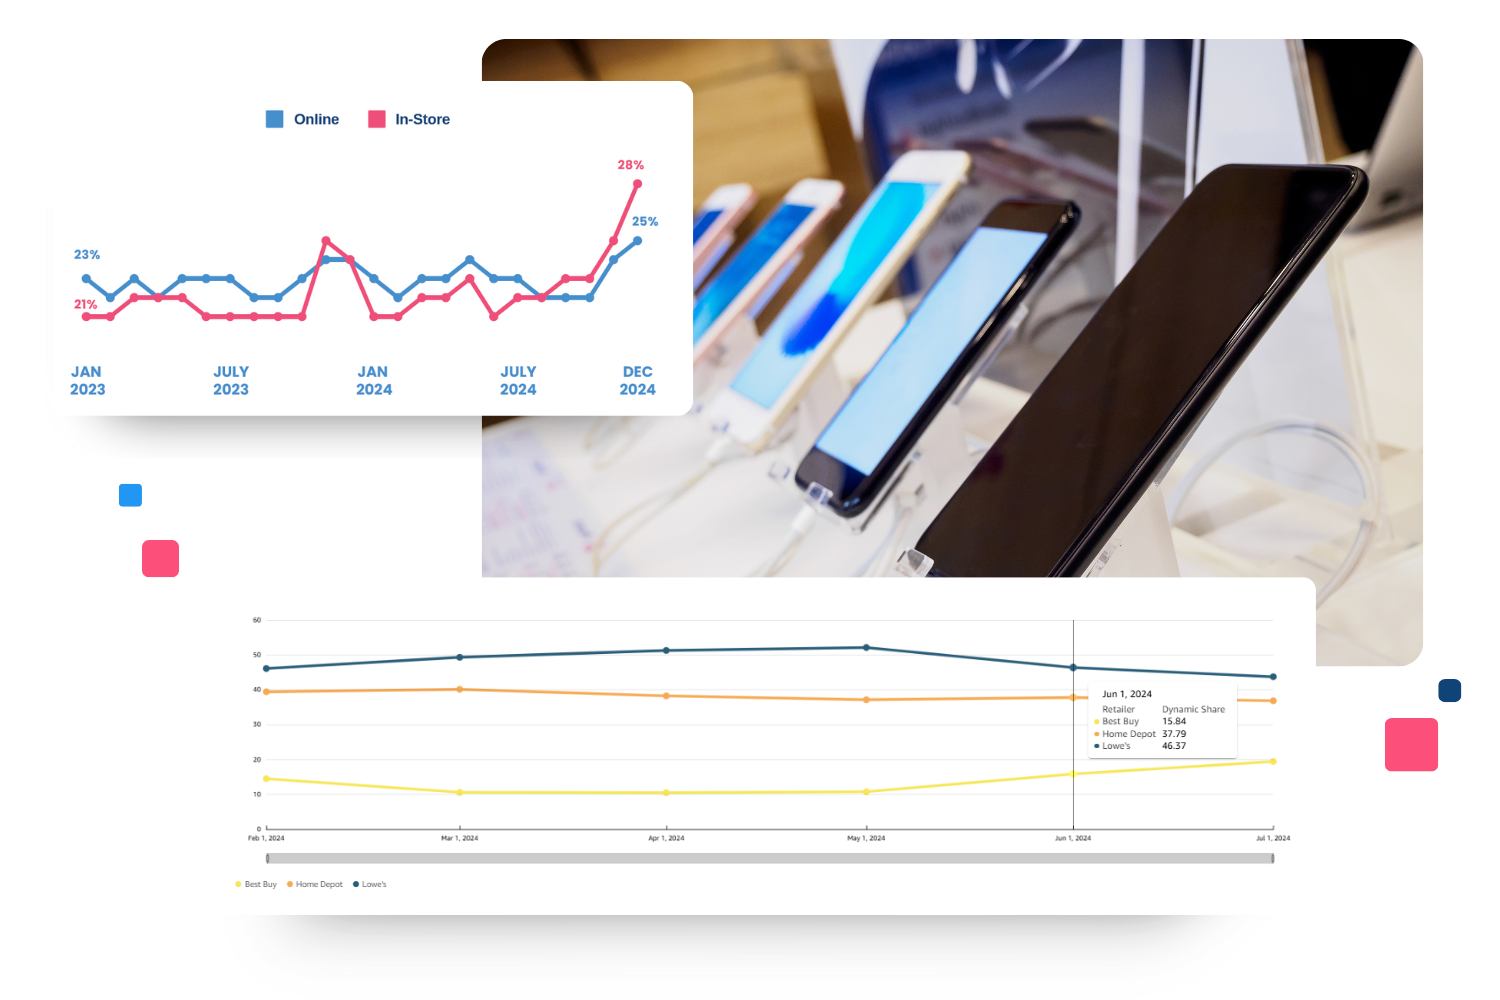
Online vs.
In-Store Behavior

Pricing
Intelligence
Bringing market share and consumer insights together
to deliver a complete market solution for durables
The power of OpenBrand’s Market Measurement solution comes from the combination of our market share and consumer insights data together — delivering a complete market picture when used together, so no questions go unanswered.
By combining MarketShare, the most accurate market share data available, with MindShare, in-depth consumer behavior insights you can’t get anywhere else, we enable brands and retailers to understand who is winning share, why consumers are buying, and how to get ahead.
MarketShare + MindShare = Total Durables Market Understanding
MarketShare
Win Share With The Most Accurate Market Share in Durables
Measuring market share accurately and dependably requires a mosaic of information. Here’s how OpenBrand’s market share data stands out:
- Historically, providers have depended too heavily on one specific type of data (e.g. receipts, surveys, web collected data).
- OpenBrand calculates market share using a dynamic model with multiple inputs, including transaction data, optically collected and processed web data, clickstream records, in-store data, and survey insights and more.
- As a result, our model eliminates limitations in traditional receipt-only market share tools and scaling to account for disparate durables market incidence rates.
MarketShare delivers a holistic and reliable view of market share that understands and integrates the nuances of your market, across key retailers, brands, and models.

MindShare
Consumer Insights You Can’t Get From Transaction Data
Consumer purchase decisioning has never been so abundant. Whether it’s the allure of a particular brand, the perceived value of a feature, the appeal of a competitor, or price sensitivity, we get to the “why” behind the actions of durables shoppers. Here’s how MindShare helps decode consumer behavior:
- Our data is derived from the longest-running large-scale consumer tracking survey for durables — the authority in consumer durables market trends for over 20 years and now being collected daily.
- We take these real consumer inputs and turn them into shopper insights, helping determine buyer profiles, competitive draws, consumer consideration sets, purchase motivations, and so much more.
MindShare delivers consumer-driven insights and market perception that simply cannot be gleaned from transaction data.

What We Deliver
How Brands & Retailers Win Share With OpenBrand
Know who leads the market and why
Market Share Rankings
- Track who is winning the market with dollar and unit share leaderboards
- Know why consumers are shopping the top brands and outlets with “why behind they buy” survey insights
- Uncover estimated gross units and dollar share insights


Monitor share & competitive brand preference
Consumer Consideration Sets & Brand-Specific Insights
- Drill down into market share at specific brands and retailers and see what other brands and retailers consumers say they shop before purchase
- Dig into consumer decision criteria
- Understand how competitive brand presence affects the shopping journey
- Get a clear picture of the competitors in the consumer consideration set
Discover models driving share and why
SKU-Level Rankings & Purchase Drivers
- Discover SKU rankings by brand and retailer
- Drill down into share by configuration and product types (e.g. battery-powered leaf blowers)
- See consumer purchase drivers by product
Explore seasonality & market shift trends
Time-Series Performance Metrics
- Analyze period share comparison metrics by retailer, brand, feature, and model
- Identify and prepare for seasonal trends with 20 years of historical trend data
- Stay on top of product trends, market changes, online vs. in-store shopping changes, shifting brand and SKU performance, and more
Understand consumer behavior
Consumer Trends & Demographics
- Stay ahead of shifting consumer preferences and monitor consumer trends while uncovering new demographic variables that matter
- Learn the consumer “why” behind the buy — and easily compare key variables across industry, brand and retailer
- Know who your consumers are with demographic shopper insights

Request a Demo
Market Measurement empowers
brands and retailers to win more
This unmatched market insights tool delivers must-have competitive market analysis and insights across durable goods industries. We’re changing the game on how durables brands and retailers understand their market — bringing new awareness to market share shifts, consumer behavior, and beyond.
Know Why. Win Share.™
Ready to see the competitive market data available for your brand?
"Since partnering with OpenBrand, we have gained valuable insights into top industry trends. We have increased our ability to forecast future trends and focus on targeting our consumers’ needs."
Marketing Production Manager
Chervon North America


Category Coverage Across the Durables Industry
We cover more than 270 consumer durables product categories, delivering the greatest depth and breadth available in durables market intelligence
- Auto Tires & Batteries
- Consumer Electronics
- Fitness Equipment
- Grills & Smokers
- Hand & Lawn Tools
- Home Furniture
- Home Improvement
- Kitchen & Bath
- Major Appliances
- Mattresses
- Outdoor Power Equipment
- Paint & Stain
- Power Tools
- Small Appliances
Frequently Asked Questions
OpenBrand goes beyond traditional POS-based measurement by delivering modeled market share built from six distinct data sources, including in-store data collection, receipt data, web data, web traffic and clickstream data, consumer behavior insights, and economic data. This approach provides a more complete and accurate view of the total market, rather than a partial view limited to specific retailers.
By combining this modeled market share with direct consumer insights, OpenBrand enables brands and retailers to understand not just what is happening in the market, but why it is happening and how to respond.
Market share loss is typically driven by a combination of pricing gaps, product mix issues, competitive pressure, or shifts in consumer preference. The challenge for most brands is not seeing where they are losing demand, or why it is happening.
OpenBrand identifies the root cause by combining modeled market share data with consumer insights, built from six integrated data sources, including pricing data, product attributes, retailer assortment signals, and large-scale consumer purchase behavior. This multi-source approach provides a complete view of the market, not just a partial snapshot from individual retailers.
By connecting these inputs, OpenBrand shows:
- Where you are losing demand across products and retailers
- Which competitors are gaining that demand
- What factors are driving the switch, including price, features, brand perception, and availability
This allows brands to move beyond surface-level share changes and take targeted action to recover lost demand and improve performance.
OpenBrand uses large-scale consumer surveys that track purchase behavior, decision criteria, and consideration sets. This data reveals what factors influenced the purchase, such as price, features, brand perception, and retailer choice.
Draw (or consideration) rate measures how many consumers consider your brand, close rate measures how many ultimately purchase it, and leakage represents the gap between the two. Together, these metrics help brands understand whether their challenge is awareness, conversion, or competitive displacement.
OpenBrand delivers these insights through its MindShare solution, which captures and analyzes large-scale consumer purchase behavior across durable goods categories. MindShare goes beyond basic funnel metrics by tracking the full decision journey. MindShare reveals not just where you are losing shoppers, but what is influencing their decisions at each stage of the funnel.
When combined with OpenBrand’s modeled, multi-source market share data, this provides a complete picture of performance, linking what is happening in the market with why consumers are making those choices and where to take action.

For Retailers
Get insight into sales at the industry’s biggest retailers. Market Measurement monitors the drivers and tracks performance for the top retailers across durables categories by each product, including share trends, SKU rankings, and leaderboards. Know what brands perform best at your stores — and where other retailers are winning. See why consumers choose other retailers over yours.
For Brands
Monitor brand performance while tracking competitors — and know how your brand(s) perform across top retailers. Track brand, manufacturer, and retailer performance by product type, including share trends, SKU rankings, and brand leaderboard. Get the market data you need to improve line reviews, placements, and win more shelf space.
Beyond Market Measurement
Total Market Intelligence From OpenBrand
Layer in OpenBrand’s Competitive Intelligence and Economic Forecasting data and back all your data analysis by our expert analyst support to get the deepest understanding of why you are winning or losing market share.
Competitive Intelligence

Accurately monitor product, pricing, promotions, inventory, and media presence in real-time — to easily identify opportunities to win
Economic Forecasting
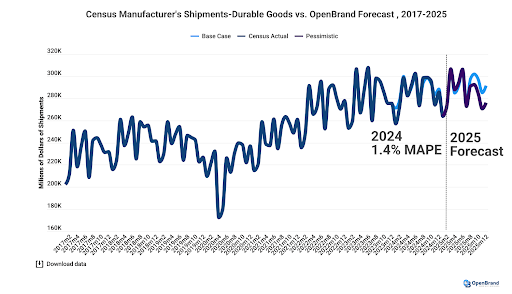
Know where the market is heading with forecasting solutions for retail sales, shipping, and pricing – as well as custom tailored BYO data solutions.
Analyst Support

Leverage custom insights and top-tier data support from our expert category analysts — acting as your eyes and ears in the market
Trusted by global brands, retailers, distributors, and suppliers

EXPLORE OUR DATA
Public Quarterly Market Dashboards
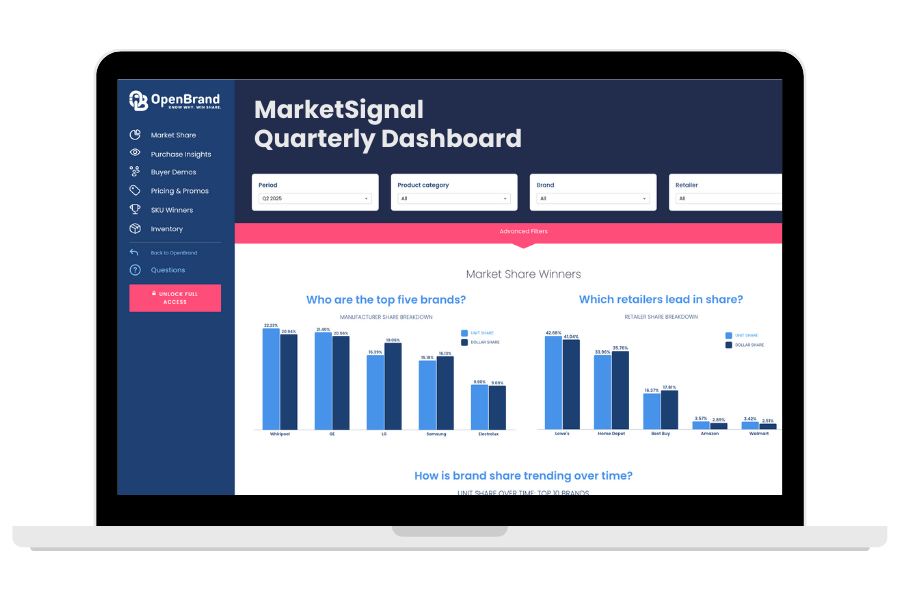
OpenBrand’s data is available to the public through MarketSignal, our quarterly overview dashboards, delivering market share, pricing, promotions, and purchase insights.
Read our latest blogs and insights
US Small Appliance Market Trends: Brand & Retailer Market Share Insights
Latest Update: June 2026 The small appliance market heading into 2026 is defined by three forces…

Consumer Price Index: Durable Goods | June 2026
This is the July 2026 release of the OpenBrand Consumer Price Index (CPI) – Durable Goods…
Prime Day 2026 Shopper Survey: Key Signals for Durables Brands and Retailers
Prime Day 2026 still drove strong shopper participation, but OpenBrand’s latest survey shows a…
What Prime Day 2026 Told Retailers and Brands: A Category-by-Category Read from OpenBrand’s Analysts
Prime Day is no longer a two-day Amazon event that the rest of retail watches from the sidelines.…
Ready to get a pulse on the market?
Get access to OpenBrand’s Market Measurement solution
