
Business Printer Hardware: 2025 Year-In-Review
Our Business Printers: Printer Hardware 2025 Year-in-Review report recaps product launch activity, portfolio shifts, and pricing captured throughout 2025 with comparisons drawn to 2024. The report features data and insights from OpenBrand’s Business Printers and Personal & SOHO Printers categories, which feature products sold through the US ecommerce and brick-and-mortar channels.
Read through all the 2025 insights below or email the report to read later.
You can also check out our 2025 Year-in-Review reports for other Print categories.
Impact Summary
- Launch activity reached its lowest level recorded in 2025
- Pricing increased amid tariff-related pressures
- Average promotions were relatively stable year-over-year
Our Methodology
Data included in this report is sourced from the OpenBrand Business Printers and Personal & SOHO Printers categories. Data in this analysis was captured between Q1 2024 (week of January 7) and Q4 2025 (week of December 14).
Printer Hardware Product Launch Activity in 2025
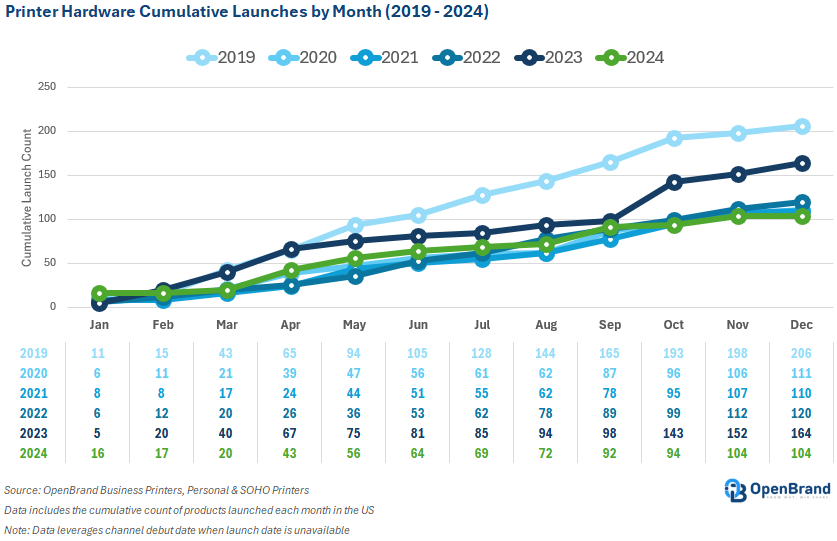
Printer hardware launch activity drastically slowed in 2025. With a total of 76 products introduced for open distribution channels, the year marked the quietest observed in recent memory. There were 27% fewer SKUs launched compared to 2024 when 104 models were released.
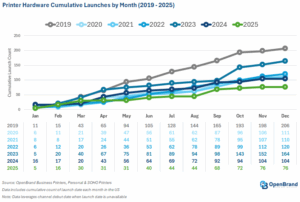
Despite the low number of products launched, brands brought notable products to market throughout the year. Brother officially entered the ink tank market, Canon updated its inkjet and laser-based lines, Epson refreshed its EcoTank portfolio, and HP introduced new AI-enabled inkjets and updated LaserJet models.
Brother executed one of the broadest portfolio expansions of the year, spanning A4 laser, inkjet, and ink tank categories. Most notably, Brother officially entered the US ink tank market for the first time with its INKvestment Tank series, signaling a global push to compete more directly against established ink tank players. Alongside this debut, Brother continued to expand its subscription-led strategy through “F” suffix SKUs bundling Refresh EZ Print or toner subscriptions, while also maintaining a strong club store presence with value-added derivatives. Collectively, these moves reflect Brother’s emphasis on portfolio breadth and ongoing focus on supplies attachment through services.
Canon implemented a mix of generational refreshes across its inkjet and laser lines. The company launched a new Color imageCLASS A4 SOHO lineup featuring a meaningful step-up in print speeds, while also quietly introducing “II” generation A4 small workteam devices as mid-lifecycle refreshes. Within its inkjet portfolio, Canon refreshed its consumer PIXMA lineup, updated its MegaTank small workteam series under clearer branding, and introduced the PIXMA TR160 mobile printer to address on-the-go business needs. Canon also strengthened its creative and professional offerings with new imagePROGRAF and PIXMA PRO photo printers. Overall, Canon’s 2025 activity reinforced a strategy centered on incremental improvement and portfolio continuity.
Epson reinforced its leadership in the ink tank category through a broad seventh-generation EcoTank refresh and continued channel expansion. New models such as the EcoTank ET-2980, EcoTank ET-3950, and EcoTank ET-4950 updated core configurations while raising Epson’s value proposition to “up to three years of ink in the box,” further widening its differentiation on included supplies.
HP advanced a services- and security-led hardware strategy across consumer, SOHO, and enterprise segments. The company expanded its AI positioning in inkjet with new Envy and OfficeJet Pro models featuring HP AI capabilities (including Perfectly Formatted Prints), while also quietly refreshing core OfficeJet Pro SKUs. HP increased its retail footprint through multiple merchant-exclusive derivatives and re-entered Sam’s Club in-store assortments, ending Epson’s extended exclusivity and restoring brand diversity in the channel. At the enterprise level, HP introduced the LaserJet Enterprise 8000 A3 series, emphasizing quantum-resistant security aligned with future US federal requirements.
Kyocera continued to methodically strengthen its A4 monochrome lineup with the launch of new ECOSYS MA and ECOSYS PA series models targeting SMB customers. The additions served as direct replacements for prior-generation devices while introducing compatibility with new toner and reinforcing Kyocera’s focus on energy efficiency, security, and compact design. These updates rounded out Kyocera’s ECOSYS A4 portfolio and underscored the OEM’s steady, refresh-driven approach to maintaining competitiveness in the A4 monochrome segment. It should be noted that these devices often sell across channels, with visibility at select resellers and available to Kyocera’s dealer partners.
Prior to Xerox’s acquisition of Lexmark, the OEM formally concluded the phased rollout of its 9-series A3 portfolio. The final models completed the company’s planned Q1 release cadence and reinforced Lexmark’s efforts to grow share in A3 color and monochrome MFP segments with its internally developed platform.
Xerox finalized the long-anticipated launch of the C320/DNI by adding official pricing to its US website, closing a visibility gap that had persisted since the model first appeared at resellers. While modest in scope, the update rounded out Xerox’s A4 color offering.
Printer Hardware: 2025 Pricing Insights
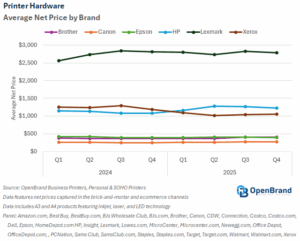
Across the market, average net prices increased modestly year-over-year, with notable divergence by brand and segment. Overall, average net prices rose 4%, increasing from $898 in 2024 to $935 in 2025, reflecting tariff-related price increases and some shifts in product mix.
HP recorded the largest year-over-year increase, with average net prices rising 10% from $1,117 to $1,233. Brother and Canon each posted 4% growth in average net prices, with Brother moving from $373 to $389 and Canon increasing from $259 to $270. Lexmark saw a smaller 2% increase, rising from $2,734 to $2,784, indicating relative pricing stability. In contrast, Epson and Xerox experienced declines, with Epson slipping just 1% from $411 to $407 and Xerox declining 15% from $1,244 to $1,054.
Printer Hardware: 2025 Promotions Insights
Promotional activity remained largely stable year-over-year, with only modest shifts in timing and intensity. The average promotional value held flat at $79 in both 2024 and 2025, despite some quarterly variability, indicating that manufacturers largely maintained headline discount levels rather than escalating incentives. While the average promotional percentage discount off shelf price also remained unchanged at 27%, the mix shifted slightly, with higher discount intensity appearing later in the year.
In 2025, promotions softened in the first half before strengthening in Q4, when average promotion value rose to $86 and the average percent discount reached 29%. Overall, the data suggests that vendors relied on targeted, seasonal promotions rather than broad discounting, using promotions tactically to support peak demand periods while preserving pricing discipline across the year.

Printer Hardware: 2026 Market Outlook
Looking ahead to 2026, the US printer hardware market is expected to adjust following a relatively slow product launch environment in 2025. Activity is likely to pick up as OEMs bring refreshed portfolios to market with an expected emphasis on share gains and competitive differentiation. Ink tank technology is expected to remain a key focus, as manufacturers continue to compete on long-term cost-of-ownership messaging and bundled value rather than upfront price alone.
Pricing dynamics entering 2026 remain mixed. While pricing has been under pressure due to tariffs and elevated costs, the potential easing of tariff-related challenges could reduce some of that pressure over time, although both the timing and magnitude remain uncertain. As a result, OEMs are likely to maintain selective pricing actions, balancing cost recovery with the need to remain competitive, especially in price-sensitive segments. At the same time, manufacturers are expected to continue prioritizing supply chain resilience and disciplined portfolio management to navigate ongoing uncertainty.
Overall, 2026 is shaping up to be a year of re-acceleration rather than disruption, with manufacturers focusing on refreshed lineups, targeted innovation, and controlled pricing and promotional strategies to drive incremental growth in the competitive US printer market.
Get more information
Visit our Print industry page to learn more about the data we deliver for the Ink Supplies market – or reach out to our analyst below to ask questions about this report or get specific insights you need.
About the Analyst

MFP Copiers: 2025 Year-In-Review
Our MFP Copiers: 2025 Year-in-Review report recaps product launch activity, portfolio shifts, and pricing captured throughout 2025 with comparisons drawn to 2024. The report features data and insights from OpenBrand’s Ink Supplies category, which feature products sold through the US ecommerce and brick-and-mortar channels.
Read through all the 2025 insights below or email the report to read later.
You can also check out our 2025 Year-in-Review reports for other Print categories.
Impact Summary
- Launch activity in the US dealer channel slowed in 2025
- Canon, Sharp, and Kyocera were the major drivers of launch activity
- Pricing continued to increase amid tariff-related challenges
Methodology
The data used in this report is leveraged from the OpenBrand US MFP-Copiers Pricing & Promotions Report and the US Dealer Cost Report between the dates of Q1 2024 and Q4 2025. The data includes all products except production models that were captured in dealer price lists or contracts. The launch activity section, however, includes products that were announced but have not been captured in dealer price lists or contracts to-date. This section also features data from 2019 to 2025. This section also includes the launch of production models.
MFP Copier Product Launch Activity
Copier hardware launch activity was steady for most of the year but demonstrated notable upticks toward the latter part of the year with major launches from Canon in September and Sharp in October. With a total of 97 products introduced for the US dealer channel, this year’s launch activity had 20% fewer product launches than last year, tying with 2021 as the slowest year in terms of launch activity.
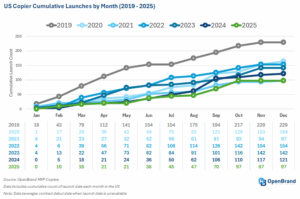
2025 launch activity was primarily driven by three brands. Canon launched more SKUs than any other brand in 2025 due to its large portfolio and branding overhaul. At the Canon Summit held in September, the OEM continued its imageFORCE expansion with the introduction of 30 models. The launch notably unified Canon’s A3 and A4 dealer-focused office print systems under a single brand, retiring the imageRUNNER ADVANCE DX and imageCLASS X families. In addition to bringing branding under one umbrella, the move served to eliminate channel overlap, strengthen dealer alignment, and simplify portfolio positioning across Canon’s global dealer offering.
With a total of 22 products launched in 2025, Sharp gained second place in terms of launch activity. The most significant introductions were made at the brand’s NEXT 2025 dealer event held in October. During that time, Sharp unveiled 18 new models across its Advanced and Essentials Series models spanning 25ppm to 65ppm in both color and monochrome segments. The introduction represented one of Sharp’s most significant product rollouts in recent years and reinforced its commitment to providing secure, connected, and sustainable print solutions.
Kyocera rounded out the top three with 17 product introductions. The OEM’s most significant launch occurred in June with the introduction of its 10-model EvolutionNext series. The A3 MFP series, which is also known as the TASKalfa MZ7001ci series, comprises six color models (25ppm to 70ppm) and four monochrome configurations (40ppm to 70ppm) and followed previous rollouts in Japan and Europe.
MFP Copier Portfolios
The copier market continues to undergo a significant transformation driven by evolving workplace trends, technological advancements, sustainability efforts, and budget constraints. As such, the market continued to show strength in A4 portfolios but A3 made a notable comeback with key launches and portfolio offerings made available to dealers.
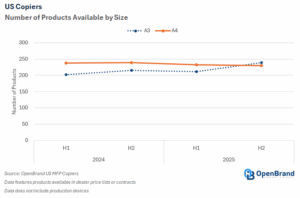
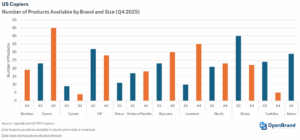
The second half of 2025 brought a notable shift in terms of products available to dealers. Based on products listed in contracts and dealer price lists, the number of A3s offered narrowly surpassed A4s. In 2025, the number of A3s increased by 18% from 202 in 1H 2024 to 239 in 2H 2025 while the number of A4s declined by 4% from 238 to 229.
This shift was driven by portfolio updates, with some vendors continuing to offer new products alongside predecessors. In addition, OpenBrand recently gained access to Katun pricing, driving the overall number of A3 products higher. Looking ahead, however, product counts are expected to normalize once predecessors are phased out of the channel, bringing a return to brands offering more A4s than A3s to their channel partners.
In Q4 2024, brands displayed distinct strategies in balancing their A3 and A4 portfolios. Canon and Lexmark leaned heavily toward A4 devices, with 45 and 35 A4 models, respectively. Brother continued to focus entirely on A4 with 19 models, reinforcing its commitment to the SMB and SOHO segments (as well as its lack of A3 technology or partnerships). Conversely, Toshiba and Xerox prioritized A3 devices, with limited A4 portfolios and 24 and 29 A3 models, respectively. HP maintained a balanced portfolio with 32 A3 and 28 A4 models, while other traditional A3 brands showed similar dual-focus strategies to address diverse market needs.
MFP Copiers: 2025 Pricing Insights
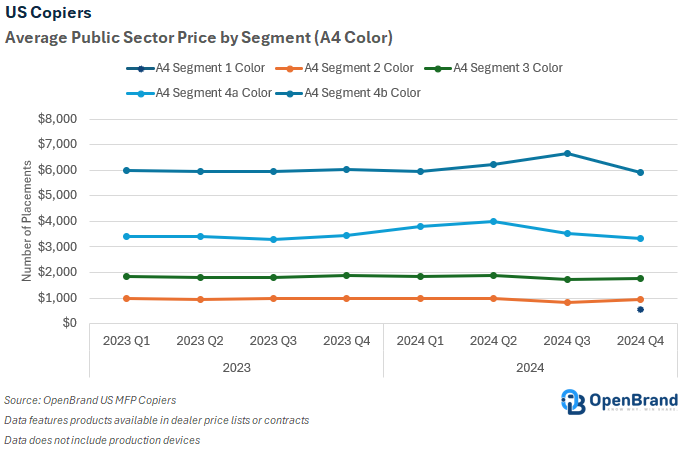
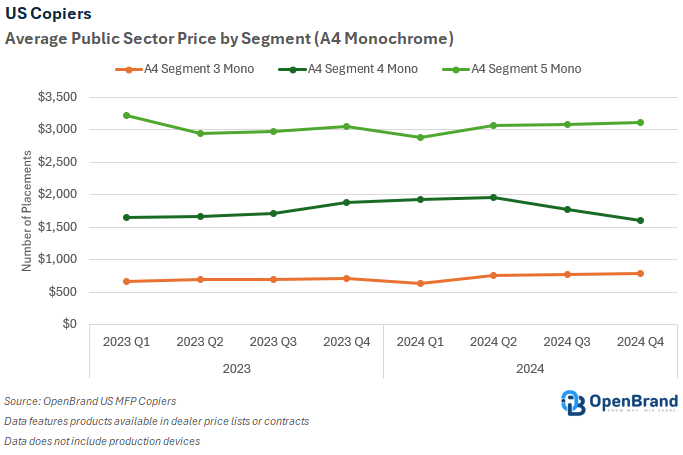
Between Q1 2024 and Q4 2025, public sector pricing trends diverged meaningfully by size and color capability, reflecting the combined impact of tariff-driven increases, shifting demand, and ongoing migration toward A4 devices. A3 segments, particularly color, experienced broad price increases as manufacturers navigated tariff-related pressures, while A3 mono pricing also moved upward at a more uneven pace across tiers. In contrast, A4 color pricing softened across most segments amid competitive pressure and continued substitution, while A4 mono pricing delivered mixed pricing shifts.
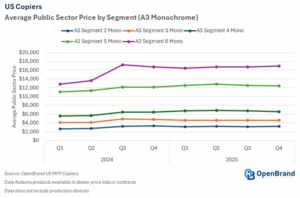
Between Q1 2024 and Q4 2025, average A3 color segment public sector prices increased across all tiers, primarily reflecting tariff-related price increases. Segment 1 Color rose by 21%, increasing from $3,698 to $4,474, while Segment 2 Color climbed 31% to $5,581. Segment 3 Color grew by 32%, rising from $5,710 to $7,540. Segment 4a Color experienced the strongest growth at 36%, increasing from $6,527 to $8,899. Segment 4b Color increased by 17%, from $9,338 to $10,955, and Segment 5 Color saw a 14% rise from $12,581 to $14,361.

During the period, average A3 mono segment prices increased across all tiers, although growth varied by segment. Segment 2 Mono rose by 23%, increasing from $2,656 to $3,255. Segment 3 Mono experienced a more modest 13% increase, rising from $4,110 to $4,640. Segment 4 Mono grew by 17%, moving from $5,625 to $6,602, while Segment 5 Mono also increased by 13%, from $11,012 to $12,424. Segment 6 Mono saw the strongest price increase, rising 32% from $12,814 to $16,959.
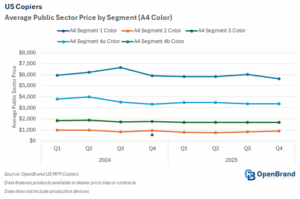
Average A4 color segment prices showed broad softening over the period, with declines across all reported tiers. Segment 2 Color decreased by 9%, falling from $985 to $896. Segment 3 Color declined 7%, moving from $1,836 to $1,704. Segment 4a Color experienced a larger contraction of 12%, dropping from $3,794 to $3,349. Segment 4b Color also declined, down 5% from $5,944 to $5,649.
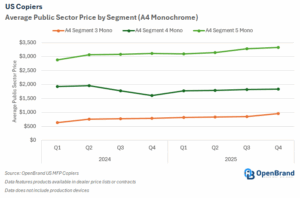
Average A4 mono segment prices showed mixed performance across tiers over the period. Segment 3 Mono recorded strong growth, increasing 50% from $634 to $952. Segment 4 Mono declined slightly by 4%, falling from $1,919 to $1,834. In contrast, Segment 5 Mono posted solid growth of 16%, rising from $2,874 to $3,323.
MFP Copiers: 2026 Market Outlook
The copier market is poised for transformative changes in 2026 as manufacturers respond to shifting customer demands, mergers and acquisitions, and global economic pressures. Product launch activity is anticipated to remain steady, likely focusing on alignment with evolving workplace dynamics that prioritize decentralized and cost-effective equipment that will further the shift from A3 to A4.
Pricing trends will be influenced by multiple factors. While competition could drive down costs in some segments, external pressures such as tariffs on raw materials and components could bring more shifts in pricing strategies.Corporate realignments and partnerships are set to reshape the competitive landscape. Xerox’s completed acquisition of Lexmark brings a significant restructuring of both companies’ portfolios and market strategies. This acquisition positions Xerox to expand its presence in the A4 segment, leveraging Lexmark’s established reputation in SMB and enterprise markets. The integration of Ricoh, Toshiba, and OKI’s R&D efforts will likely result in innovative products and enhanced workflow solutions, while the Fujifilm-Konica Minolta joint venture seeks to optimize procurement strategies and reduce operational costs.
Overall, 2026 will be a year of notable change marked by competitive pressures, portfolio realignments, and strategic corporate moves. Manufacturers that effectively navigate pricing complexities, leverage new partnerships, and capitalize on emerging opportunities will be well-positioned for success in this evolving market.
Get more information
Visit our Print industry page to learn more about the data we deliver for the Ink Supplies market – or reach out to our analyst below to ask questions about this report or get specific insights you need.
About the Analyst

2025 Retail Pricing Strategies Unpacked: Data-Backed Trends in Appliances, Electronics, and More
Trends in Bloom Webinar: Analyst Insights on Retail Pricing Strategies & Promotions
OpenBrand’s first-ever analyst roundtable webinar, “Trends in Bloom,” brought together six category experts to unpack the top developments shaping the consumer durables landscape in the first half of 2025.
Watch the full webinar now, and check out the key takeaways by category below, allowing you to dive straight into the insights most relevant to your business.
Setting the Stage: How are consumers reacting to tariffs and the current climate?
Before jumping into the key highlights, let’s level the playing field with a few critical data points around consumers’ reactions to the current market.
OpenBrand’s daily MindShare survey revealed consistent shifts in consumer awareness around tariffs and those perceptions are impacting purchase decisions. Here’s what the data shows:
- There is a steady decline (~6 ppt) among those consumers who reported ‘tariffs did not affect their decisions’ from 52.7% in March to 46.9% in May.
- In addition, more consumers reported delaying purchases due to higher prices – 13.8% in March and 191% in May, indicating a clear signal sensitivity is growing.

Consumers are not wrong to be cautious after several months of relatively soft or even deflationary movement in durables; April marked a critical turning point likely tied to the implementation of new US tariffs. OpenBrand’s CPI report for May 2025 revealed:
- Another turning point in durable goods pricing as price growth accelerated for the second consecutive month, rising +0.53% MOM up from +0.35% in April.
- Price growth was driven primarily by an increase in appliances, home improvement and personal care products.
- Appliance prices, which declined slightly in April, rose sharply with a 0.77% gain.
- Home Improvement products saw an increase as well, up from 0.59% in April to 0.81% in May.
- The personal care category reversed its course from a decline in April to an increase of 0.56% in May.
These changes are more than seasonal; they are a result of what we are seeing in the market and many of these increases are just the early signs of costs now being passed on to consumers.
Read on to see how some of the top categories are performing in light of the economic climate and what it means in terms of pricing, promotions and product lineup into fall.
Retail Pricing & Promo Strategies: Printers
A Quiet Spring, But Eyes on Back-to-School
For a category that often sees a seasonal uptick ahead of back-to-school, printer hardware has been unusually quiet this year. Here are a few highlights:
- Only 31 new printer models launched in the U.S. through May, the lowest spring launch count in the last few years.
- Business Printers saw all 17 launches occur in Q1, with nothing new added in April or May.
- Personal & SOHO Printer refreshes also lagged behind prior years.
Pricing & Promotions
So what’s holding things back? A combination of strategic timing and external pressure with tariffs at the top. While pricing has remained mostly stable thus far, the promotional landscape is far more volatile than in years past. Instant savings activity has softened, and we’ve yet to see any breakout promotional moment as we head into the key shopping months.
As we approach back-to-school season, consumers can expect promos to be value-restoring rather than deeply discount-driven, largely due to tariff pressures looming in the market.
Retail Pricing & Promo Strategies: Outdoor Power Equipment (OPE)
Tariff Headwinds, Smart Promotions
Few categories illustrate the impact of tariffs more clearly than outdoor power equipment (OPE). As tariffs ripple the industry, key brands like Stanley Black & Decker, STIHL, Husqvarna, Makita, and Caterpillar are noting the rising costs and moving quickly to adjust operating plans. From supply chain reworks to signaling price hikes ahead, these top brands are making it clear: cost pressures are real and pricing adjustments are underway.
Review of the OpenBrand pricing data highlights the following movement in OPE:
- Walk-behind mowers saw the most significant price increase, with net prices up +10.7% YTD between January to May.
- Other handheld tools like hedge trimmers (+7.5%) and chainsaws (+2.3%) also trended upward.
- Larger equipment like riding mowers and ZTRs actually saw prices drop slightly, reflecting soft demand, excess inventory, or pressure at higher price tiers.
On the promotions front, OPE activity peaked early.
- March brought a flurry of instant savings during spring launch season, led by Greenworks, Worx, EGO, and EcoFlow, but things cooled off by May.
- Deeper promotions were concentrated in very specific areas, namely robotic mowers, generators, and leaf blowers, all products under pressure as a result of slow sell-through, competition, and seasonality.
- Greenworks, Worx, Ryobi, and EGO were among the most frequently discounted brands.
During Memorial Day, the messaging shifted to value-based promotions: bundled batteries, free tools with purchase, and loyalty-driven incentives that avoided deep discounts.
The big question for summer: can brands maintain this measured approach—or will competition force a deeper dive?

OPE Product Innovation Trends
Innovation in the OPE space this spring has centered on three interwoven themes: autonomy, battery ecosystems, and performance messaging.
Autonomous mowing saw momentum in both the residential and commercial sectors, with brands like Husqvarna and Exmark expanding their portfolios to reflect growing interest in hands-free solutions.
At the same time, manufacturers doubled down on their battery platform strategies, highlighting cross-tool compatibility and bundling incentives to deepen consumer loyalty.
There’s also been a noticeable shift in how products are marketed, with emphasis on power, runtime, and torque as proof points that battery-run OPE can now rival gas in more demanding applications.
Together, these themes point to a long-term vision: one where innovation is more than solely new features, focusing also on reshaping how OPE products are purchased, used, and perceived.
Retail Pricing & Promo Strategies: Major Appliances
Higher Prices, Strategic Discounting
Home appliances are one of the clearest examples of a pricing rebound. After a softer 2024, Spring 2025 saw prices rise across nearly every subcategory. Here are some of the highlights:
- Laundry appliances jumped nearly 7% YoY, surpassing the $1,000 average price point.
- OTR microwaves, dishwashers, and refrigerators followed suit, each seeing meaningful gains ranging +2.4% to +5.8%.
- While range prices fell slightly on a net basis (-2%), pre-discount prices increased, giving brands flexibility to advertise deals while preserving margin.

Promotions also told a tale of two strategies. Samsung and LG leaned into deeper discounts leveraging their premium positioning to attract deal-seekers. In contrast, data revealed legacy value brands like Whirlpool, Frigidaire, and Maytag pulling back, indicating maintaining margin is a higher priority.
Memorial Day 2025 brought some of the strongest appliance deals we’ve seen in months, with Home Depot advertising discounts up to 35% and Lowe’s promoting savings of up to 40% on select products.
Still, behind the scenes, brands are navigating a tightrope between inflation recovery and promotional competitiveness.
Retail Pricing & Promo Strategies: Computing
Mixed Signals, Evolving Strategies
The computing category, particularly notebooks and desktops, is in the midst of a transition.
While inflation is real, pricing trends are far from uniform. Average notebook prices declined slightly year-over-year, yet pricing volatility has surged as tariffs affect new model rollouts, especially in gaming SKUs.
In-store promotions spiked in May due to clearance cycles, while online channels began tapering discounts likely driven by limited supply of newer, higher-priced models.
One clear winner in this environment? Copilot+ notebooks. Over a third of new in-store displays at Best Buy and Costco now feature these AI-enhanced machines, signaling a strong shift toward performance and utility.
Chromebooks, long seen as the back-to-school MVP, are also undergoing a transformation. Prices are up, and discounting has weakened, especially for Windows competitors. This suggests a new pricing normal may be settling in, one where value is measured more in long-term utility than short-term markdowns.
Retail Pricing & Promo Strategies: Tablets
A Split Market Emerges
Tablets are no longer one market: they’re two. This split indicates a clear divide between premium and budget strategies.
On one end, budget brands like Amazon, Lenovo, and Samsung have trimmed average selling prices (ASP), making these models more accessible in a value-conscious climate.
- According to OpenBrand data, ASPs for each were down $23 or more; Amazon (-$23), Lenovo (-$24), and Samsung (-$31).
- Meanwhile, Apple and Microsoft are pushing premium models further up the pricing ladder +$102 and +$162, respectively.
This split is shaping both launch strategy and promotions.

Apple’s latest iPad Pro and Air models launched with higher storage and premium features, while holding (or even increasing) price.
Microsoft’s Surface Pro Copilot+ made waves by slashing its entry price by $200 but compromising display quality and performance.
Spring discounts told a similar story. While overall promotional values rose, percentage discounts actually dropped—meaning brands are applying promos to higher-priced models. Aggressive clearance activity centered on aging iPad Pro models, which saw discounts of up to 47% off.
The goal? Clear room for a more premium-focused lineup moving into fall.
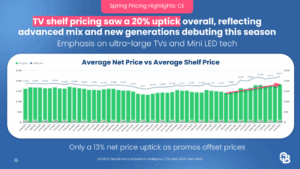
Retail Pricing & Promo Strategies: TVs
Price Rises But Deals Still Drive Behavior
The TV market is booming — literally and figuratively.
This spring brought a wave of ultra-large formats, Mini LED innovation, and premium OLED debuts.
Shelf prices rose 20%, but thanks to elevated promotional activity, net prices only climbed 13% YoY, a testament to how crucial deals remain in this category.
TCL and Hisense were especially aggressive, using events like the Super Bowl and Memorial Day to launch compelling offers, including BOGOs and bundled value adds (e.g. Free projectors or 55” bonus TVs). Promotions during this time approached Black Friday levels, averaging 26% off with over $600 in average promotional value.
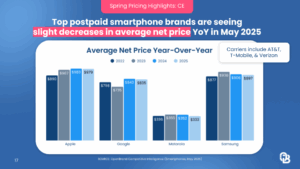
Retail Pricing & Promo Strategies: Smartphones
Trade-Ins & Familiarity Lead Behavior
Smartphone promotions followed in a similar suit as televisions.
Average prices dipped slightly YoY as brands continued to lean heavily into trade-in bonuses to offset any sign of tariff-driven cost increases. Apple, Samsung, and Motorola each offered limited-time boosts to get shoppers to upgrade before summer.
Consumer behavior data collected from OpenBrand’s MindShare survey showed shoppers gravitating toward familiar brands like Samsung and Apple, another example which signaled a desire for stability in a volatile economy.
Looking Ahead: Outlook for the Second Half of 2025
As we enter summer and back-to-school, all eyes are on how brands manage cost pressure, inventory, and value perception. Promotions are likely to remain targeted and strategic, not broad-based. In addition, as some segments like printers and gaming PCs are in a holding pattern for now, the pace of refreshes is expected to pick up as we move toward Prime Day and into fall.
Meanwhile, Walmart is seeing a rise in shoppers especially in computing and tablets, thanks to modest pricing increases and reliable availability. Retailers who can offer consistency, as well as a compelling value story, stand to benefit most in today’s climate.
Final Thoughts: Growth Through Alignment
As senior analyst Valerie Alde-Hayman closed out the webinar, she left us with a simple takeaway: the market is changing, and brands need to change with it.
Alignment across pricing, promotions, product timing, and inventory strategy is essential to staying competitive in today’s market..
As the market evolves, so should your strategy. This new season brings change and opportunity. In a landscape shaped by shifting prices, cautious consumers, and rising competitive pressure, success depends on having the right intelligence at the right time.
Let our data guide your next move.
If you’re navigating where to focus, when to promote, or how to win in a tariff-tangled, value-driven world, backing your retail pricing and promotions strategy with data is a must. OpenBrand is the edge you need.
See how we can support your strategy through data.
Request a custom brand report now.

MFP Copiers: 2024 Year-In-Review
This OpenBrand year-in-review report recaps product launch activity, portfolio shifts, and pricing captured throughout 2024 with comparisons drawn to 2023. The report features data and insights from OpenBrand’s US MFP Copiers Reports, which include devices intended to sell through the dealer channel.
Read through all the 2024 pricing and promotions insights below or email the report to read later.
Methodology
The data used in this report is leveraged from the OpenBrand US MFP-Copiers Pricing & Promotions Report and the US Dealer Cost Report between the dates of Q1 2023 and Q4 2024. Data includes all products except production models that were captured in dealer price lists or contracts. The launch activity section, however, includes products that were announced but have not been captured in dealer price lists or contracts to-date. This section also features data from 2019 to 2024. This section also includes production models.
Impact Summary
- Launch activity reached 121 new products, declining 15% compared to 2023
- Portfolios continued to shift from A3 to A4
- Average public sector prices increased across several key segments
2024 Copier Product Launch Activity
Copier hardware launch activity was steady for most of the year, while demonstrating a significant uptick in September when Katun and Fujifilm Business Innovation announced major series launches. With a total of 121 products introduced for the dealer channel, this year’s launch activity had 15% fewer product launches than last year, becoming the second-slowest year in terms of launch activity since 2021.

The US copier market demonstrated a significant shift in 2024, with newcomers taking two of the top three spots for launch activity. With 28 new products announced, Fujifilm Business Innovation had the most launches in 2024. The move was marked by the OEM’s September announcement to partner with Marco Technologies, which became the first US dealer authorized to sell Apeos A3 and A4 MFPs. The partnership underscored Fujifilm’s strategy of westward expansion following the dissolution of the Fuji-Xerox partnership in 2021 and the OEM’s formal entry into European markets in April 2024.
Konica Minolta captured second place with 21 product launches in 2024, marking a noteworthy shift in pace after introducing just five products in 2023. The product introductions were made across two distinct launch announcements. These included the launch of eight A4 devices in March and the introduction of 13 A3 MFPs in July.
Katun rounded out the top three with a major announcement in September, when the brand unveiled its new Arivia lineup, effectively marking Katun’s entry into the US (and global) copier market. Although 11 A3 toner-based devices were initially introduced, OpenBrand uncovered four additional configurations within the series, which features color devices ranging from 25ppm to 65ppm and monochrome devices between 25ppm and 55ppm.
Portfolios
The copier market is undergoing a significant transformation, driven by evolving workplace trends, technological advancements, sustainability efforts, and budget constraints. As such, the market increasingly shifted to A4 devices, marking a pivot from A3’s dominant role.
A4 devices demonstrated steady growth over the two years, with product counts increasing by 12% from 214 in 1H 2023 to 239 in 2H 2024. The second half of 2024 ended with 215 A3 products available to dealers. Although this number represents a 3% increase compared to 1H 2023, this count is still lower than the number of A4 models offered. This shift reflects the ongoing market attention toward compact, cost-effective solutions that align with the needs of hybrid and decentralized work environments.

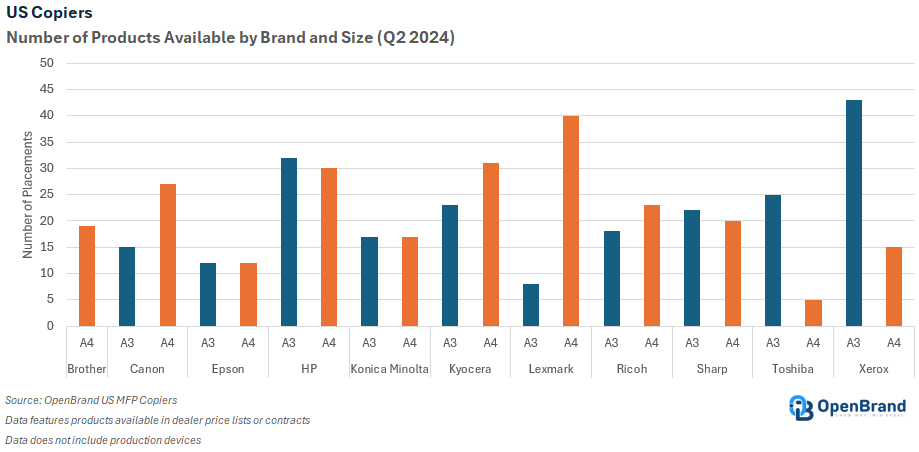
In Q4 2024, brands displayed distinct strategies in balancing their A3 and A4 portfolios. Lexmark and Kyocera leaned heavily toward A4 devices, with 40 and 31 A4 models, respectively. Brother focused entirely on A4 with 19 models, reinforcing its commitment to the SMB and SOHO segments (as well as its lack of A3 technology or partnerships). Canon also leaned more toward A4, offering 27 A4 models compared to 15 A3 devices. Conversely, Xerox and Toshiba prioritized A3 devices, with 43 and 25 models, respectively. HP maintained a balanced portfolio with 32 A3 and 30 A4 models, while Sharp and Ricoh showed similar dual-focus strategies to address diverse market needs.
Copier Market Pricing
Between Q1 2023 and Q4 2024, A3 color segment public sector prices saw significant growth across all tiers, reflecting the market’s upward shift toward higher-value devices and downward shift into A4.
Segment 1 Color rose by 42%, from $3,200 to $4,545 while Segment 2 Color experienced a 44% increase to $5,604.
Segment 3 Color grew by 41%, from $5,029 to $7,115 while Segment 4a Color rose by 28%, from $6,372 to $8,133.
Segment 4b Color increased by 41%, from $7,725 to $10,872, and Segment 5 Color saw a 21% rise from $11,403 to $13,844.

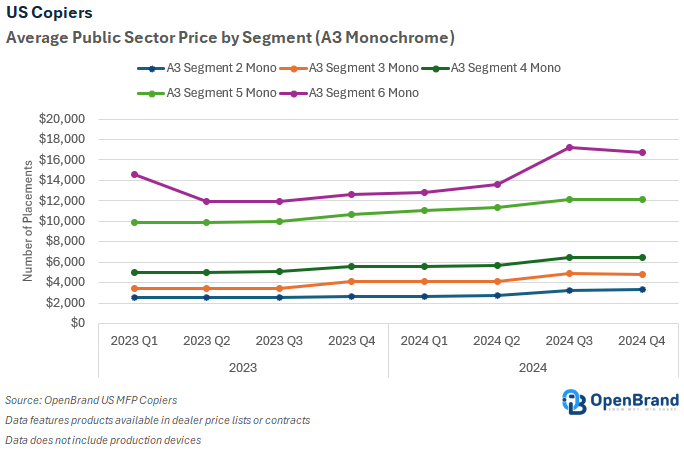
During the period, A3 mono segment prices experienced significant increases across all tiers. Segment 2 Mono saw a 32% rise, from $2,519 to $3,334, and Segment 3 Mono grew by 41% from $3,415 to $4,818. Segment 4 Mono rose by 28% from $5,028 to $6,423 while Segment 5 Mono experienced a 22% increase from $9,899 to $12,122. Finally, Segment 6 Mono saw the most significant rise at 14%, increasing from $14,608 to $16,691.
A4 color segment prices exhibited mixed trends, with some tiers experiencing growth and others showing declines. Segment 2 Color saw a slight decline of 4% from $993 to $958. Segment 3 Color remained relatively stable, with a modest decline of 3% from $1,834 to $1,774. Segment 4a Color experienced a decrease of 2%, from $3,406 to $3,346 while, in contrast, Segment 4b Color pricing grew 6% from $5,970 to $5,911.
Average A4 mono segment prices also exhibited varied trends across tiers. Segment 3 Mono showed a modest increase of 19% from $660 to $784 while Segment 4 Mono, however, experienced a 3% decline from $1,644 to $1,599. Segment 5 Mono demonstrated 3% growth, increasing from $3,212 to $3,116.
Copier Market Outlook Going into 2026
The copier market is poised for transformative changes in 2025 as manufacturers respond to shifting customer demands, mergers and acquisitions, and global economic pressures. Product launch activity is anticipated to remain steady, likely focusing on alignment with evolving workplace dynamics that prioritize decentralized and cost-effective equipment that will further the shift from A3 to A4.
Pricing trends will be influenced by multiple factors. While competition could drive down costs in some segments, external pressures such as tariffs on raw materials and components may result in price increases, particularly for high-end devices.
Corporate realignments and partnerships are set to reshape the competitive landscape. Xerox’s planned acquisition of Lexmark, expected to close in the second half of 2025, will lead to a significant restructuring of both companies’ portfolios and market strategies. This merger positions Xerox to expand its presence in the A4 segment, leveraging Lexmark’s established reputation in SMB and enterprise markets. Ricoh and Toshiba’s integration of R&D efforts will likely result in innovative products and enhanced workflow solutions, while the Fujifilm-Konica Minolta joint venture seeks to optimize procurement strategies and reduce operational costs.
Additionally, the industry will continue to keep a close eye on efforts from Fujifilm and Katun. Fujifilm’s continued expansion into Western markets could intensify competition, although the brand may still be challenged to build out its channel network. Additionally, Katun’s entry into the global market introduces new competition, as the company seeks to establish itself in the crowded and mature market.
Overall, 2025 will be a year of significant change, marked by competitive pressures, portfolio realignments, and strategic corporate moves. Manufacturers that effectively navigate pricing complexities, leverage new partnerships, strengthen existing partnerships, and capitalize on emerging opportunities will be well-positioned for success in this evolving market.
Get more information
About the Author
Printer Hardware: 2024 Year-In-Review
Our printer hardware year-in-review report recaps printer hardware launches, placements, pricing and advertising and promotional activity captured throughout 2024 with comparisons drawn to 2023. The report features data and insights from OpenBrand’s Business Printers and Personal & SOHO Printers categories, which feature printer hardware sold through the US ecommerce and brick-and-mortar channels.
Read through all the 2024 pricing and promotions insights below or email the report to read later.
Methodology
Data included in this report is sourced from the OpenBrand Business Printers and Personal & SOHO Printers categories. Data in this analysis (except for advertising data) was captured between Q1 2023 (week of January 1) and Q4 2024 (week of December 8). Advertising data runs through December 31, 2024. Retail advertisements include Banner Ads and Retail Circulars captured at retailers and their dot com counterparts (i.e. Staples and Staples.com). The merchants were updated to only the brick-and-mortar name regardless of channel for simplicity (i.e. any Staples.com ads were updated to Staples). Additionally, the following advertising section features SKU-specific ads.
Impact Summary
- HP, Brother, and Canon were major drivers of product launch activity in 2024
- Placements across channels increased by 5% on average, with ecommerce dominating placement counts
- Average net prices increased by 2%
- In-store average promotion values increased by 11% compared to 2023 while the average discount off of shelf was 27%
- Advertising activity for the full year increased by 2% compared to 2023
Product Launch Activity
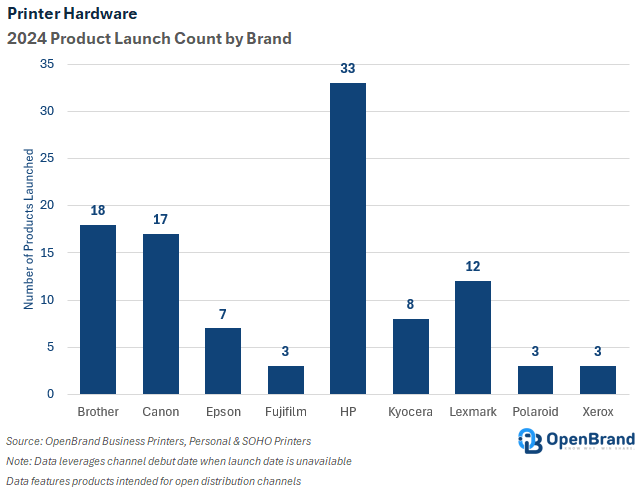
Printer hardware launch activity was steady throughout 2024 but fell short compared to the number of product introductions in 2023. With a total of 104 products introduced for open distribution channels, this year’s launch activity had 37% fewer product launches than last year and was on-pace with what was observed between 2020 and 2022.
Personal & SOHO Printers represented the majority of 2024 product introductions at 76%, while Business Printers comprised the remaining 24%. Across the two categories, HP introduced the highest number of products (33), followed by Brother in second place with 18 models, and Canon rounding out the top three with 17.
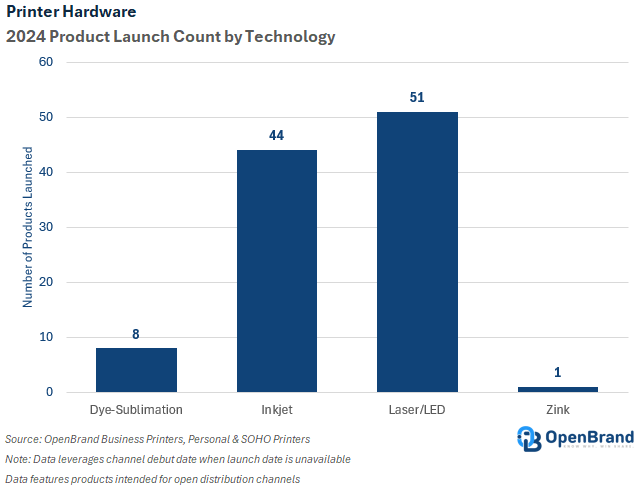
By technology, laser/LED printer hardware products led with 51 introductions, or 49% overall. Brother represented most of these product launches (18 SKUs), followed by Lexmark (12). Inkjet came in second, representing 42% of launches with 44 new products introduced. HP comprised 26 of the 44 inkjet introductions (59%), and Canon (11 SKUs) and Epson (seven SKUs) were the only other brands to launch new inkjet models. Dye-sublimation technology was third with eight product launches, followed by Zink with just one.
Placements
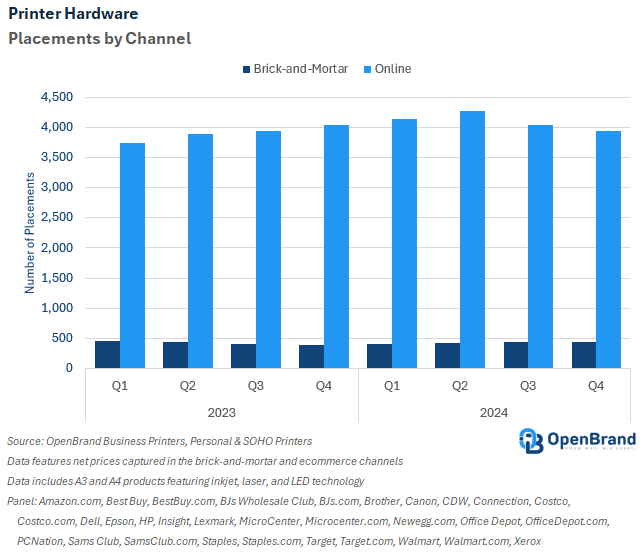
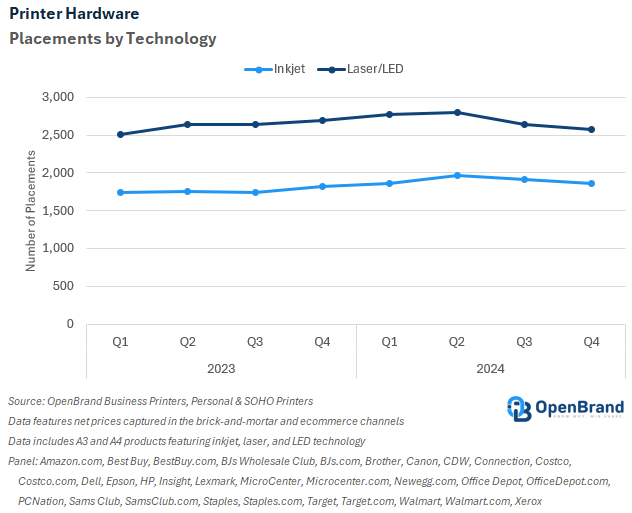
The average number of placements captured throughout the year increased for both the brick-and-mortar and the ecommerce channel in 2024 versus 2023. The growth in both channels suggests that manufacturers and retailers are pursuing balanced omnichannel strategies, leveraging the strengths of each channel to maximize visibility and accessibility.
The average number of shelf placements in brick-and-mortar stores grew slightly in 2024, rising to 428 placements from 424 placements in 2023. This marginal 1% increase reflects the steady role of physical retail in maintaining product visibility, especially in high-traffic stores. The consistent performance highlights brick-and-mortar's continued importance, even as online channels dominate the count of printer hardware placements.
Listings in the ecommerce channel were observed with a more significant increase in 2024, with the average rising to 4,096 listings, up 5% from 3,903 listings in 2023. This growth underscores the ongoing expansion of ecommerce, as retailers and manufacturers prioritize digital platforms to reach broader audiences and cater to changing shopping behaviors.
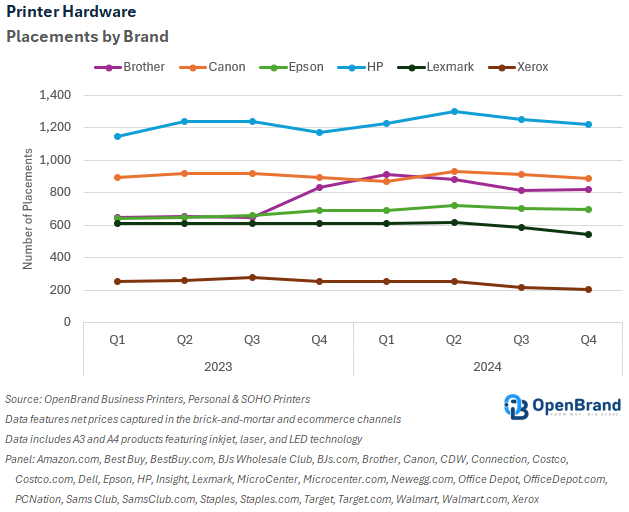
In 2024, Brother achieved the most significant growth, increasing its average placement count by 23% year-over-year to 855. HP maintained its market leadership with the highest average placements at 1,250, up 4% from 2023. Epson also showed steady progress, with a 7% increase in average placements to 703. Meanwhile, Canon remained stable with a slight 1% decline, averaging 898 placements, while Lexmark experienced a modest 3% decrease to 589. Xerox faced the sharpest drop, with average placements falling 12% to 231, highlighting struggles to maintain relevance in a competitive landscape.
In 2024, inkjet and laser/LED technologies both saw year-over-year growth, with inkjet placements increasing by 8% to an average of 1,902 and laser/LED placements rising by 2% to an average of 2,622.
Pricing
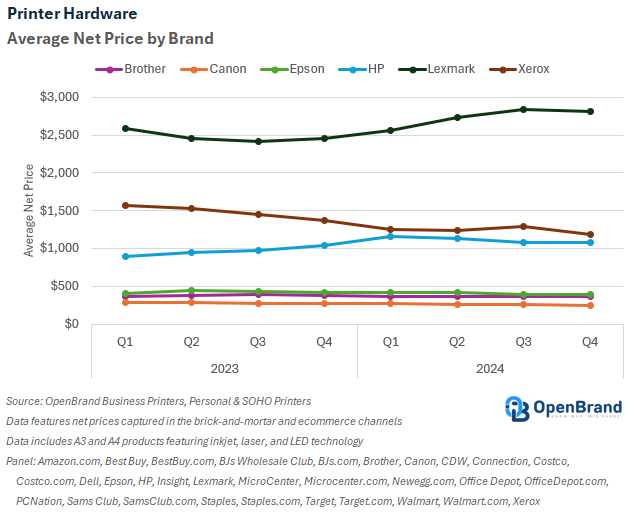
Average 2024 net prices across open distribution channels (both brick-and-mortar and ecommerce) increased by 2% in 2024 compared to 2023. Prices were down across most brands, including Xerox (-16%), Canon (-7%), Brother (-4%), and Epson (-4%) but were offset by increases from HP and Lexmark. The two brands were observed with respective average net price increases of 15% and 10% year-over-year.
By segment, average net prices increased for A3 devices but were down or flat for A4 models. In 2024, A3 MFP net prices increased by 6% compared to 2023 and were up 2% for A3 SFPs. Meanwhile, A4 MFP average net prices were down 3% and were flat for A4 SFPs.
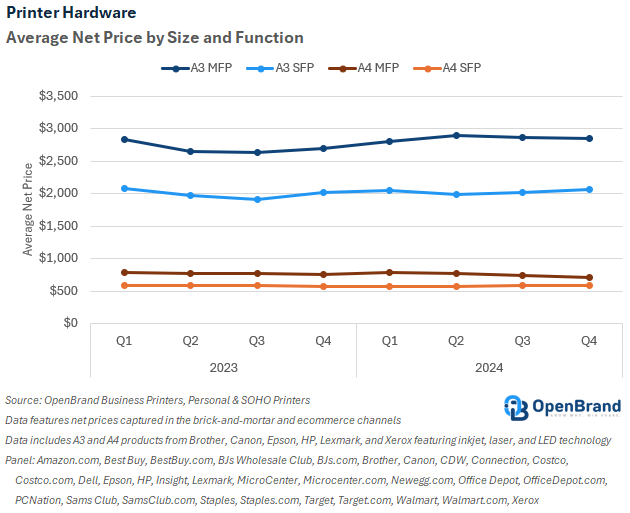
When broken down by size and color capability, average net prices changes varied between 2024 and 2023. A3 B&W net prices were down 12% on average year-over-year but increased by 8% for A3 color models. Average A4 B&W net prices were flat but down 4% for A4 color devices.

Advertising & Promotions
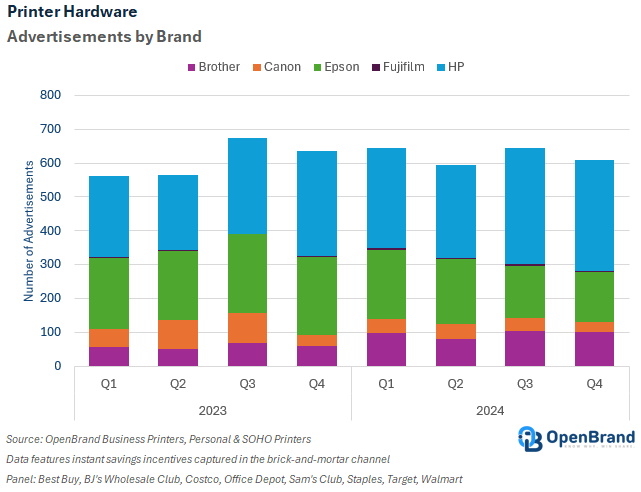
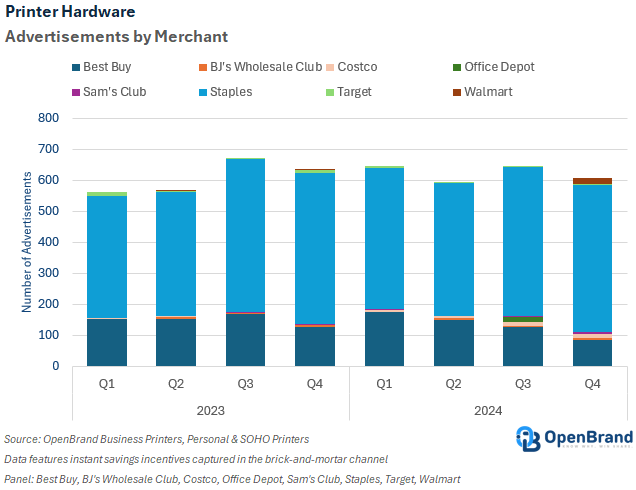
Total SKU-specific printer hardware ad counts grew modestly in 2024, reaching 2,492 ads, up from 2,436 ads in 2023, reflecting a 2% year-over-year increase. This overall stability, however, masks significant variations at the brand level, with some players ramping up their advertising efforts while others pulled back substantially.
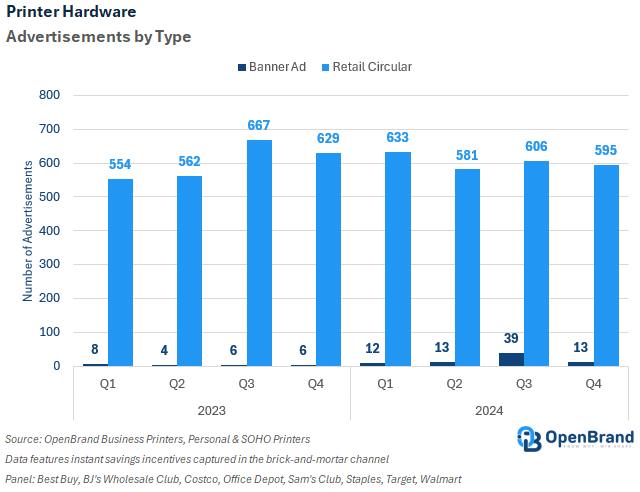
By advertisement type, SKU-specific retail circular advertising remained dominant in both 2023 and 2024, although the year-over-year growth was modest. Total retail circular ads increased from 2,412 ads in 2023 to 2,415 ads in 2024, indicating overall stability. Quarterly performance fluctuated, with Q3 2024 reaching 606 ads, slightly lower than Q3 2023's peak of 667 ads. Q1 2024 also saw growth compared to Q1 2023, with 633 ads versus 554 ads.
SKU-specific banner ad activity surged in 2024, with a total of 77 ads, compared to just 24 ads in 2023, marking a 221% year-over-year increase. The most notable growth occurred in Q3 2024, which saw 39 banner ads, a sharp increase from the six ads in Q3 2023. It should be noted that most banner ads are not SKU-specific, and these were not included in the analysis.
Brother showcased impressive growth, with its ad count rising 64% from 242 in 2023 to 397 in 2024. This surge signals Brother’s strategic push to enhance its visibility and capture greater market share. It should be noted, however, that the majority of Brother’s ads were “Ad Only,” which do not feature any incentive value attached.
In contrast, Epson and Canon saw significant declines in advertising activity. Epson’s ad counts dropped by 21% from 875 in 2023 to 695 in 2024. Similarly, Canon’s advertising efforts fell sharply, with ad counts declining by 41% from 256 to 152. Meanwhile, Fujifilm maintained a consistent but small presence, increasing its ad counts slightly from 11 to 16 as it continued to focus on the niche compact photo printing segment.
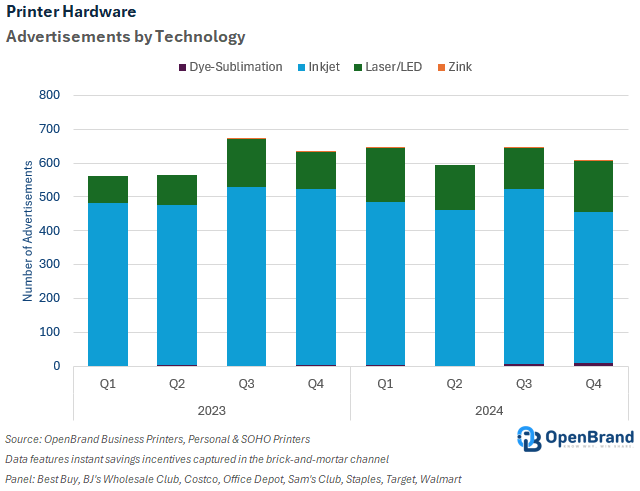
Inkjet technology accounted for the majority of ads in both 2023 and 2024. However, ad counts for inkjet devices slightly declined year-over-year, falling from 1,999 ads in 2023 to 1,897 ads in 2024, a 5% decrease. Quarterly performance fluctuated, with Q3 2024 showing a strong rebound at 515 ads after a decline in Q2 2024 (460 ads). The decrease in Q4 2024 to 443 ads reflects a potential shift in focus to other technologies or marketing strategies.
Laser/LED technology showed significant growth in 2024, with ad counts rising from 420 in 2023 to 565 in 2024, a 35% year-over-year increase. The most notable gains occurred in Q1 2024 (160 ads), a 100% increase compared to Q1 2023 (80 ads).
Dye-sublimation ad activity more than doubled, increasing from 13 ads in 2023 to 26 in 2024. The growth was most pronounced in Q4 2024, with 12 ads, marking a significant rise from four ads in Q4 2023. This suggests a growing focus on niche markets like photo printing, particularly during the 2024 holiday shopping season.
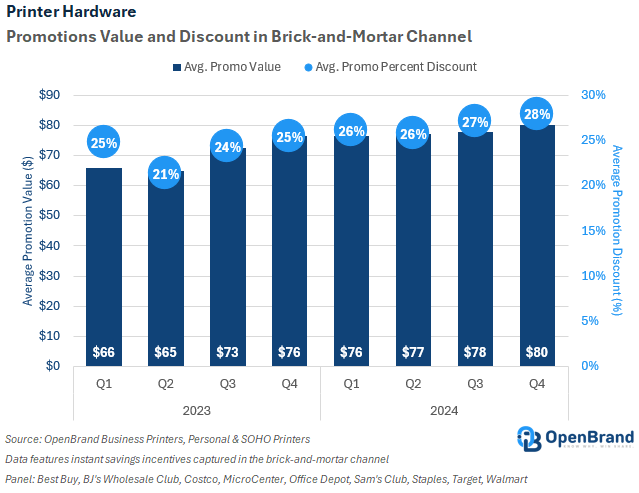
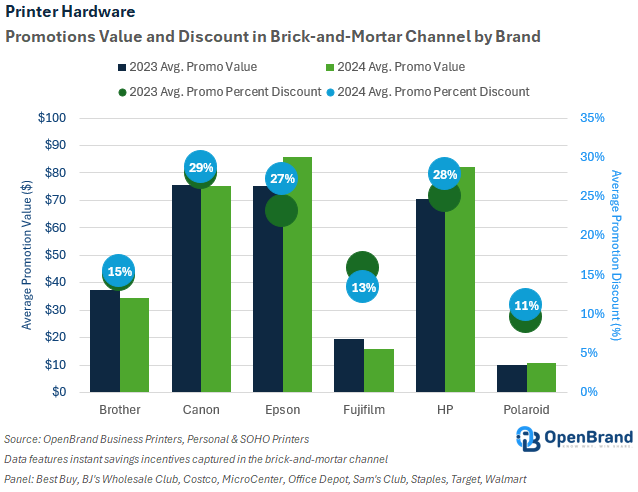
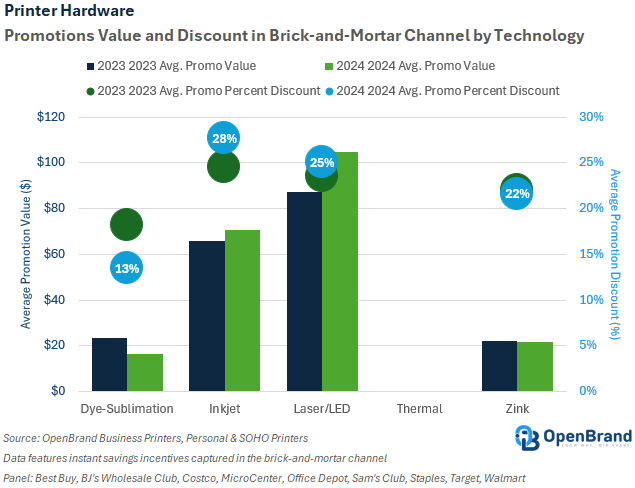
Full-year 2024 average discount depth was more aggressive than 2023 across all brands except Fujifilm. However, average percent discount increases were observed in the single-digits, ranging between one point and four points higher than in 2023. Canon featured the highest average percent discount at 29% off shelf price, followed by HP (28%) and Epson (27%).
Outlook
The 2024 year-in-review highlights key trends and insights into the evolving printer hardware market, driven by a balance of innovation, shifting consumer preferences, and competitive strategies. Moving into 2025, several factors will shape the trajectory of the industry.
Promotional activity is expected to intensify as competition across the printer hardware market continues to grow. Manufacturers and retailers are likely to deploy more aggressive discounting strategies and enhanced value propositions to capture consumer attention. This heightened promotional activity could lead to a reduction in average prices as players compete for market share.
However, pricing trends remain uncertain due to external economic factors. While competition may drive prices down, the potential for tariffs or changes in trade policies could exert upward pressure on costs, particularly for imported products. These conflicting forces highlight the importance of strategic pricing management to balance competitiveness with profitability. These shifts could also affect product launch activity.
Manufacturers and their channel partners should remain agile in navigating this dual dynamic. Investing in data-driven promotional strategies and leveraging omnichannel visibility will be key to staying competitive while managing cost pressures effectively. As the market evolves, pricing and promotional strategies, as well as product value propositions, will play a pivotal role in shaping outcomes for both manufacturers and consumers.