


Earnings reports provide a valuable snapshot of a retailer’s financial performance, offering insight into revenue, sales trends, and overall business health.
However, they often don’t drill down into specific category drivers that contribute to that performance. That’s where OpenBrand comes in. Our market intelligence data plays a part in understanding how key consumer durables categories help drive financial results, enabling the analysis of share shifts by category, product-level contributing factors, pricing strategies, and more.
To that end, as a follow-up to Home Depot and Lowe’s Q4 2024 earnings calls, we took a look at market share shifts, competitive trends, and consumer behavior insights across three categories — major appliances, outdoor power equipment, and power tools — providing a deeper look at how the durables industry is driving results for these retailers.
JUMP TO: Home Depot Q4 Market Report
JUMP TO: Lowe’s Q4 Market Report
Key Takeaways: Home Depot vs. Lowe’s Q4 Earnings
- Home Depot reported: $39.7 billion in revenue and a 14.1% sales increase
- Lowe’s reported: $18.6 billion in revenue and a 0.26% sales decrease
- Category trends: Home Depot leads in outdoor power equipment sales and power tool sales. Lowe’s leads in major appliances. Meanwhile, Amazon is becoming a notable player in the power tools space, with only 1 ppt less share than Lowe’s.
Read on for a look at how Home Depot and Lowe’s performed in Q4 2024, and explore the full market intelligence reports available on this page.
Home Depot Earnings Call
Q4 2024 Performance & Home Depot Market Share Trends
SWIPE TO SEE FULL REPORT, CLICK TO EXPAND SLIDES


Home Depot Earnings Call Overview
Home Depot closed out Q4 2024 with strong financial performance, reporting $39.7 billion in revenue and a 14.1% sales increase. Despite a competitive retail landscape, the company saw modest comp growth of 0.8%, driven in part by key durables categories. We’ll dive deeper into select durables category breakdowns below.
- Revenue: $39.7 billion
- Sales Growth: +14.1%
- Comps: +0.8%
- Diluted EPS: $3.02
Major Appliance Insights
Market Share: Home Depot holds 36.2% of the major appliances market, coming in behind Lowe’s, who leads the major appliance market with 40.2%.
Key Product Categories Driving Growth:
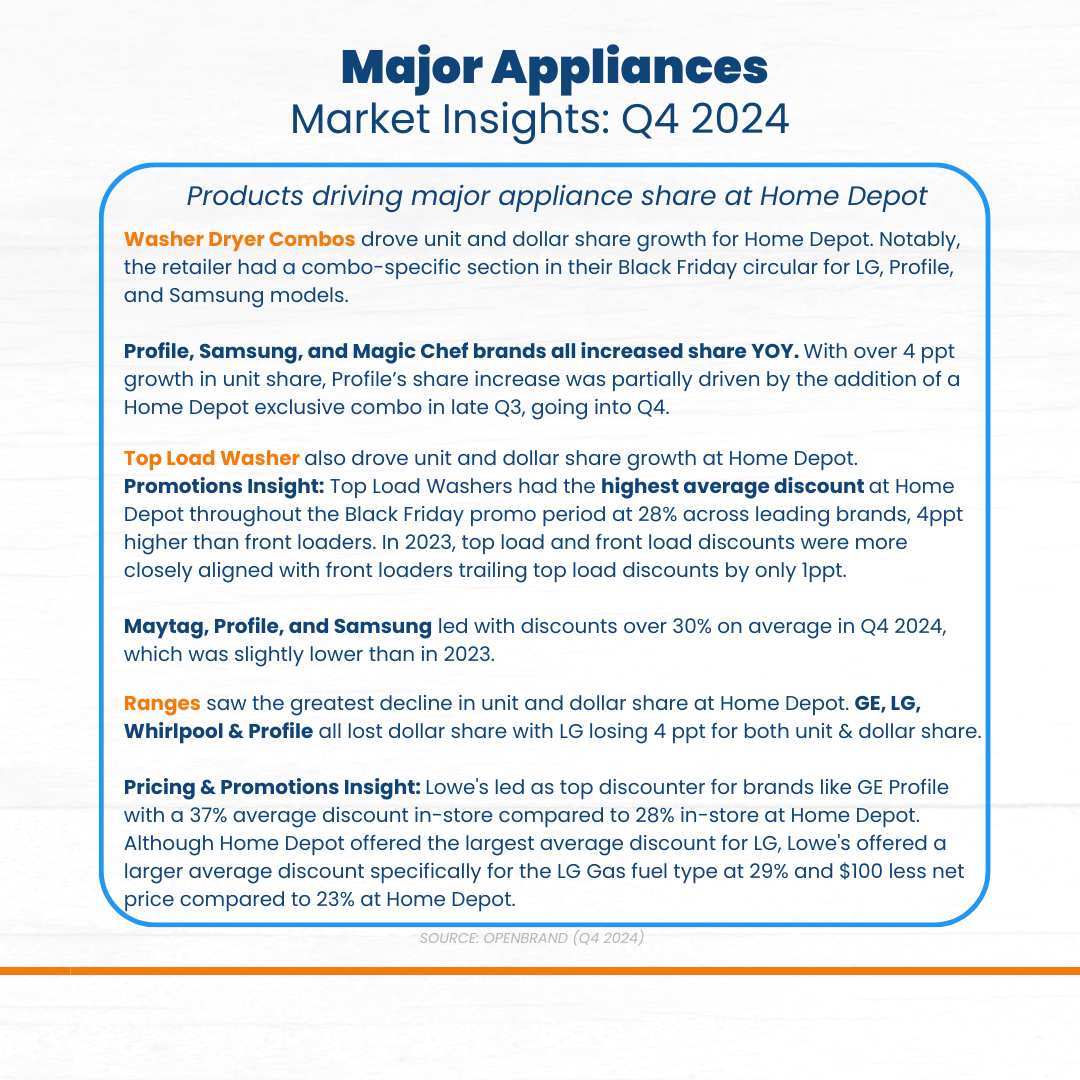
- Top load washers and washer dryer combos drove unit and dollar share growth for Home Depot. Washer dryer combo sales at Home Depot were driven in part by the retailer’s combo-specific section in their Black Friday circular for LG, Profile, and Samsung models. The leading SKU at Home Depot for January 2025 across all appliance categories was Hotpoint’s HTW265ASWWW top load washer.
- Ranges, however, saw the greatest decline in unit and dollar share at Home Depot. This was partially driven by competitive category discounting by Lowe’s, who was the top discounter for brands like GE Profile, with a 37% average discount in-store (compared to Home Depot’s 28%).
Consumer Insights:
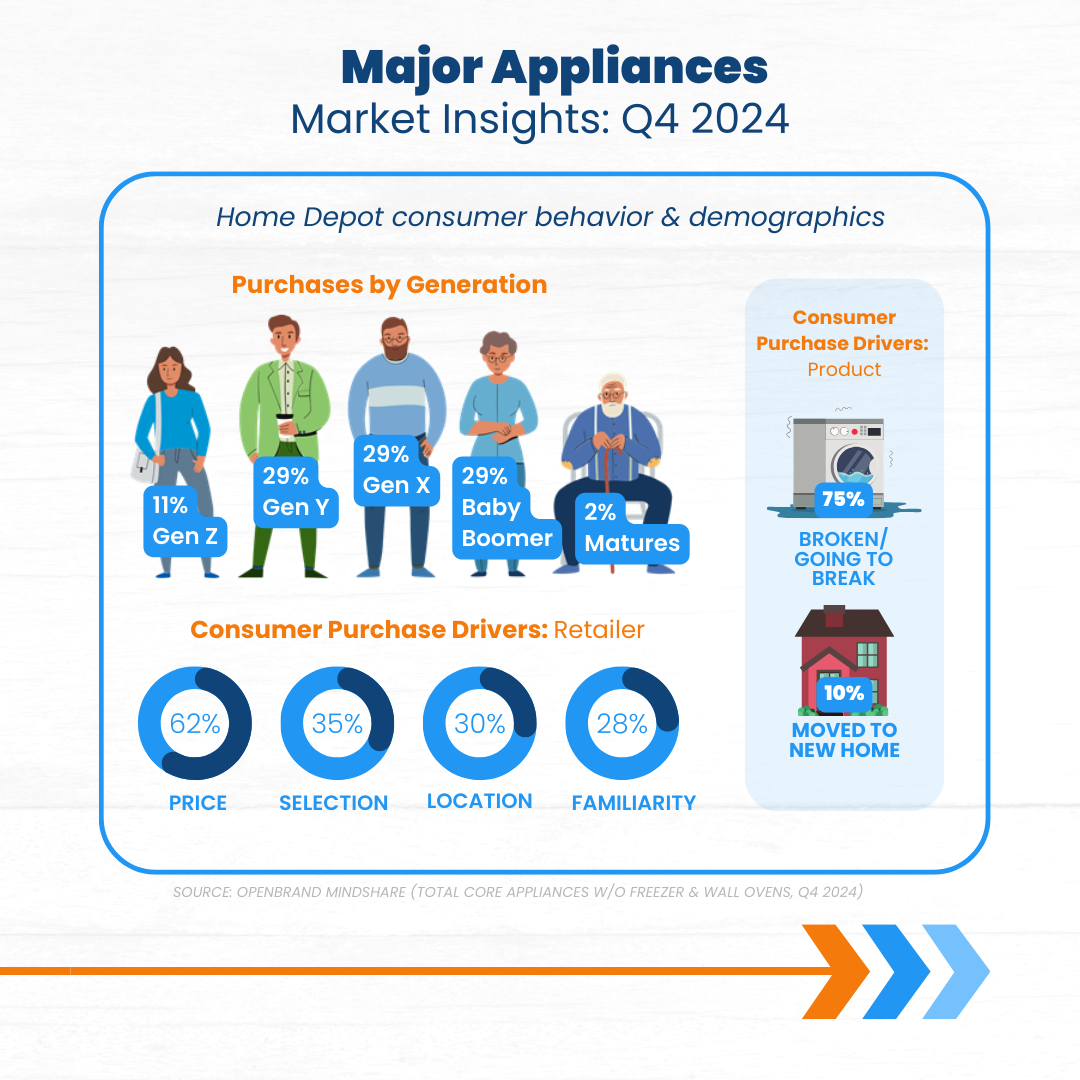
When looking at the makeup of Home Depot consumers in Q4 2024, Gen Y, Gen X, and Baby Boomers made up an equal part (29%) of the major appliance buyer split.
Purchase Drivers: Why did consumers buy major appliances at Home Depot?
- 75% replaced a broken appliance, 10% moved to a new home.
- Price, selection, and location remain key factors in retailer choice.
Outdoor Power Equipment (OPE) Insights
Market Share: Home Depot leads with 46.2%, coming in above all other retailers, including Lowe’s who won 37.3% dollar share. Notably, Walmart and Amazon are making a name for themselves in this space at 7.9% and 7.7% respectively.
Key Product Categories Driving Growth:
- Pressure washers was the only OPE category to see YOY growth at Home Depot in both unit and dollar share.
- Ryobi, exclusive to Home Depot, led unit and dollar share for pressure washers. All top 10 pressure washer SKUs in Q4 2024 were from the Ryobi brand. Additionally, the top SKU at Home Depot in January 2025 across all OPE products was the Ryobi RY120350 pressure washer.
Consumer Insights:
When looking at the makeup of Home Depot OPE consumers in Q4 2024, Gen Y and Gen X took the lead, both making up 31% of OPE buyers.
Purchase Drivers: Why did consumers buy OPE products at Home Depot?
- 36% replaced a broken unit, 21% were first-time buyers.
- Key retailer drivers: price, selection, familiarity, and location.
Power Tools Insights
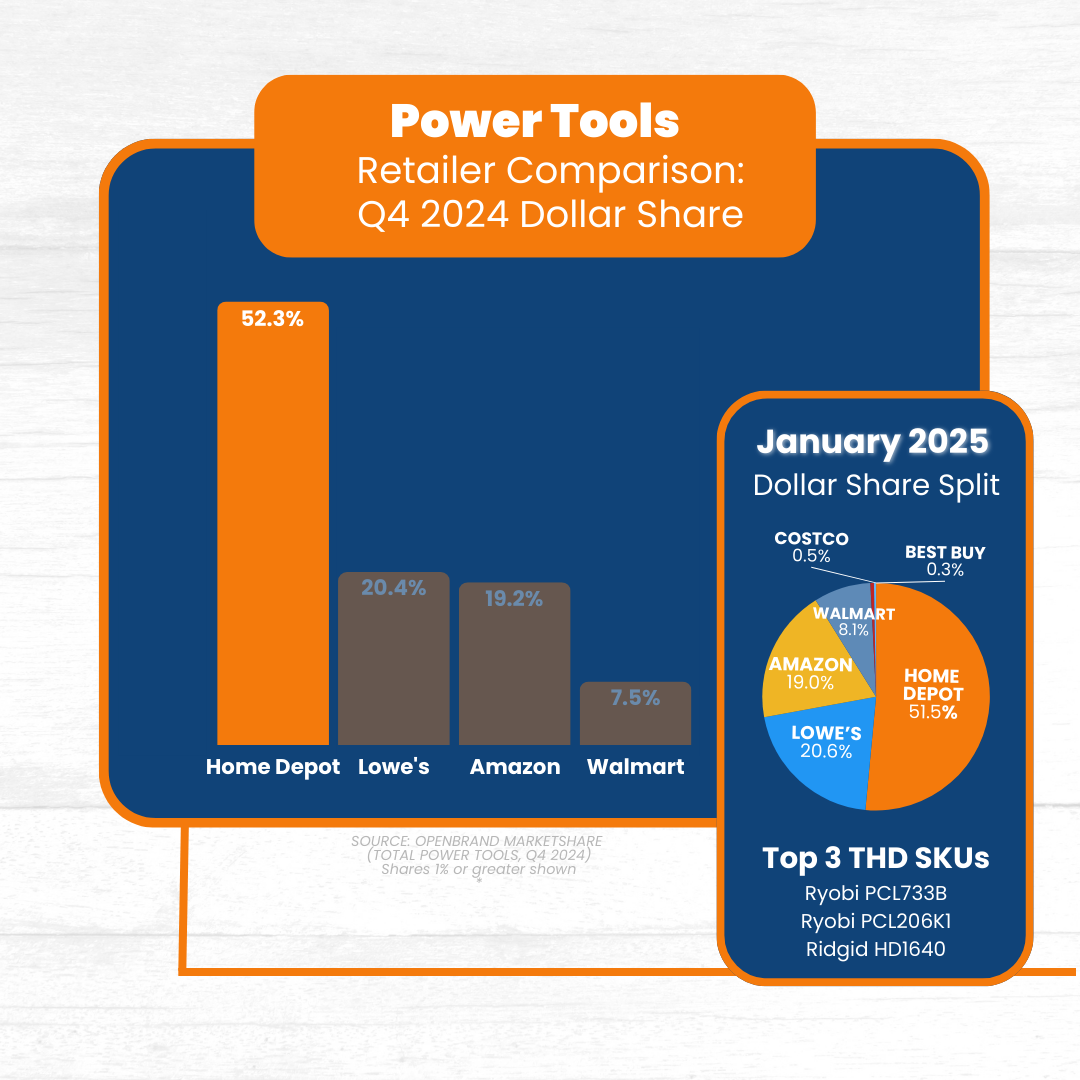
Market Share: Home Depot dominates with 52.3% (Lowe’s: 20.4%, Amazon: 19.2%, Walmart: 7.5%).
Key Product Categories Driving Growth:
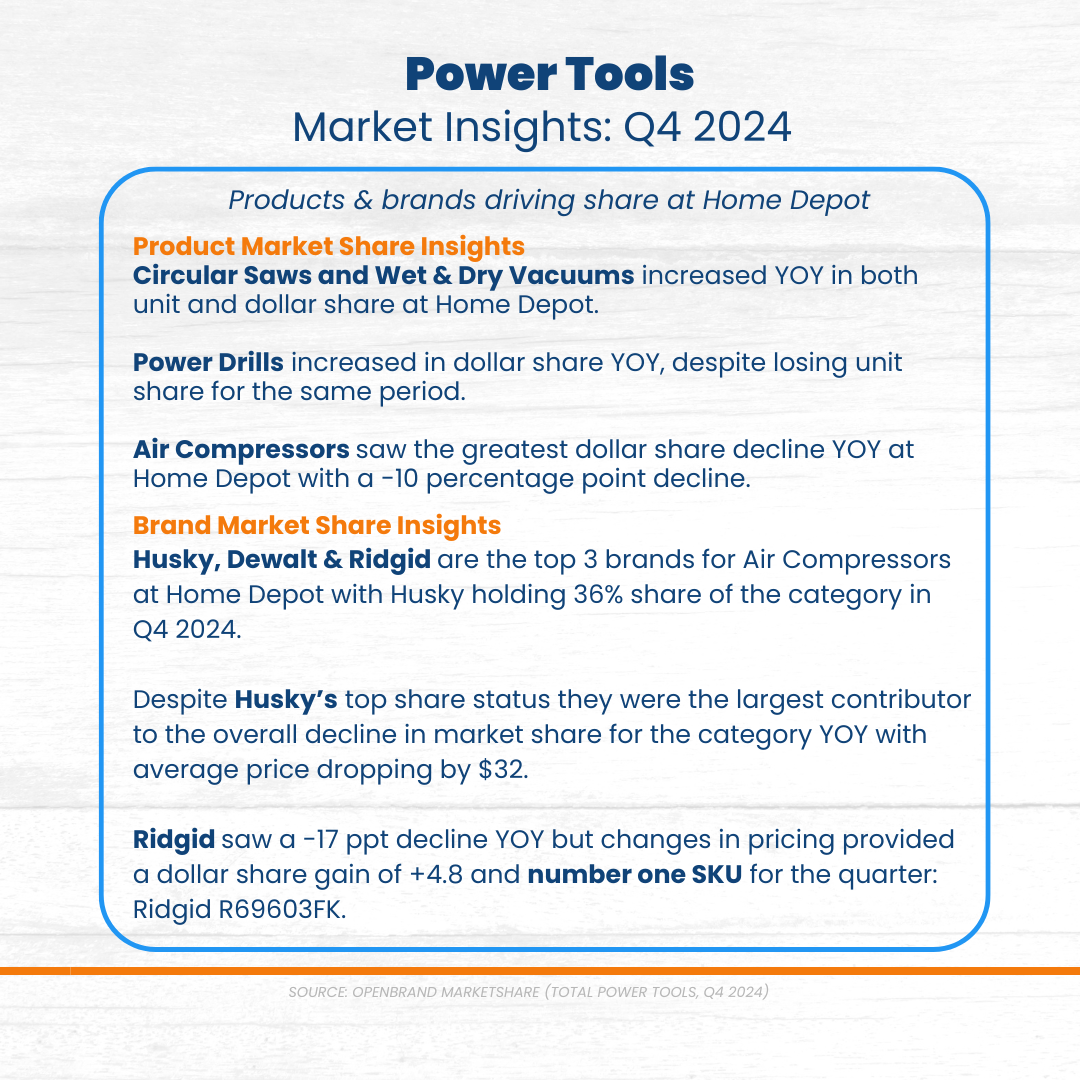
- Circular saws and wet & dry vacuums increased YOY in both unit and dollar share.
- Power drills saw a dollar share increase despite losing unit share.
- Air compressors had the largest decline (-10 ppt), driven partially by Husky’s price drop (-$32 on average). Husky holds 36% of all air compressor share at Home Depot.
- Ryobi once again claimed the top SKU across all Home Depot power tools, with their PCL733B wet & dry vac.
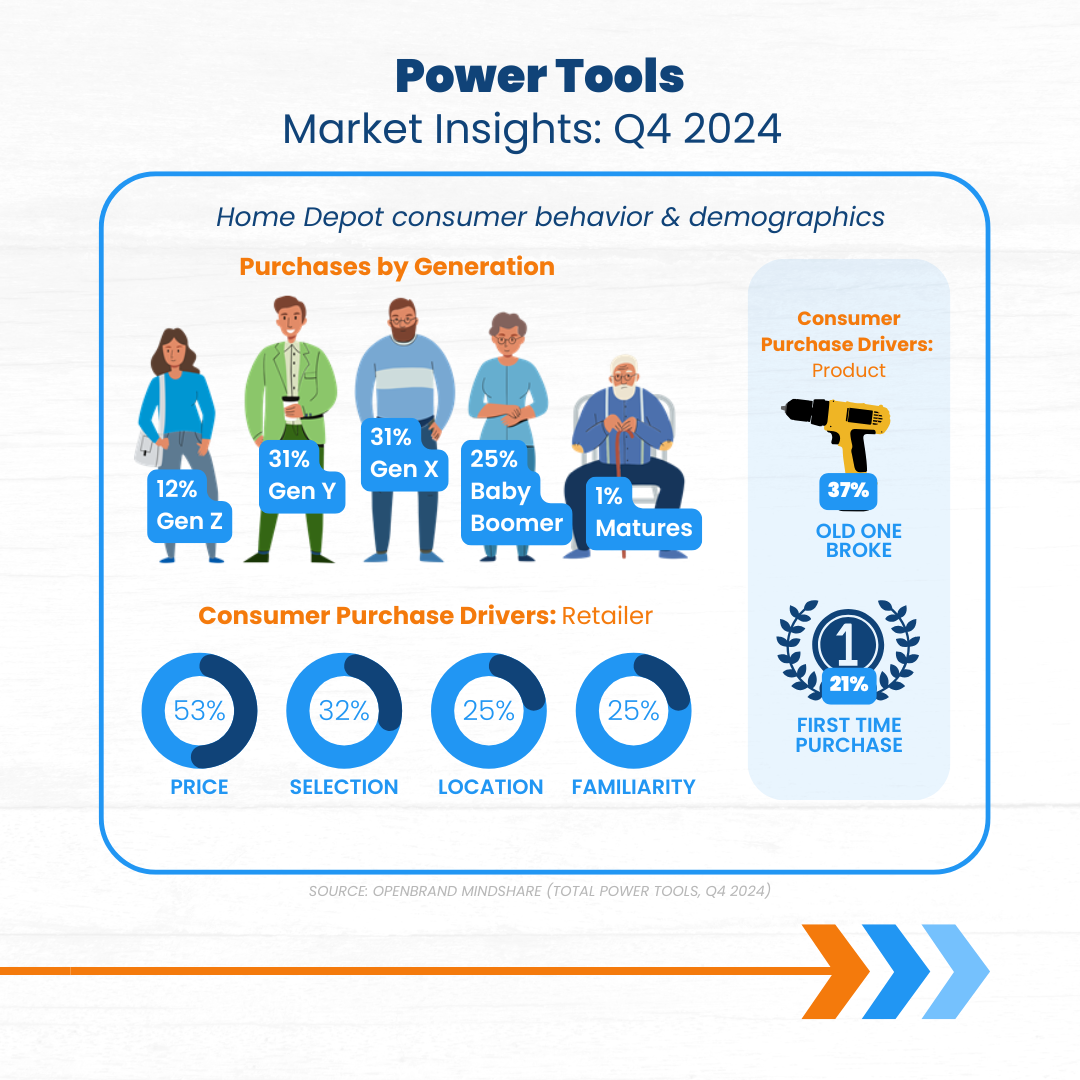
Consumer Insights: When looking at the makeup of Home Depot power tools consumers in Q4 2024 same as OPE, Gen Y and Gen X took the lead, both making up 31% of power tools buyers.
Purchase Drivers: Why did consumers buy power tools at Home Depot?
- 37% replaced a broken tool, 21% were first-time buyers.
- Price, selection, location, and familiarity continue to drive retailer choice.
Lowe’s Earnings Call
Q4 2024 Performance & Lowe's Market Share Trends
SWIPE TO SEE FULL REPORT, CLICK TO EXPAND SLIDES
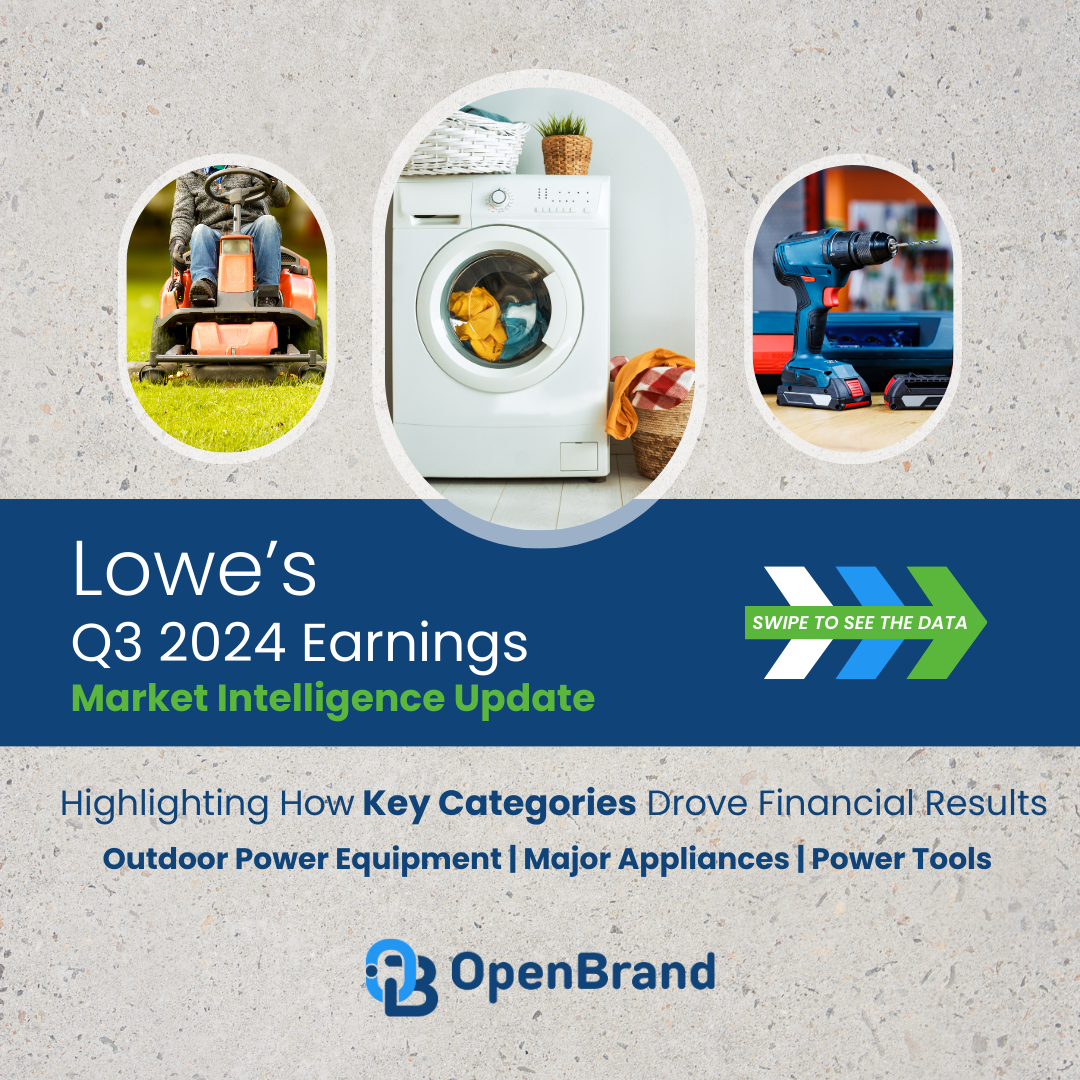


Lowe’s Earnings Call Overview
Lowe’s closed out Q4 2024 reporting $18.6 billion in revenue and a decrease of 0.26% in sales. Despite this decrease, the retailer did see a comp growth of 0.2%.
- Revenue: $18.6 billion
- Sales Growth: -0.26%
- Comps: +0.2%
- Diluted EPS: $1.99
We break down how select durables categories factor into Lowe’s Q4 2024 performance below – including Lowe’s leadership in the major appliance category.
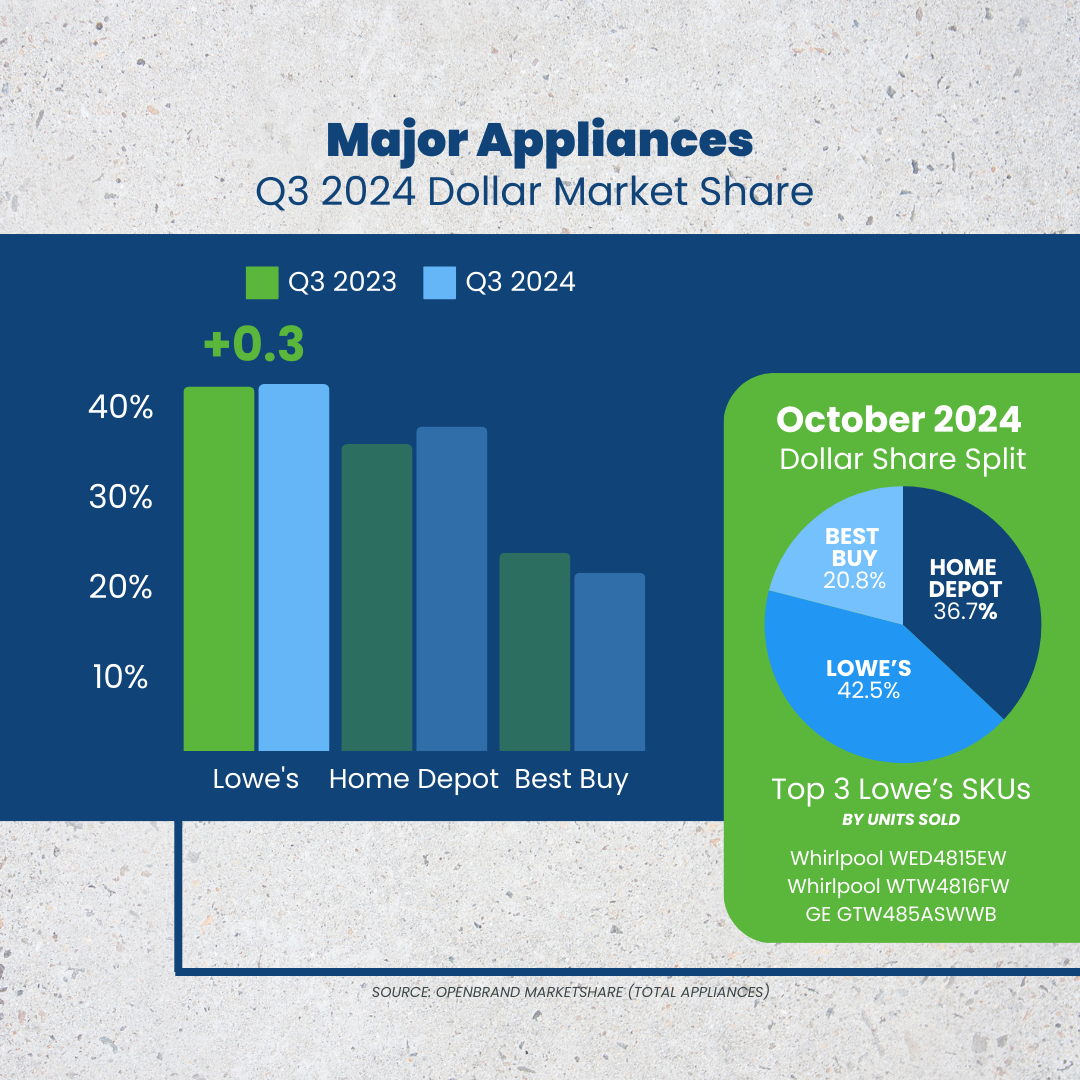
Major Appliance Insights
Market Share: Lowe’s leads the major appliances market with 40.2% share, staying ahead of Home Depot, which holds 36.2%.
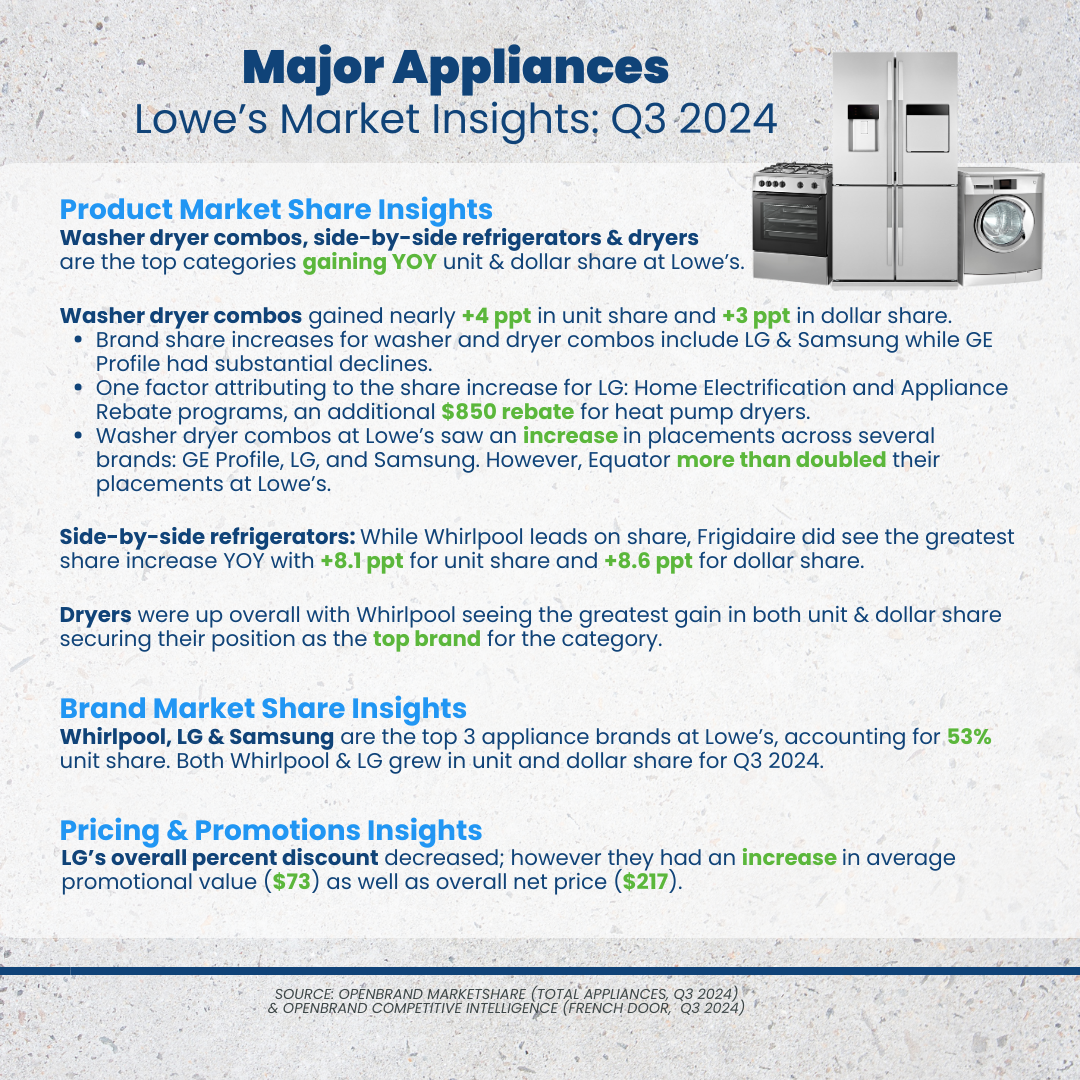
Key Product Categories Driving Share
- Front Load Unitized: Lowe’s saw increases in both units and dollars for FL Unitized by 3.7ppt for each. Lowe’s share growth likely stems from its expanding portfolio, having exclusively offered LG models in Q4 2023.
- Top Load Washers saw a decrease in unit and dollar share. Maytag led overall share and was the top SKU for Top Load Washers.
- Dryers decreased in both unit and dollar share at Lowe’s. Lowe’s saw a notable YoY increase in average price for its dryer assortment in Q4 2024, increasing by around $30 on average.
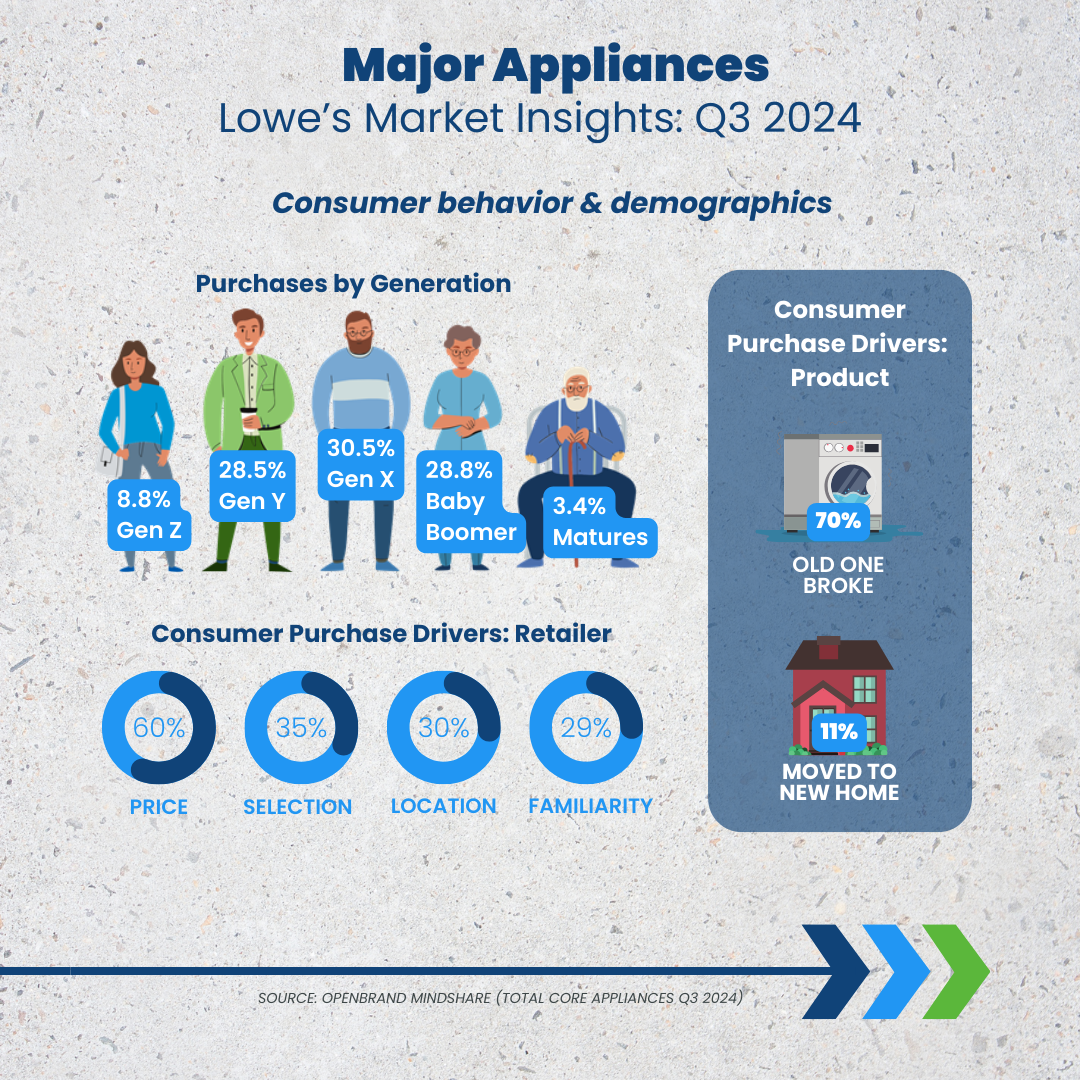
Consumer Insights: When looking at the makeup of Lowe’s major appliance consumers in Q4 2024, Gen X led the split at 32%, with Gen Y and Baby Boomers coming in at 29%. Notably, more Gen X make their purchases at Lowe’s than Home Depot.
Purchase Drivers: Why did consumers buy major appliances at Lowe’s?
- 68% replaced a broken appliance, 11% moved to a new home.
- Price, selection, and location remain key factors in retailer choice.
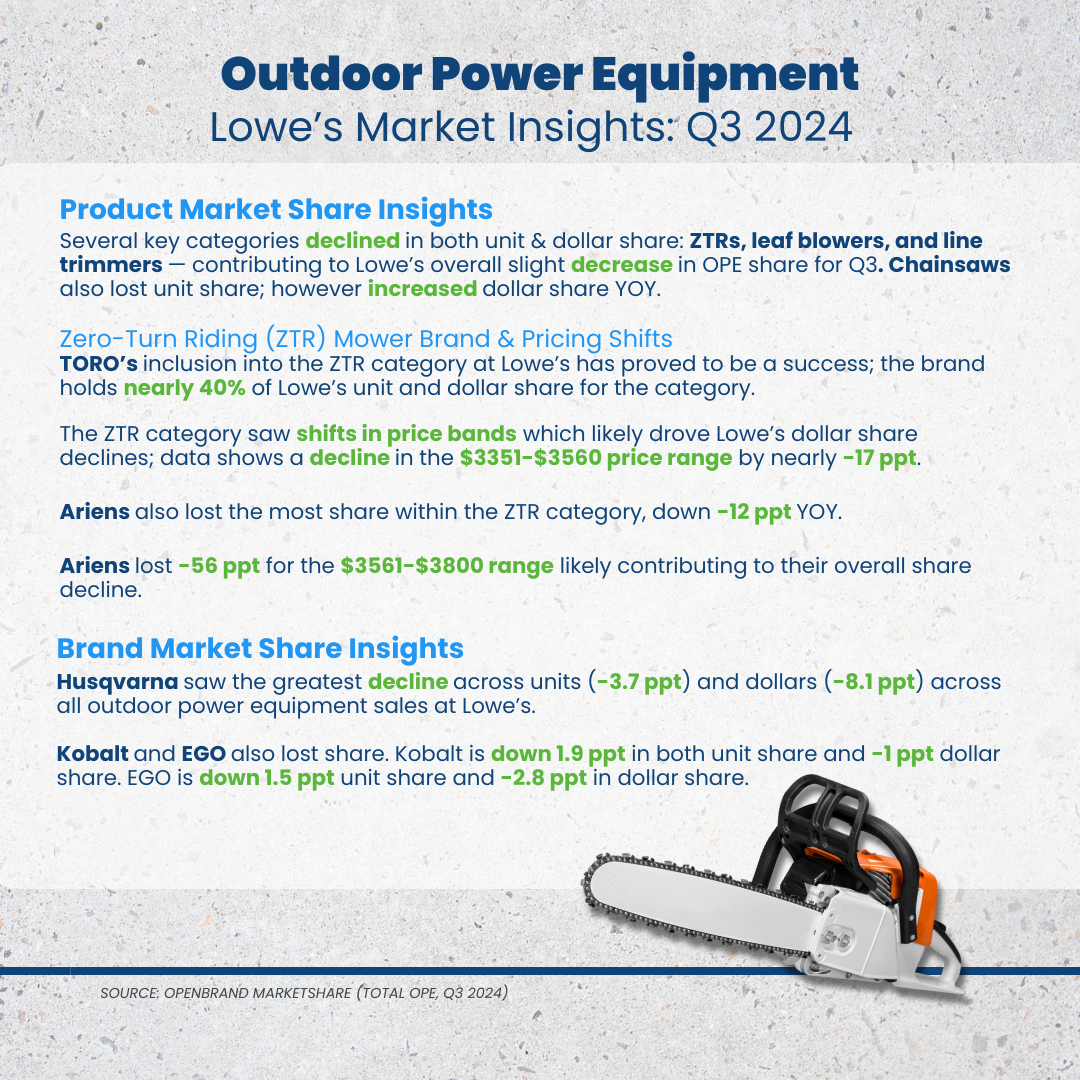
Outdoor Power Equipment (OPE) Insights
Market share: Lowe’s experienced a notable decline in OPE market share in Q4 2024, driven in part by losses in chainsaws and snow removal equipment. Chainsaw unit share dropped 14.5ppts YoY to 30.6%, with dollar share falling 6ppts to 30.5%. Snow removal unit share also fell significantly, declining to 23.5% from 36% YoY.
Key Product Categories Driving Share:
- Chainsaws: EGO gained 7.7ppts in unit share (17% vs. 9.3% YoY), securing the #1 SKU with its 56V 16-inch battery model ($249).
- Snow Removal: EGO increased to 49.5% unit share, while Toro rose to 15.4%. Ariens and Craftsman lost 8.2ppts and 10.3ppts, respectively.
- Gas vs. Electric: Battery-powered chainsaws now 71% of unit share (up from 57% YoY), while corded models dropped to 7% (from 26%).
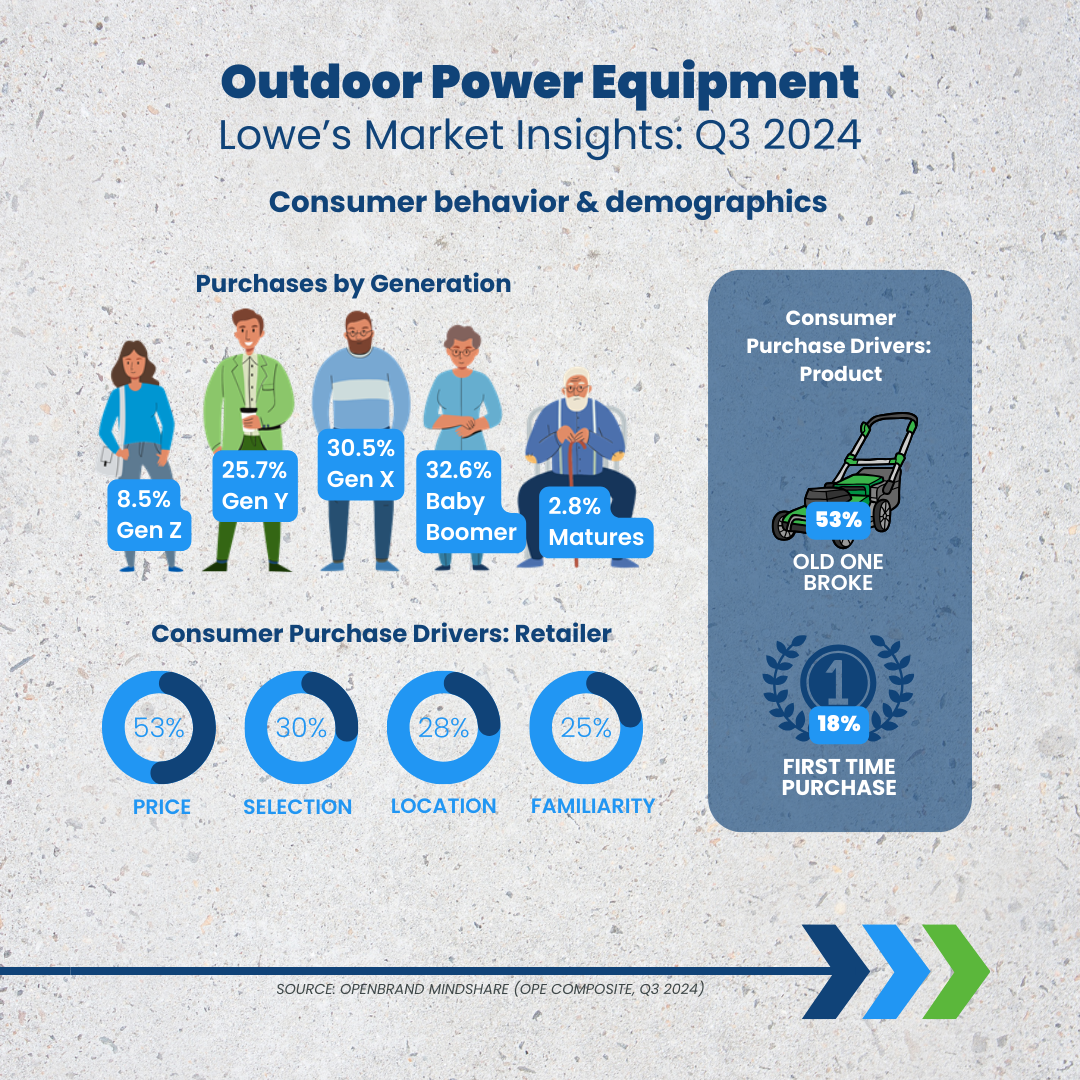
Consumer Insights: When looking at the makeup of Lowe’s OPE consumers in Q4 2024, Gen X also led the split for this category at 33.9%.
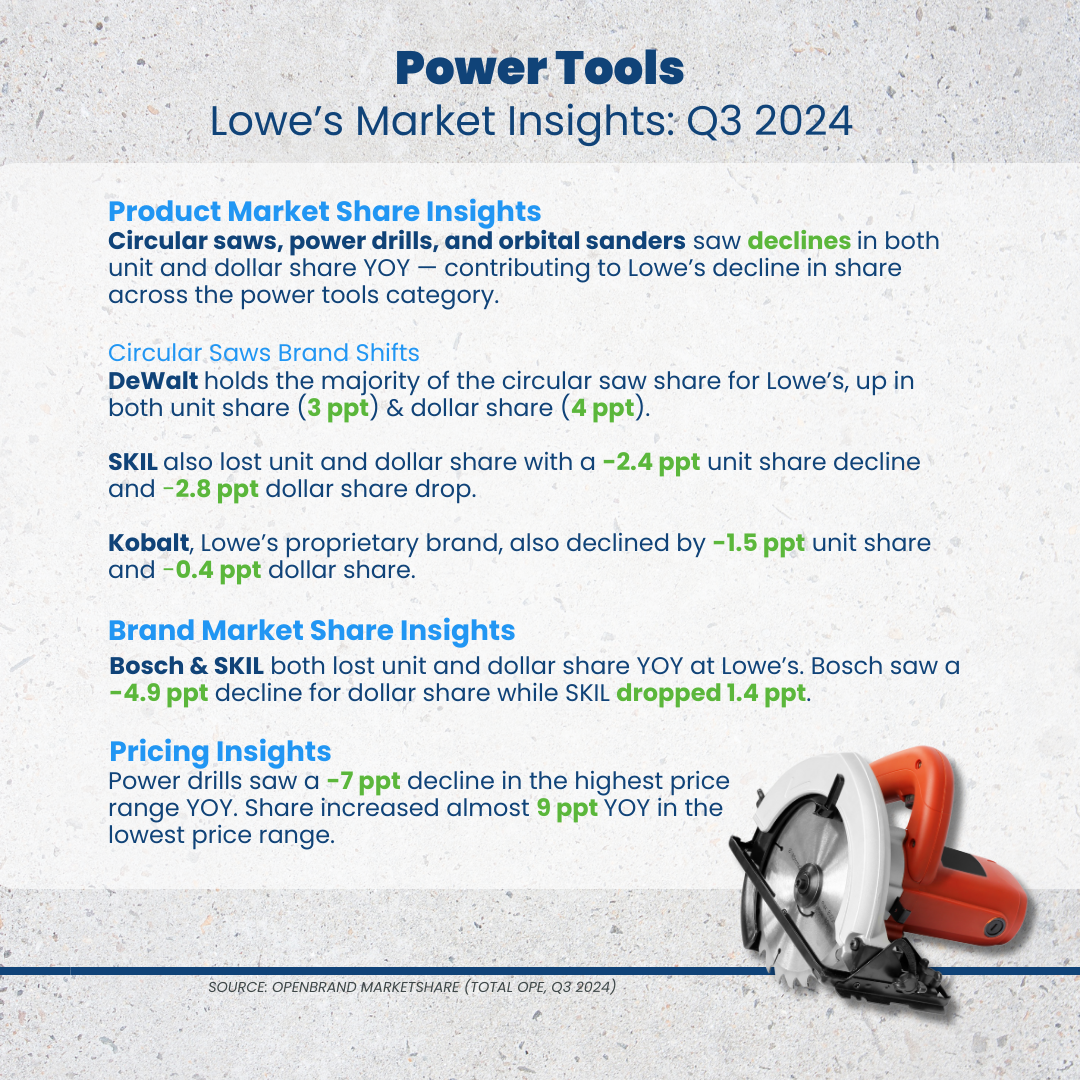
Power Tools Insights
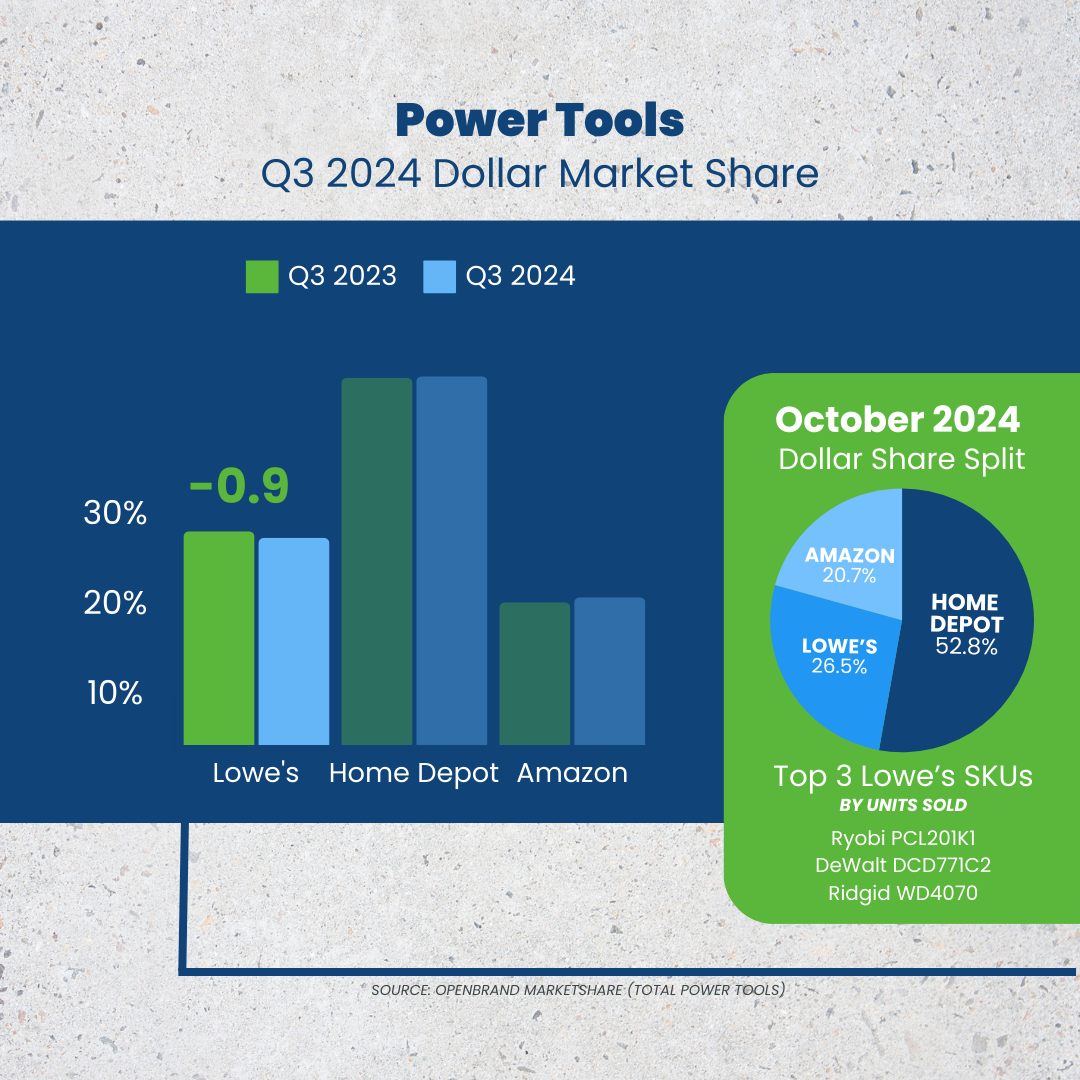
Market Share: Lowe’s comes in as the second leading retailer for power tools dollar share in Q4 2024 at 20.4%. Lowe’s saw an overall decrease in the power tools category, with Orbital Sanders (-23ppts dollar share) and Rotary Tools (-13ppts unit & dollar share) seeing the largest declines.
Key Product Categories Driving Share
- Orbital Sanders: Bosch & Craftsman lost share in both units and dollars. Dewalt gained 11ppts in dollar share, despite a drop in units. Dewalt’s average price for orbital sanders dropped 24% YoY ($145 to $111), signaling a pricing shift.
- Rotary Tools: Dremel remains the unit leader but lost 24ppts in unit share, 28ppts in dollar share. Dewalt leads in dollar share and holds the top selling SKU across the category.
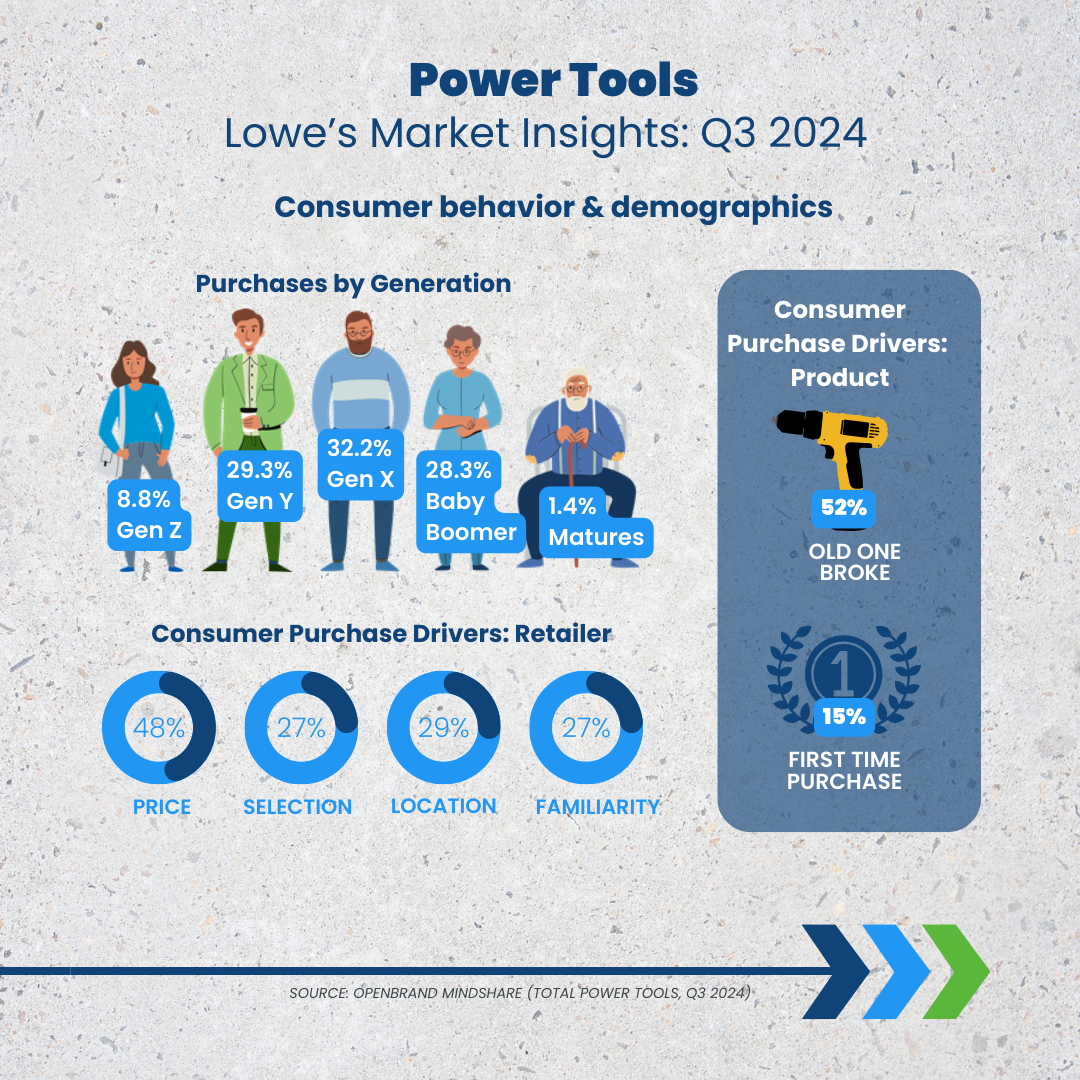
Consumer Insights: When looking at the makeup of Lowe’s power tools consumers in Q4 2024, Gen X once again led the split for this category at 33% — 3ppt higher than the next generation (Millennials at 30%).
Home Depot vs. Lowe’s: Competitive Landscape
Lowe’s and Home Depot continue to battle for dominance in key durables categories, with their Q4 2024 performance highlighting different strengths and vulnerabilities.
Lowe’s maintains its leadership in major appliances, leveraging aggressive discounting to maintain its edge. Home Depot, though trailing in share, drove volume through strategic placements like its Black Friday washer-dryer combo push.
In outdoor power equipment, Home Depot remains dominant, while Lowe’s struggled with sharp declines in chainsaws and snow removal. The rise of battery-powered tools benefited Lowe’s, but not enough to offset broader losses. Home Depot’s exclusive Ryobi lineup kept it ahead, while Lowe’s saw some gains with Toro in snow removal but lost share in key brands like Craftsman and Ariens.
Power tools remain a stronghold for Home Depot, as Lowe’s faces losses across products like orbital sanders and rotary tools. Dewalt’s pricing adjustments at Lowe’s helped boost dollar share, but Home Depot’s exclusive brands and stronger premium positioning kept it in control. Notably, both retailers need to pay attention to Amazon, who holds 19.2% dollar share — putting them only 1.2% behind Lowe’s in retailer dollar share split.
The Q4 results reinforce the distinct strategies of each retailer. Lowe’s continues to rely on pricing and promotions to attract customers, sustaining its appliance leadership but losing ground elsewhere. Home Depot’s focus on exclusive brands and strategic product placements reinforces its advantage in outdoor power equipment and power tools. As battery-powered equipment grows and pricing strategies shift, both retailers will need to refine their competitive playbook.
Get Unmatched Market Intelligence for YOUR Business
Lowe’s and Home Depot’s earnings calls offer a big-picture view of their performance, but the real story lies in how specific product categories, pricing strategies, and consumer behaviors drive those results. Our market intelligence goes beyond the numbers to provide actionable market measurement and competitive intelligence insights that help businesses win.
Want to see the insights available for your brand?
Have a specific data request you’re interested in diving into with our team?
Connect with our team below