


US Small Appliance Market Trends: Brand & Retailer Market Share Insights
Latest Update: June 2026
The small appliance market heading into 2026 is defined by three forces pulling against each other:
- Value-driven purchasing concentrated in the sub-$200 range
- A retail channel split sharply between two dominant players
- A brand hierarchy where unit leadership and dollar leadership no longer tell the same story
Using data from OpenBrand’s latest Small Appliances Total Market Insights report [download now], we analyzed how consumers are shopping the category, where retailers are drawing and closing shoppers, and which brands are converting shelf presence into share.

The small appliance market referenced here covers an aggregate of categories including air fryers, blenders, coffee makers, mixers, and vacuums, reflecting how consumers shop across the small appliance category today.
While the data reflects Q4 2025, the trends below represent the current direction of the small appliance market heading into 2026.
SOURCE: All data insights in this article cover Q4 2025 data within the OpenBrand Total Market Insights Small Appliances category. This includes air fryers, blenders, coffee makers, mixers, and vacuums.
Summary: Small Appliance Market Key Stats
- Walmart is the #1 retailer for small appliances, followed by Amazon
- Ninja is the top small appliance brand by unit share at 33%, and its dollar share climbs to 47%
- Products priced $199 or less account for roughly three-quarters of unit sales
- Replacement demand drives 52% of purchases, with an old product breaking as the leading trigger
- Price and quality remain the top brand purchase drivers
- Millennials (Gen Y) are the largest small appliance buyer segment
- Online accounts for 39% of purchases, and retail competition is concentrated between Walmart and Amazon
Who are the top retailers in the small appliance market?
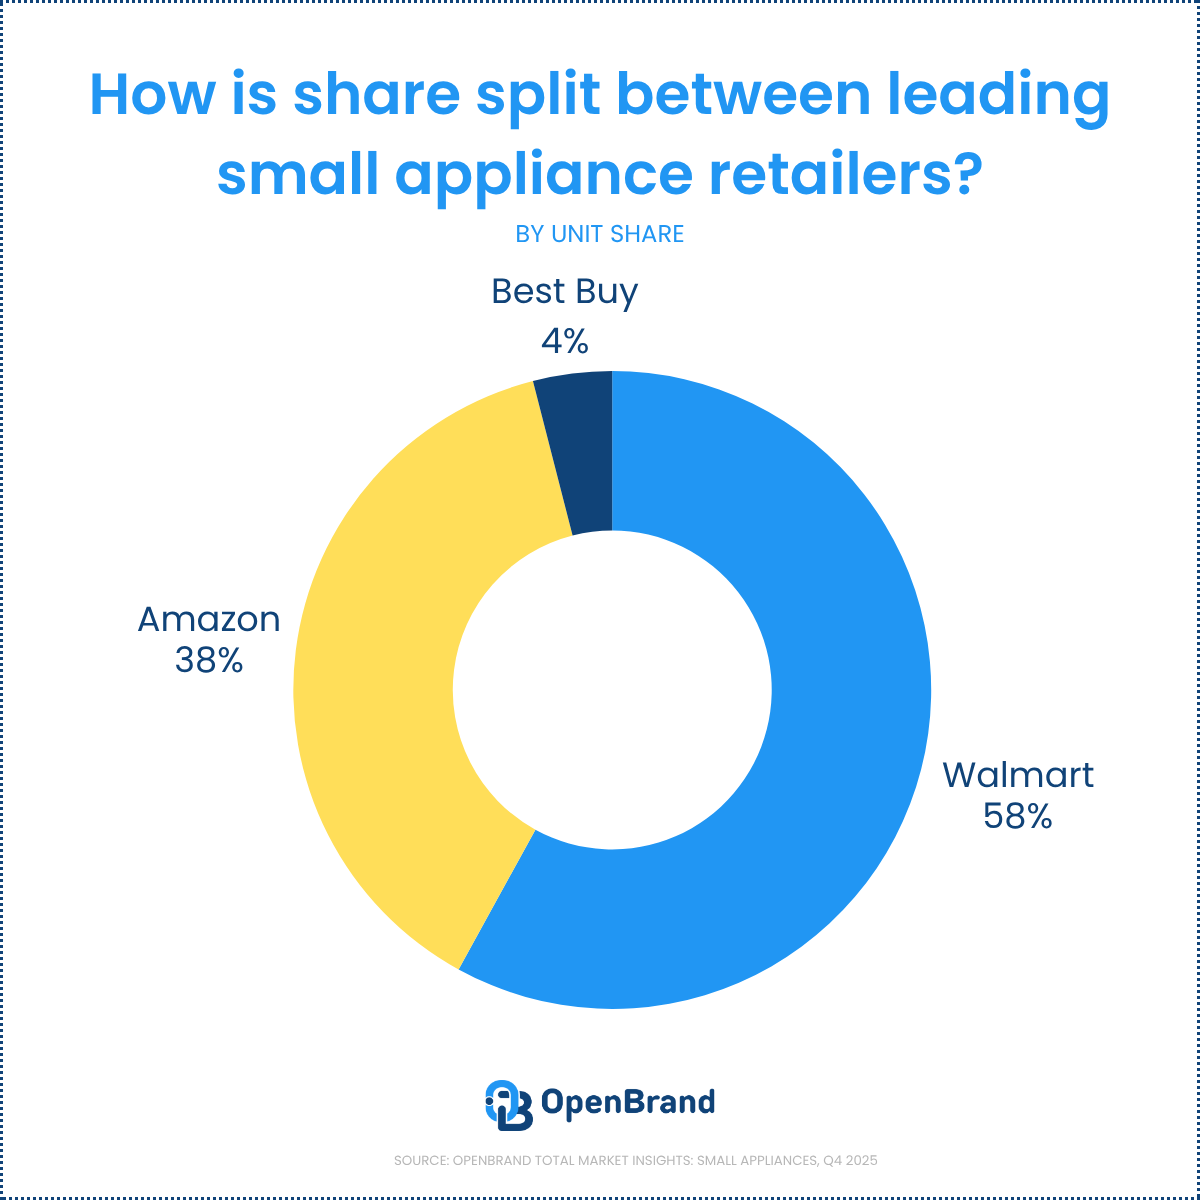
Among OpenBrand’s Q4 2025 small appliance market share panel, Walmart leads the market decisively, and Amazon holds a strong second position.
Q4 2025 Top Retailers in the Small Appliance Market (Unit Share)
| Rank | Small Appliance Retailer | Unit Share (%) |
| 1 | Walmart | 58% |
| 2 | Amazon | 38% |
| 3 | Best Buy | 4% |
At the time of analysis, OpenBrand’s retailer market share data looked across a panel of key retailers, including Walmart, Amazon, and Best Buy. At the time of publication (July 2026) more retailers have been added to our panel, with more coming in Q3 2026. The latest data and additional retailer set is available by subscription. Download the infographic to see all the free market insights or contact us today to see the latest data.
Source: OpenBrand Small Appliances Total Market Insights, Q4 2025
OpenBrand's Small Appliance Trend Insights
The small appliance market is heavily concentrated within retailers like Walmart and Amazon, making shelf placement, pricing, and conversion efficiency the deciding factors for a brand’s unit share. This is exactly the kind of shift OpenBrand’s modeled MarketShare data is built to track across the full category.
For brands, being on the shelf is not the same as winning it. In a channel this consolidated, assortment decisions at major retailers like Walmart and Amazon can make or break a category strategy.
For more small appliance retailer insights, including leakage and conversion trends, download the full infographic.
How are small appliance retailers competing for shopper conversion?
Walmart both draws the most small appliance shoppers and closes them at the highest rate, but Amazon converts high-intent shoppers nearly as efficiently. In a concentrated channel, the ability to close a shopper who is already in the aisle matters more than raw traffic.
Q4 2025 Small Appliance Retailer Draw & Close Rates
| Small Appliance Retailer | Draw Rate | Close Rate |
| Walmart | 50% | 75% |
| Amazon | 31% | 70% |
| Target | 21% | 50% |
| Best Buy | 7% | 55% |
| Home Depot | 6% | 46% |
Source: OpenBrand Small Appliances Total Market Insights, Q4 2025
Walmart leads in both drawing and converting shoppers, while Amazon stays close on close rate. Smaller players like Best Buy, Target, and Home Depot have a limited draw, but convert roughly half of the shoppers they attract.
OpenBrand's Small Appliance Trend Insights
Consumers shopping for small appliances compare price, quality, features, and retailer experience before buying. Traffic alone does not win the category. Retailers that convert efficiently, and reduce the number of shoppers who walk without buying, are better positioned to hold share.
Who wins when a retailer loses a shopper?
When Walmart fails to close a small appliance shopper, Amazon captures the largest share of those lost shoppers, followed closely by Target. OpenBrand’s proprietary retail draw, close, and leakage analysis shows a 25% walk rate for Walmart shoppers, and it reveals exactly where that demand goes.
Where Walmart's Lost Small Appliance Shoppers Go (Leakage)
| Retailer Capturing Lost Shoppers | Share of Leaked Shoppers |
| Amazon | 33% |
| Target | 29% |
| Best Buy | 8% |
| Home Depot | 4% |
Source: OpenBrand Small Appliances Total Market Insights, Q4 2025
OpenBrand's Small Appliance Trend Insights
Consumers rarely commit to a single retailer before buying a small appliance. This behavior makes final-stage conversion and shopper retention central to protecting market share, especially for the two retailers absorbing the bulk of leaked demand.
Which brands lead small appliance market share?
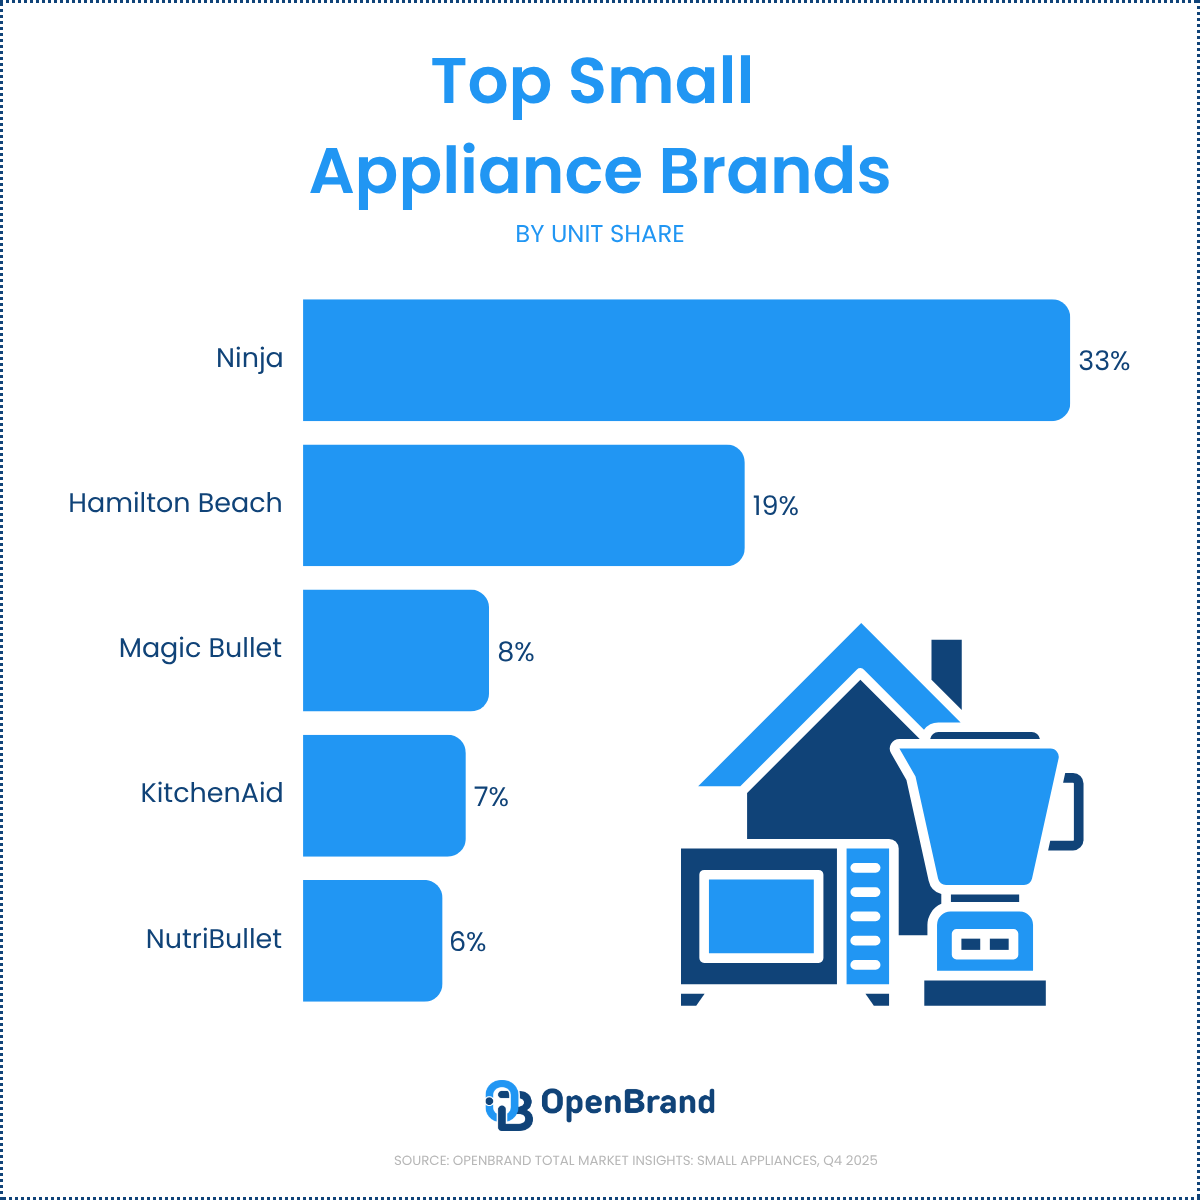
According to OpenBrand’s MarketShare data, Ninja leads the small appliance market on both unit and dollar share, and the gap between the two tells the real story. Ninja converts a 33% unit share into a 47% dollar share, while Hamilton Beach wins volume at value pricing but trails sharply in revenue.
Q4 2025 Top Small Appliance Brands by Market Share
| Rank | Small Appliance Brand | Unit Share |
| 1 | Ninja | 33% |
| 2 | Hamilton Beach | 19% |
| 3 | Magic Bullet | 8% |
| 4 | KitchenAid | 7% |
| 5 | NutriBullet | 6% |
Source: OpenBrand Small Appliances Total Market Insights, Q4 2025
At the SKU level, the highest-share individual products skew to value pricing. Hamilton Beach’s model 50180 leads with a 4.0% unit share at a $26 average price, followed by the Ninja BE200 at 3.7% and a $50 average price.
For more small appliance brand insights, including share of shelf and product launch trends, download the full infographic.
OpenBrand's Small Appliance Trend Insights
Ninja’s dominance reflects a brand that has translated feature-forward positioning into premium pricing power. Winning nearly half of category dollars on a third of the units is the clearest signal in the data.
Hamilton Beach plays the opposite game, converting a strong 19% unit share into just 9% of dollars by anchoring the value tier. NutriBullet is the only top-five brand whose dollar share exceeds its unit share, a sign of favorable mix.
What is driving small appliance purchases?
Replacement demand is the leading reason consumers make small appliance purchases, with 52% of purchases triggered by an old product breaking. Once shopping, price is the top brand purchase driver, followed by quality.
Beyond brand attributes, the strongest product trigger is a broken predecessor at 52%, while first-time purchases account for 13% of demand.
Q4 2025 Top Purchase Drivers for Small Appliance Brands
| Brand Driver | Share |
| Price | 43% |
| Quality | 34% |
| Features | 30% |
| Name Brand | 27% |
Source: OpenBrand Small Appliances Total Market Insights, Q4 2025
OpenBrand's Small Appliance Trend Insights
Because the category is so heavily replacement-driven, consumers arrive with practical intent and a clear reference point: the product that just failed. That raises the importance of competitive pricing, trusted quality, and easy availability at the two retailers that dominate the channel.
Brands that communicate durability and value are best positioned to capture a shopper who is already motivated to buy.
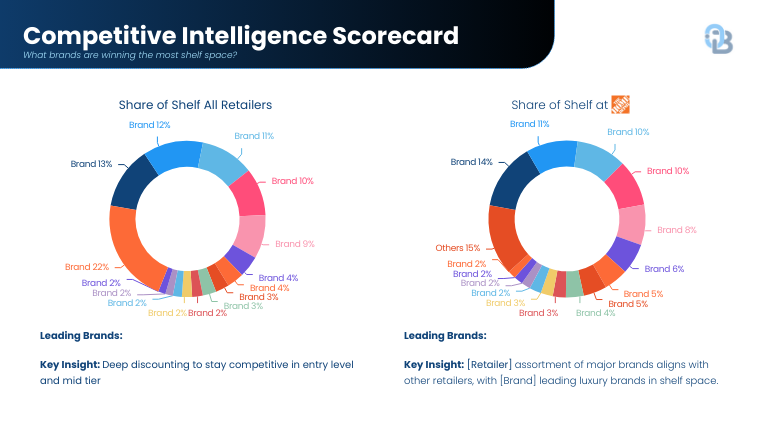
How is small appliance product strategy diverging across brands?
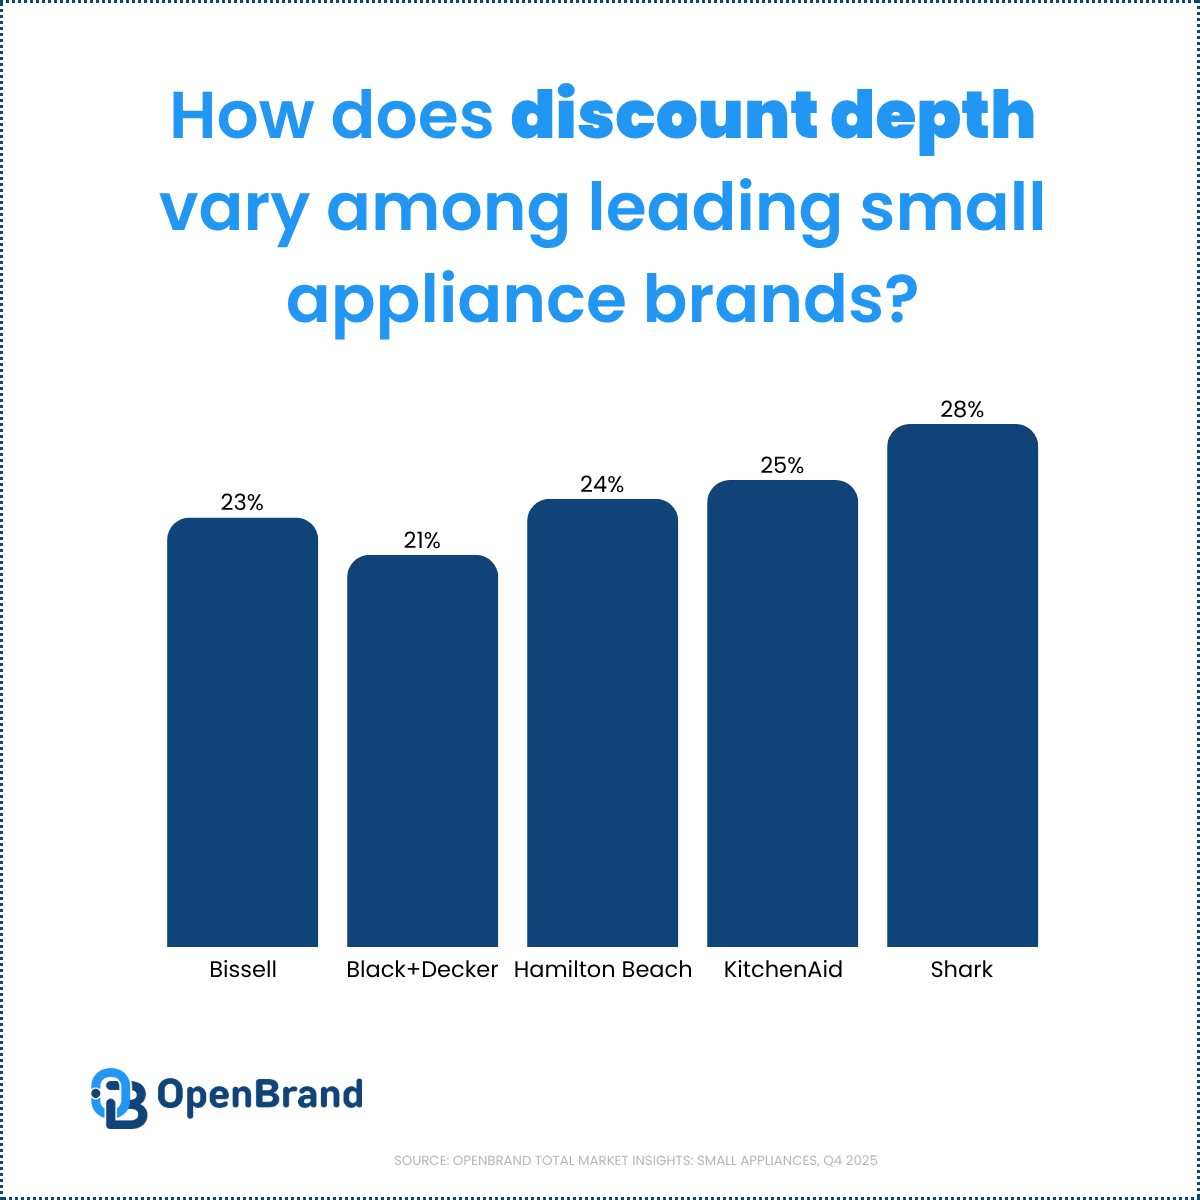
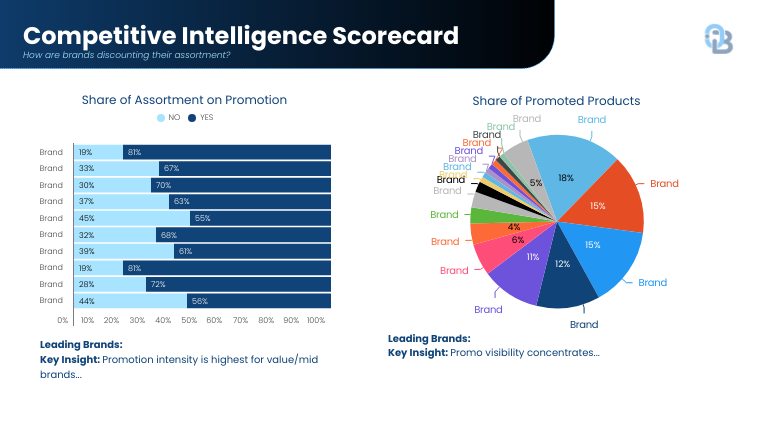
OpenBrand’s competitive intelligence data tracked 6,591 total category placements across retailers in Q4 2025. Among these placements, the data shows brands are splitting into two strategies: protecting margin through premium pricing, or driving visibility through aggressive promotion and product launches.
On share of shelf, Shark leads at 7%, followed by Hamilton Beach at 6%, with the rest of the field fragmented across dozens of brands each holding low single digits.
Brand Strategy Signals in Small Appliances (Q4 2025)
| Brand | Share of Shelf | Discount Depth |
| Hamilton Beach | 6% | 24% |
| KitchenAid | 4% | 25% |
| Shark | 7% | 28% |
| Bissell | 4% | 23% |
| Black+Decker | 4% | 21% |
Source: OpenBrand Small Appliances Total Market Insights, Q4 2025
OpenBrand's Small Appliance Trend Insights
Hamilton Beach and KitchenAid are the most active on new product debuts, together accounting for nearly three-quarters of launches among the tracked brands.
Notably, despite its market share leading position, Ninja fell below the top five brands with the highest share of shelf, staying disciplined on discounting while continuing to introduce products.
The takeaway for category managers: shelf presence is fragmented, so a brand’s assortment and launch cadence matter as much as headline market share. For teams heading into a product line review, that fragmentation is where assortment decisions are won or lost.
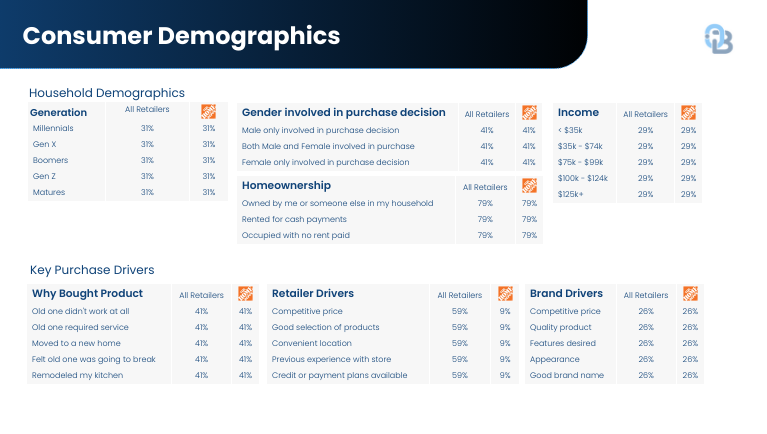
Who is buying small appliances?
Younger and middle-aged consumers drive the small appliance market, with Gen Y and Gen X together accounting for more than half of purchases. OpenBrand’s census-balanced data provides a snapshot of who is shopping the category today.
Q4 2025 Small Appliance Purchases by Generation
| Generation | Q4 2025 Unit Share |
| Gen Z (born after 1996) | 20% |
| Millennials (born 1981–1996) | 33% |
| Gen X (born 1965–1980) | 28% |
| Baby Boomers (born 1946–1964) | 18% |
| Matures (born before 1946) | 1% |
Source: OpenBrand Small Appliances Total Market Insights, Q4 2025
OpenBrand's Small Appliance Trend Insights
Small appliance demand is more evenly distributed across generations than most durables categories, with Gen Y, Gen X, and Baby Boomers each holding roughly a quarter of purchases. That breadth reflects how essential these products are across every household stage, from first-time buyers to replacement shoppers refreshing a vacuum or floor care product.
As Gen Z grows its share, brands and retailers will keep adapting toward digitally informed, price-sensitive shopping behavior, reinforcing the value orientation already visible in the pricing data.
What this means for the small appliance market
Small Appliances in 2026
The latest small appliance market data points to a category with steady, replacement-led demand and intense competition on execution.
Several trends are shaping the market at once:
- Demand is concentrated in value-oriented price tiers below $200
- Retail share is heavily led by Walmart and Amazon, making conversion and leakage decisive
- Brand leadership splits between volume players and premium players, with Ninja capturing outsized dollar share
- Product launches and shelf strategy are the levers brands are pulling to gain visibility
- Younger buyers are steadily reshaping the long-term direction of the category
Together, these forces define the current direction of the small appliance market and where the greatest opportunities for growth may exist moving forward.
Want the Full Small Appliance Market Report?
The trends highlighted here represent only a portion of the latest small appliance market data available through OpenBrand.
Download the full infographic to explore deeper insights into:
- small appliance market share
- top brands and rankings
- retailer performance and leakage
- pricing and promotions
- product launches and SKU trends
- consumer shopping behavior
Access the Small Appliance Total Market Insights Infographic
Get the complete Q4 2025 picture: brand and retailer share, draw and close rates, price-band breakdowns, SKU winners, share of shelf, discount depth, and product debuts in one view.
Want the data for a specific category, brand, or retailer? Contact us today!
FAQ: Small Appliance Market Trends
Which brand has the largest small appliance market share?
According to OpenBrand’s Q4 2025 data, Ninja leads the small appliance market with a 33% unit share and a 47% dollar share, well ahead of Hamilton Beach in second.
Which retailer has the largest small appliance market share?
According to OpenBrand’s modeled MarketShare data, Walmart leads small appliance retailer unit share at 58%, followed by Amazon at 38% and Best Buy at 4%.
What price range dominates the small appliance market?
According to OpenBrand’s Q4 2025 data, products priced $199 or less account for roughly three-quarters of unit sales, confirming a value-driven category.
What is driving small appliance purchases?
According to OpenBrand’s MindShare consumer survey data, replacement demand is the leading trigger, with 52% of purchases prompted by an old product breaking. Price and quality are the top brand purchase drivers.
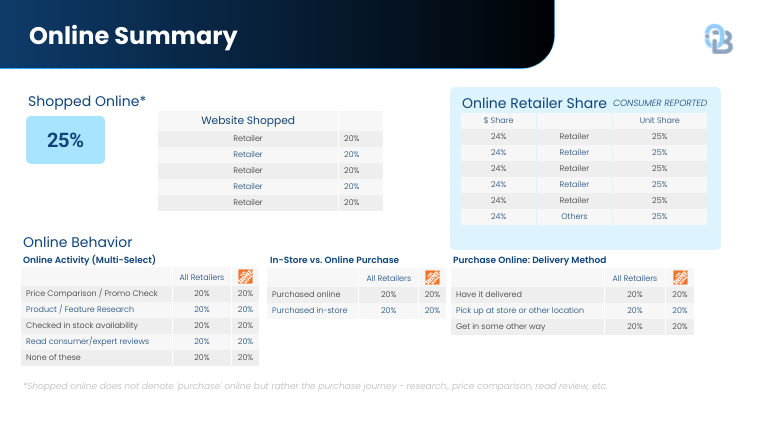
Where do consumers buy small appliances?
According to OpenBrand’s Q4 2025 data, 39% of small appliance purchases happen online, and the channel is concentrated between Walmart and Amazon.

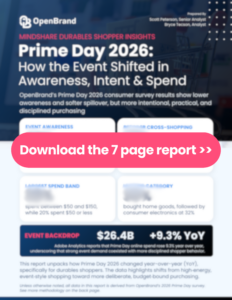
Prime Day 2026 Shopper Survey: Key Signals for Durables Brands and Retailers
Prime Day 2026 still drove strong shopper participation, but OpenBrand’s latest survey shows a more disciplined, value-focused consumer taking shape beneath the headline sales numbers.
 Prime Day 2026 landed as a major mid-year checkpoint for retail, but it didn’t behave like a simple deal frenzy. The event stretched across four days in late June, overlapped with other summer promotions, and still drove strong ecommerce volume, yet the more interesting story is how unevenly that momentum showed up across categories, retailers, and shopper behavior.
OpenBrand’s Prime Day 2026 Shopper Survey Report digs into that behavior, focusing on how durable goods shoppers discovered, evaluated, and purchased during the event. Rather than rehashing headline sales numbers, the report shows where engagement softened, where intent stayed strong, and how those patterns point to a more disciplined, value-focused consumer heading into the back half of the year.
Fast facts
| Prime Day 2026 shopper signal | What the survey suggests |
| Awareness | Shopper awareness declined versus 2025 |
| Cross-shopping | Spillover beyond Amazon remained meaningful, but softened year over year |
| Conversion | Shoppers who visited rival retailers often arrived with stronger intent to buy |
| Spend mix | Spending skewed toward lower price bands and practical categories |
| Strategic takeaway | Prime Day ended up being a more deliberate shopping event than years past |
Inside the shopper read
At a high level, the survey shows that Prime Day 2026 still worked, but it worked differently than in 2025. Awareness slipped, cross-shopping at rival retailers was less intense, and spending clustered in lower price bands.
At the same time, shoppers who did engage often arrived with clear purchase plans and followed through at high rates.
Here are a few themes that stood out in our report:
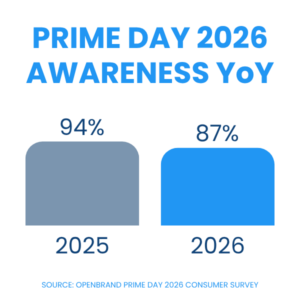 Engagement was broad but less explosive. Most Prime Day shoppers (87%) recall seeing advertising. However, this number is down 7 percentage points (ppts) from 2025, pointing to an event that reached the market with a bit less built-in momentum.
- Spillover was more selective. Prime Day continued to drive traffic to Walmart, Target, Costco, and others, but cross-shopping rates were lower year over year, suggesting that fewer shoppers were casually browsing across multiple retailers. Walmart saw the highest spillover, drawing in 27% of shoppers.
 Intent was high once shoppers engaged. Among those who did visit competing retailers, conversion rates remained notably strong – Costco saw a 100% cross-shopping conversion rate – indicating that cross-shopping was often tied to specific missions rather than window shopping.
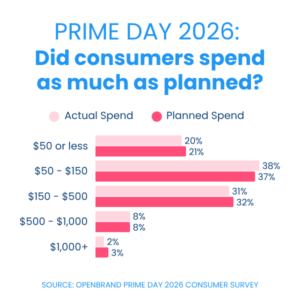
 - Spend skewed toward disciplined baskets. The distribution of spend leaned into lower price bands (with 58% spending $150 or less) and practical categories, reinforcing a more budgeted, value-driven mindset.
The full report provides even more insights into how Prime Day shifted this year, including where shoppers over-delivered versus their pre-event intentions, and where interest failed to convert.
Download the full Prime Day 2026 shopper report to see the detailed charts on awareness, retailer cross-shopping, spend distribution, and category mix, along with OpenBrand’s forward-looking takeaways for Q3 and holiday planning.
What this means for brands and retailers
Prime Day 2026 did not fail to drive demand, but it did reveal a more disciplined shopper. Awareness fell to 87% from 94% in 2025, cross‑shopping softened across rival retailers, and spend concentrated in lower bands, with 58% of shoppers spending $150 or less. Even so, shoppers who engaged converted with purpose, suggesting that demand was still there, just more selective and less event-driven.
For brands and retailers, that raises the bar for Q3 and holiday planning. Broad promotional volume is less likely to break through when only 29% of shoppers said deals exceeded expectations, while 62% said deals simply met them. The better strategy is sharper execution around high-intent moments: stronger category positioning, more relevant offers, and value that feels practical, timely, and easy to act on.
In durables especially, Prime Day points to a market where winning means capturing planned demand, not just generating noise. In electronics, 58% of buyers said they planned their purchase before seeing Prime Day deals, versus 35% who decided after the promotion, while cross‑shopping conversions remained high at Costco, Target, Walmart, and Home Depot. In a more deliberate consumer environment, the advantage goes to brands and retailers that make the path to purchase feel more credible and more relevant, not simply more promotional.
Download the full Prime Day 2026 Shopper Report
Want the full picture behind Prime Day 2026? Get the complete report for deeper insight into shopper awareness, cross-shopping behavior, conversion patterns, spend mix, and category-level trends, plus forward-looking implications for brands and retailers planning for Q3 and holiday.
Complete the form below to access the report.
More Prime Day analysis from OpenBrand
This shopper report is one part of a broader Prime Day 2026 coverage set. For a fuller view of the event, from pricing mechanics to retailer strategy, explore these related pieces:
- Prime Day 2026: Pricing and Promotions Insights — A category-by-category look at how retailers approached discount depth, assortment visibility, and promotional intensity across the event.
- What Prime Day Data Reveals About Consumer Behavior and Retailer Strategy — A broader strategic read on what Prime Day signals about shopper behavior, retail timing, and the evolving role of large promotional events.
Taken together, these pieces offer complementary views of Prime Day 2026: shopper-level insight into behavior and intent, plus market-level visibility into pricing, promotions, and retailer execution.
Conclusion
Prime Day 2026 showed that strong event volume and cautious consumer behavior can exist at the same time. Shoppers stayed engaged, but they behaved more deliberately, with lower awareness, tighter budgets, and clearer purchase intent.
For brands and retailers, that is the clearest signal heading into Q3 and holiday: winning the next promotional moment will depend less on participating loudly and more on showing up with focused value, relevant assortments, and offers built for consumers who are planning carefully before they buy.
If you’re looking to get ahead of the next big promotional window with real-time consumer and pricing insights, contact us today to see how we can help.
Want to prepare for the next key promotional window?
OpenBrand tracks pricing, promotions, and market share across durable goods categories in real time, so you head into each promo window knowing which brands discount deepest, how retailers sequence their deals, and where assortment gaps open up. The same data behind these eleven Prime Day reports feeds line review prep, competitive intelligence, and promotional planning for brands and retailers.
Contact us today to see what OpenBrand’s data can tell you about your categories before the next promo window.
What Prime Day 2026 Told Retailers and Brands: A Category-by-Category Read from OpenBrand's Analysts
Prime Day is no longer a two-day Amazon event that the rest of retail watches from the sidelines.
In 2026 it ran four days (June 23-26), pulling Walmart, Target, Best Buy, and Costco into the same promotional window.
According to Adobe Analytics, US online retail spend reached $26.4 billion during the event, a 9.3% increase year over year. The earlier late-June timing clustered Prime Day with Memorial Day, back-to-school, the FIFA World Cup, and Fourth of July shopping, concentrating consumer spend into a single mid-year surge. The deals matter less than the patterns underneath them.
OpenBrand’s category analysts tracked Prime Day 2026 across nine US product lines and two Canadian ones, from notebooks and TVs to floor care, mowers, wearables, and headphones.
This wrap-up pulls their reports into one place so you can see where discounting deepened, where retailers held back, and what each category signals heading into the back half of the year.
For the macro and consumer-behavior side of the same event, why shoppers outspent their own expectations and what June promotions meant for durables inflation, see our companion read, What Prime Day Data Reveals About Consumer Behavior and Retailer Strategy.
In This Wrap-Up
- The Prime Day 2026 Takeaways That Matter Most
- US Categories: What the Analysts Saw
- Notebooks
- Desktops
- Televisions
- Smartphones
- Tablets & Detachables
- Headphones
- Floor Care
- Mowers / OPE
- Wearables
- Canada Categories: What the Analysts Saw
- Canada Notebooks
- Canada Desktops
- What Prime Day 2026 Means Moving Forward
- What to Watch for the Next Big Promo Window
- How OpenBrand Helps Track Real-Time Movement During Promotional Windows
The Prime Day 2026 Takeaways That Matter Most
Across eleven category reports in two countries, three patterns showed up again and again: retailers widened their assortments instead of deepening discounts, competition spread well beyond Amazon, and category-level behavior diverged enough that a single “Prime Day discount number” tells you almost nothing.
- Retailers competed on breadth, not depth. In TVs, Amazon more than doubled its promoted assortment to 232 unique deals while its average discount held flat at 23%. Tablets deal counts rose 13% to 95 while average discount fell 4 percentage points to 29%. According to OpenBrand’s pricing and promotions data, the 2026 story was more items at steadier markdowns, not deeper cuts.
- The competitive set now runs well past Amazon. In TVs, Best Buy led on both depth and dollars at 27% off and $553 in average savings, ahead of Amazon’s 23% and $339. In floor care, Best Buy delivered the deepest dollar savings of the event at $194. According to OpenBrand, Amazon set the calendar, but rivals set the ceiling on value.
- Categories diverged sharply. Floor washers and iRobot robotics ran 37% and 50% off while smartphone discounts fell 3 points to 23% and smartwatch depth slipped to 23.1%. According to OpenBrand, blanket “Prime Day was up or down” framing hides the categories that actually moved.
- Brand behavior split between clearance and discipline. Google (26% avg, Pixel 10 up to 35% off) and Samsung (Z Flip7 FE near 44% off) drove smartphone depth, and Apple ran Watch Series 9 clearance up to 45% off. Meanwhile Samsung held TV discounts to 18% and its Watch 8 lineup to roughly 28%. According to OpenBrand, the same brand often ran clearance in one category and discipline in another.
OpenBrand’s Takeaway: Read Prime Day 2026 as a strategy signal, not a sale. The merchants and brands that won did it through assortment breadth, selective premium promotions, and precise brand-level targeting, which is exactly the behavior category managers should be pressure-testing before the fall promo run.
US Categories: What the Analysts Saw
OpenBrand covered Prime Day 2026 across various durables product lines. Below is a short excerpt from the nine of analyst’s full reports, leading with the snapshot headline and relevant key findings. For the full read on what our analysts say during Prime Day 2026, contact us today.
Desktops
Snapshot: Brands Lean Into Gaming for Amazon Prime Day Discounts
Desktop promotions were thin and heavily gaming-led. Amazon’s average discount fell to 13%, down from 17% and the lowest among tracked retailers, while Costco and Walmart tied at 17% on the strength of gaming systems. OpenBrand captured 39 unique desktop deals, and gaming rigs accounted for more than 70% of them. Here’s a breakdown of the lowest priced deals on gaming desktops during Prime Day 2026.
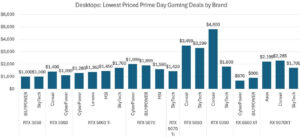
Among brands, HP led at a 21% average discount, Dell dropped 5 points to 15%, and system integrator iBuyPower climbed 5 points to 20%. The picture is a category leaning on gaming hardware to carry its Prime Day presence while mainstream desktop discounting stays muted.
Analysis by Avery Bissett, Desktops Analyst, OpenBrand
Floor Care
Snapshot: Best Buy Delivers the Deepest Dollar Savings During Prime Day
Best Buy delivered the deepest dollar savings of the event at $194, while the category’s overall average discount held flat at 29%. Beneath that flat headline, the mix moved: floor care ran 32% off, floor washers led at 37%, and robotics eased 5 points to 33%.
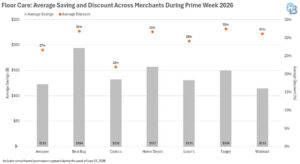
Brand behavior split between clearance and restraint. iRobot ran the deepest at 50%, headlined by the Roomba 105X at 57% off to $199, and Narwal (43%) and Roborock (40%) followed close behind, while Dreame pulled back 13 points to 26%. The signal is a category using aggressive robotics and floor-washer promotions to drive traffic while holding the overall line steady.
Analysis by Jordan Carter, Vacuums Analyst, OpenBrand
Headphones
Snapshot: Retailers Compete With Amazon’s June Prime Day Headphone Promos
Costco held the highest average promotion value at $84 off during its Member Appreciation Days, driven by a limited lineup led by Bose’s Ultra Open Earbuds at 33% off. Best Buy was second at $56, with standout offers including 47% off Dyson’s OnTrac ($236 off) and 50% off Sony’s WH-1000XM5 ($200 off). Target averaged $53, while Amazon ran the lowest average at $32 and Walmart sat at $45.
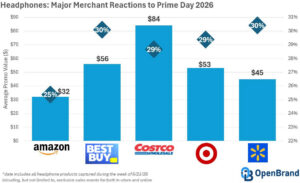
On Amazon itself, unique headphone deals rose 60% versus last July, and average promotion value edged up 1% to $61 even as the average discount fell 6 points to 33%. Wireless headbands made up 52% of deals and the $200-and-above tier accounted for 37%. The deepest cut was 62% off the JBL Live 670NC ($80 off to $49), and the largest dollar savings was $202 off Sony’s WH-1000XM5. Apple participated officially for the first time, with a single AirPods Max 2 promotion at 27% off.
Analysis by Nick Harpster, Headphones Analyst, OpenBrand
Mowers / OPE
Snapshot: Prime Day Instant Savings Put Meaningful Focus on OPE
Outdoor power equipment earned real Prime Day attention through Instant Savings. Robotic mowers made up 36% of the promoted assortment and leaf blowers 33%, with 32% of walk-behind mowers and 34% of robotic mowers carrying Instant Savings. Cordless equipment ran noticeably deeper than gas, at 26% off versus 15%.

Walmart was the most aggressive retailer, discounting 46% of walk-behind and 53% of robotic mowers. On the brand side, Greenworks was the most promoted at 42% of its lineup, while STIHL, Craftsman, and Yardmax sat out the event entirely. The split points to a category where cordless and robotic lines are becoming the promotional centerpiece.
Analysis by Adrienne Spear, Mowers Analyst, OpenBrand
Notebooks
Snapshot: How Did Notebook Retailers Respond to Prime Day?
Notebook discounting stayed shallow and selective. Amazon slipped 3 percentage points to a 15% average discount and trailed its rivals, while Walmart led all retailers at 27%. The overall average discount landed at 22%, up 1 point year over year. Chromebooks were the exception, with several models running more than 40% off.
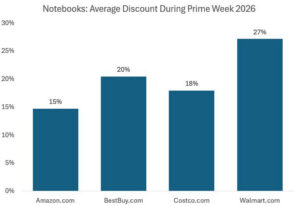
At the brand level, Microsoft posted the highest average discount at 38%, driven by a single Surface deal, while HP was the most aggressive Windows OEM at 27%. Dell climbed 6 points to 25% and Acer eased 3 points to 18%. Gaming made up roughly 35% of all notebook offers, a sign of how much of the category’s promotional energy has shifted toward higher-ticket configurations.
Analysis by Avery Bissett, Notebooks Analyst, OpenBrand
Smartphones
Snapshot: Deals of Amazon Prime Day 2026, YoY Look
Smartphone discounting pulled back to a 23% overall average, down 3 points year over year. Walmart ran the deepest at 29%, Best Buy averaged 24% and $243 in savings, and Amazon sat lower at roughly 21% and $164. Google and Samsung together drove about 60% of all deals, with Apple absent from official participation.
In 2026, Google led on depth at a 26% average, anchored by Pixel 10 markdowns of 33% to 35% off. Samsung averaged 23%, with standouts including the Z Flip7 FE at roughly 44% off to $499.99 and the S26 Ultra near 30% off to $919.99. Motorola showed the widest spread, with individual deals reaching 34% against a 19% brand average. See a year-over-year comparison of discounts by brand below.
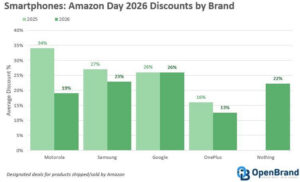
The takeaway is a category where a few flagship markdowns did the heavy lifting while the baseline stayed disciplined.
Analysis by Scott Peterson, Smartphones Analyst, OpenBrand
Tablets & Detachables
Snapshot: Retailers Compete on Tablet Value as Deal Counts Climb
Tablet promotions grew in breadth while easing on depth. Best Buy led average savings at $132, Target and Amazon followed at $125, and Walmart trailed at $94. OpenBrand captured 95 unique deals, up 13% year over year, and average promotional value jumped 46% to $151 even as the average discount slipped 4 points to 29%.

Samsung was the most active brand with 41 deals, and Amazon leaned on its own hardware, including the Fire 7 Kids at 50% off. The pattern mirrors the broader event: more items and higher promotional value, driven by a pricier product mix, rather than uniformly deeper markdowns.
Analysis by Nick Harpster, Tablets & Detachables Analyst, OpenBrand
Televisions
Snapshot: Major TV Merchant Reactions to Prime Day 2026
Best Buy was the promotional leader, delivering the deepest average discount at 27% and the highest average savings of the event at $553, reinforcing its premium TV positioning. Amazon balanced a broad assortment with pricing discipline at 23% off and $339 in savings, and it barely moved those numbers across the four days. Walmart built momentum as the event progressed, lifting daily average discounts from 19% to 21% and savings from $177 to $233 by Day 4, while Target ramped from 13% to 19% before settling at a conservative 16% and $150.
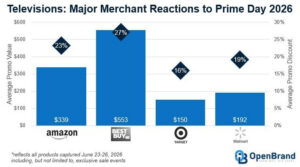
OpenBrand captured 232 unique TV deals on Amazon, more than twice last summer’s count, yet the overall average discount held at 23%. Mini LED was the event’s defining technology at 45% of promoted models. Samsung was the most visible brand at 26% of assortment but held pricing discipline at an 18% average, while Amazon’s own Fire TVs and Hisense were the most aggressive large-volume discounters at 30% each, and TCL held at 25%.
Analysis by Scott Peterson, TVs Analyst, OpenBrand
Wearables
Snapshot: Discount Depth Dipped Nearly 3 Percentage Points Year Over Year
Smartwatch promotions cooled. Average savings fell 13.6% year over year to $102 off, and average discount depth slipped 2.8 points to 23.1%, a move OpenBrand attributes in part to Amazon’s May 2026 “Typical Price” policy change that trimmed artificially inflated discount percentages. Fitbit posted the highest average discount at 28.2% and Withings 26.1%, though both did so across fewer deals and SKUs, which inflated the averages.
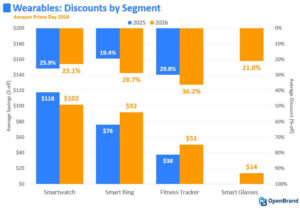
Apple topped dollar savings at $153 off, driven by Series 9 clearance running up to 45% off while the current Series 11 averaged 24% and the Ultra line never exceeded 19%. Garmin was close behind at $147 on the highest average shelf price of any brand, roughly $700. Smart rings were the emerging story, with savings up 21% to $92 and depth up 9.3 points to 28.7%, and fitness trackers posted the deepest discounts of any wearable segment.
Analysis by Andrew Chow, Wearables Analyst, OpenBrand
Canada Categories: What the Analysts Saw
OpenBrand also tracked Canadian product lines during Prime Day 2026. Here’s an excerpt from two categories, which both flagged Apple pricing moves alongside the promotional picture, a useful contrast to the US market.
Canada Notebooks
Snapshot: Discounts Fall as a Pricier Mix and Apple’s Debut Reshape the Field
Canadian notebook discounts fell to a 19% average, down from 23% last July, even as average promotional value rose $244 on a higher-ticket product mix and component-cost inflation. OpenBrand captured 98 unique deals, including 77 consumer and 17 gaming. Asus led with 27 deals, ahead of Acer at 21 and HP at 17. Consumer discounts dropped 7 points to 19% while gaming discounts rose 6 points to 18%.
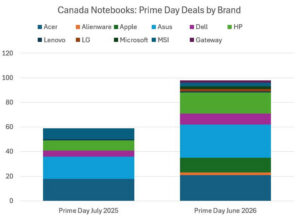
Depth fell across all five leading Windows brands, with Asus (32% to 26%) and HP (28% to 21%) most affected. Gaming drew far more attention than in prior years, with Asus and Acer leading and MSI stepping back from its historically dominant position. The structural change was Apple, which participated for the first time with M5 MacBook Air and Pro instant savings peaking at $300 and $200. Separately, OpenBrand noted Apple raised prices across categories by an average of nearly $250, citing memory and storage cost spikes.
Analysis by Avery Bissett, Notebooks Analyst, OpenBrand
Canada Desktops
Snapshot: Restrained OEM Promotions Leave System Integrators to Drive Value
Canadian desktop promotions were restrained, with the average discount at 13%, down from 20% last year, while promo value held flat at $268 on higher-priced desktops. OpenBrand captured 30 unique deals, 19 of them gaming, with Acer and SkyTech tied for the most at six each. Consumer discounts fell 6 points to 13% and gaming discounts dropped 8 points to 12%.

Major OEMs underindexed: Acer’s discount average slid to 11% and $117, and HP and Dell eased as well. System integrators carried the value story, with CyberPower averaging 16% off and $353 and SkyTech at 12% off and $389 on larger-ticket rigs. Gaming was intensely competitive on price compression, with CyberPower’s $1,099 RTX 5060 tower undercutting entry-level systems. As in Canada Notebooks, OpenBrand flagged Apple’s roughly $250 average price increase across its consumer electronics lineup.
Analysis by Avery Bissett, Desktops Analyst, OpenBrand
What Prime Day 2026 Means Moving Forward
The through-line across all eleven reports is that Prime Day has become a structural read on retail strategy, not a one-off sale. Retailers are managing promotions as a year-round system, and the categories that moved during Prime Day are the ones to watch through the fall.
First, the widening-assortment strategy changes how brands should plan promo calendars. When Amazon doubles TV deals and holds discount depth flat, and tablet counts rise while depth eases, the competitive lever is breadth and product mix, not markdown percentage. Brands that plan around a single discount target will misread the field.
Second, the spread of competition beyond Amazon reshapes share and leakage math. Best Buy out-discounting Amazon on TVs and leading dollar savings in floor care means shoppers can find deeper value off-platform, so any brand watching only Amazon is watching the wrong ceiling. Third, category divergence is the real signal into H2. Robotics, floor washers, cordless OPE, and a handful of flagship phones ran hot, while smartphones and smartwatches cooled and Canadian PCs discounted less on a pricier, inflation-driven mix. Those are the lines to model before the fall run.
OpenBrand’s Insight: The retailers and brands that won Prime Day 2026 did it with assortment breadth and precise, brand-level targeting, not blanket markdowns, and that is exactly the playbook to stress-test before Black Friday.
What to Watch for the Next Big Promo Window
The next major test is the back-to-school stretch into Labor Day, followed by the Black Friday and Cyber Monday run. The Prime Day 2026 patterns give brands a template for what to monitor.
Questions worth tracking into the next window:
- Does the breadth-over-depth pattern hold, or do discounts finally deepen? Watch whether the extended assortments and steady markdown percentages from Prime Day carry into fall, or whether inventory pressure forces deeper cuts, especially in TVs and tablets where deal counts already spiked.
- Do rivals keep matching Amazon’s window and depth? Best Buy led TV depth and floor-care dollars, and Walmart led notebooks and mowers. Watch whether that multi-retailer competition intensifies through Black Friday, since that is where share and leakage will move.
- Which high-signal brands run clearance versus discipline? Watch Apple’s Series 9 style clearance behavior, Google and Samsung flagship phone markdowns, and iRobot’s robotics depth, and watch whether Canadian PC discounts stay shallow as Apple’s price increases work through the channel.
For the macro read on Prime Day 2026, why consumer sentiment stayed soft while shoppers still outspent their own durables plans, and why June promotions were not enough to hold down durables inflation, OpenBrand Chief Economist Ralph McLaughlin breaks it down in What Prime Day Data Reveals About Consumer Behavior and Retailer Strategy.
How OpenBrand Can Help
OpenBrand tracks pricing, promotions, and market share across durable goods categories in real time, so you head into each promo window knowing which brands discount deepest, how retailers sequence their deals, and where assortment gaps open up. The same data behind these eleven Prime Day reports feeds line review prep, competitive intelligence, and promotional planning for brands and retailers.
See what OpenBrand’s data can tell you about your categories before the next promo window
A conversation with our analyst team gets you a walkthrough of category-level pricing and promotion trends specific to your lines, so you can prep your next line review and Black Friday plan against real competitive movement rather than last year’s assumptions.
Frequently Asked Questions
When was Amazon Prime Day 2026 and how long did it run?
Prime Day 2026 ran four days, June 23 to 26. Amazon shifted the event earlier into late June, clustering it with Memorial Day, back-to-school, the FIFA World Cup, and Fourth of July shopping. According to Adobe Analytics, US online retail spend reached $26.4 billion, up 9.3% year over year. OpenBrand tracked pricing, promotions, and consumer response before, during, and after the event to see how the market shifted.
Which retailers competed with Amazon during Prime Day 2026?
Walmart, Target, Best Buy, and Costco all ran competing promotions during the window. According to OpenBrand, Best Buy frequently led on value, delivering the deepest average TV discount at 27% and the highest floor-care dollar savings at $194, while Walmart led notebook and mower discounting.
Did discounts get deeper during Prime Day 2026?
Not broadly. According to OpenBrand, retailers competed on assortment breadth rather than depth: Amazon doubled its TV deals to 232 while holding a 23% average discount, and tablet deal counts rose 13% even as average discount eased to 29%.
Which product categories saw the most promotional activity during Prime Day 2026?
Robotics and floor washers (iRobot at 50% off, floor washers at 37%), cordless outdoor power equipment (26% off), and select flagship phones led the activity. According to OpenBrand, smartphones and smartwatches cooled, with discounts falling to 23% and 23.1% respectively.
How does OpenBrand track Prime Day and other promotional events?
OpenBrand monitors pricing, promotions, and market share across durable goods retailers and categories in real time. Brands and retailers use that data for line review prep, competitive intelligence, and promotional planning ahead of each major window.

The Power Tools Market Is Changing | Q4 2025 Share & Rankings
The Power Tools market share landscape continues to shift in Q4 2025 as shoppers rebalance spending across brands like DEWALT, Ryobi, Milwaukee, Craftsman, and Hyper Tough and retailers such as Home Depot, Lowe’s, Walmart, and Amazon.
A wave of innovation is reshaping category fundamentals in cordless battery systems, smart-tool connectivity, and sustainability-driven design. Big-box home improvement retailers and traditional dealer networks remain influential, while e-commerce and brand-direct channels continue to carve out share.
This report uses OpenBrand’s Power Tools Total Market Insights Infographic [download now!] to show which Power Tools brands and retailers are gaining share, how online vs. in-store sales compare, and what drives purchase decisions across generations. To see all the data, download the infographic now!

Source: All data insights in this article reflect Q4 2025 data from an OpenBrand aggregate category that includes Air Compressors, Circular Saws, Jig Saws, Orbital Sanders, Power Drills, Reciprocating Saws, and Rotary Tools.
Key Takeaways: Power Tools Market Share Q4 2025
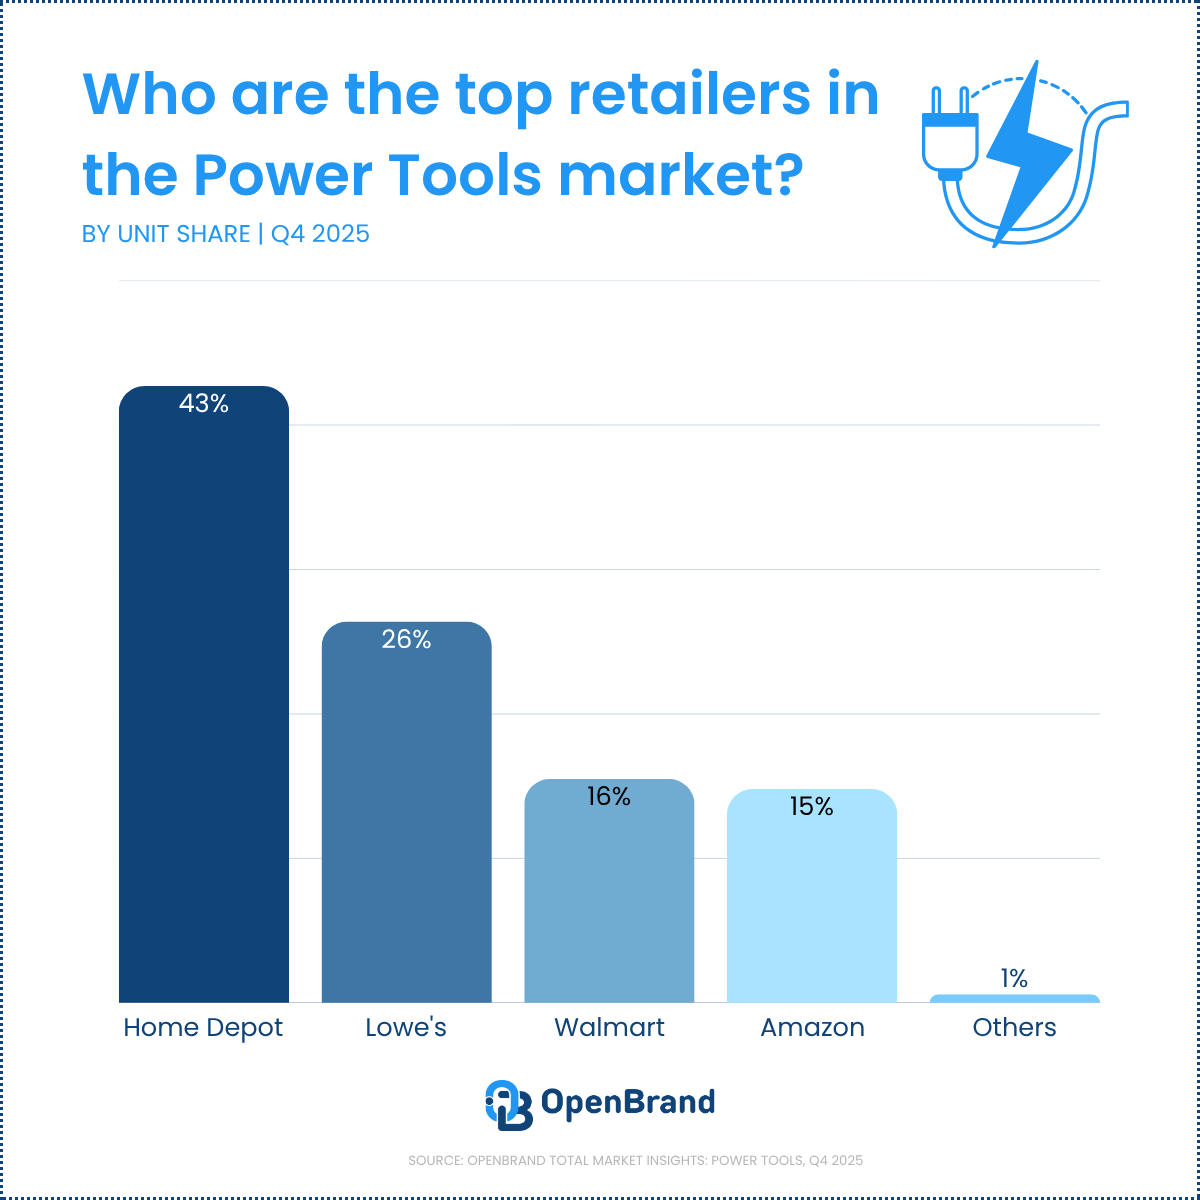
- Home Depot leads retailers at 43% unit share, with Lowe’s at 26%, Walmart at 16%, and Amazon at 15%.
- DEWALT and Ryobi tie for the brand lead at 19% unit share each, but DEWALT dominates dollar share at 28% to Ryobi’s 11%.
- Home Depot draws the most shoppers (41%) and closes the most (75%); when it loses a shopper, 53% go to Lowe’s.
- The category stays store-led: 72% of purchases happen in-store, 28% online.
- Millennials are the largest buyer group at 33%, with Gen X (28%) and Gen Z (20%) close behind.
- Competitive price is the top reason shoppers pick a retailer (50%), and replacing a broken tool drives the most purchases (35%).
Who are the top Power Tools retailers by market share?
In Q4 2025, Home Depot leads Power Tools unit share at 43%, followed by Lowe’s at 26%, Walmart at 16%, and Amazon at 15%. These retailers account for nearly the entire tracked market, with other outlets contributing just 0.6% of unit share.
Q4 2025 Top Power Tools retailers by market share
| Power Tools Retailer | Q4 2025 Unit Share |
| Home Depot | 43% |
| Lowe’s | 26% |
| Walmart | 16% |
| Amazon | 15% |
| Best Buy | 1% |
Notes:
OpenBrand’s share split is based on our retailer panel, which currently consists of Home Depot, Lowe’s, Amazon, Walmart, and Best Buy. These retailers make up a majority of non-individual dealer sales in the Power Tools industry. More retailers are coming soon.
Shares may not total 100% due to rounding.
OpenBrand’s Power Tools Trend Insight
Home Depot continues to dominate Power Tools unit sales, but Lowe’s maintains a strong share of the category, and Walmart and Amazon together now represent about one-third of tracked unit volume. The narrow gap between Walmart and Amazon shows that both remain credible alternatives for value-driven shoppers.
Q4 2025 Power Tools Retailer Draw Rates
Our top market leaders also continue to lead in outlet draw rate, with:
- Home Depot drawing in 41% of all Power Tools purchasers
- Lowe’s drawing in 33%
- Walmart following as the third most considered outlet at 18%
Among these top three retailers, Home Depot also has the highest close rate at 75%.
| Retailer | Draw Rate |
| Home Depot | 41% |
| Lowe’s | 33% |
| Walmart | 18% |
| Amazon | 14% |
| Harbor Freight | 6% |
To see close rates for these retailers, download the infographic.
OpenBrand’s Power Tools Trend Insights
Home Depot not only draws the most Power Tools shoppers but also converts them at a strong 75% close rate, reinforcing its role as the category’s anchor destination. Harbor Freight stands out for efficiency, closing 70% of the smaller share of shoppers it attracts, which points to upside if it can widen consideration.
Who wins Home Depot’s lost shoppers?
OpenBrand’s leakage analysis data looks at which Power Tools retailers win shoppers after they shop one retailer but ultimately don’t purchase. As one example, we look at Home Depot (market share leader) to see who picks up their lost shoppers.
Home Depot has a walk rate of 25%. Here’s who gains those shoppers.
| Destination for Home Depot Lost Shoppers | % of Lost Shoppers Captured |
| Lowe’s | 53% |
| Amazon | 15% |
| Walmart | 11% |
| Harbor Freight | 7% |
OpenBrand’s Power Tools Trend Insights
More than half of Home Depot’s leaked shoppers end up purchasing at Lowe’s, underscoring the retailer’s strength as a backup destination when Home Depot does not close the sale. Amazon and Walmart also pick up a meaningful share of these shoppers, suggesting that convenience and price remain strong fallback drivers.
Who leads the Power Tools market share by brand?
The top Power Tools brand is DEWALT, leading in both unit and dollar share – though tied with Ryobi in units share.
DEWALT and Ryobi each hold 19% of Power Tools unit share in Q4 2025, while Milwaukee holds 13% and over-indexes on dollar share at 22%. DEWALT leads the category in dollar share at 28%, compared with Ryobi’s 11%.
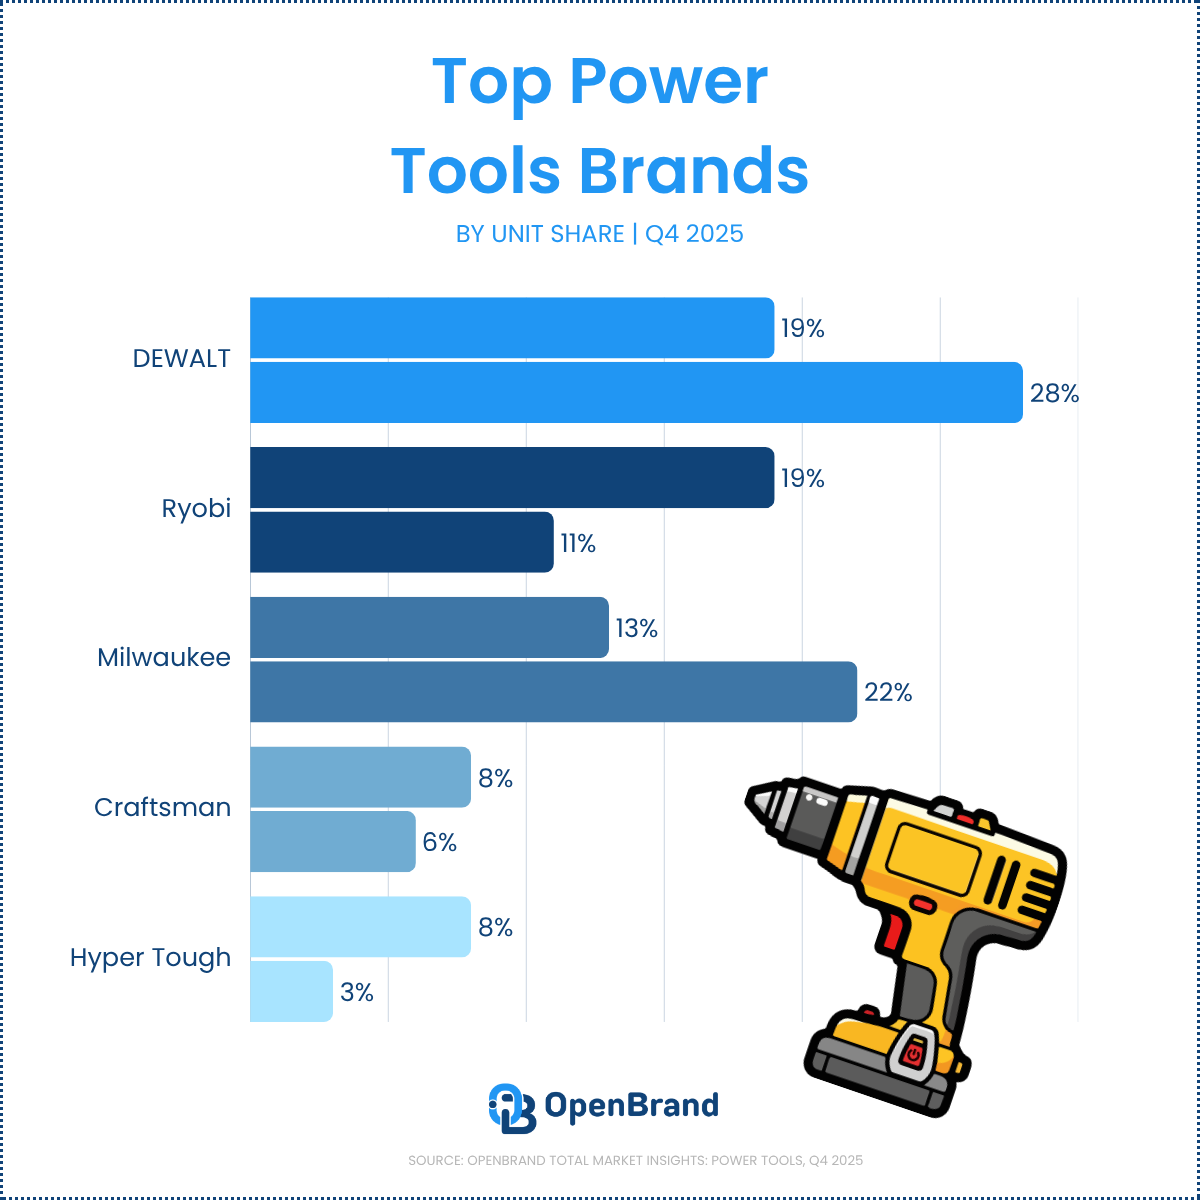
Q24 2025 Power Tools Brand Market Share
| Brand | Q4 2025 Unit Share | Q4 2025 Dollar Share |
| DEWALT | 19% | 28% |
| Ryobi | 19% | 11% |
| Milwaukee | 13% | 22% |
| Craftsman | 8% | 6% |
| Hyper Tough | 8% | 3% |
OpenBrand’s Power Tools Trend Insights
DEWALT and Ryobi are tied for first in unit share, but DEWALT’s dollar share is more than double Ryobi’s, highlighting a stronger premium position. Milwaukee also outperforms on dollars relative to units, while Craftsman and Hyper Tough play a larger role in value-driven sales.
Power Tools SKU-level share winners
The top SKUs in Power Tools were manufactured by Craftsman and Ryobi.
| SKU | Unit Share | Average Price | Min Price | Max Price |
| Craftsman – 20 V Power Drill (CMCD700C1) | 4.3% | $71 | $64 | $82 |
| Ryobi – 18 V Power Drill (PCL201K1) | 3.6% | $50 | $38 | $57 |
| Ryobi – 18 V Power Drill (PCL206K1) | 3.3% | $75 | $59 | $83 |
OpenBrand’s Power Tools Trend Insights
Craftsman leads the quarter at the SKU level with its 20 V Power Drill, but Ryobi places two of the top three SKUs across different price bands. This distribution shows how strong lineup coverage within a single use case can help a brand capture both entry and step-up demand. This is also significant given Ryobi exclusivity with Home Depot – and emphasizes why Home Depot leads the market.
How are online and in-store sales trending for the Power Tools market?
In Q4 2025, 72% of Power Tools purchases happen in a retail store or other outlet, while 28% are completed online through the internet. The category remains store-led, but online still represents more than one in four purchases.
- In-store: 72% of purchases
- Online: 28% of purchases
OpenBrand’s Power Tools Trend Insights
The in-store channel continues to dominate because Power Tools shoppers often want to assess weight, feel, and build quality before purchase. Even so, the online share is large enough that product content, reviews, and availability messaging remain essential to winning consideration and conversion.
Power Tools Consumer Demographics
Millennials remain the largest Power Tools buyer group in Q4 2025 at 32.9% of unit sales, followed by Gen X at 27.5% and Gen Z at 20.2%. Baby Boomers account for 18.2%, while Matures represent 1.2% of the market.
| Generation | Q4 2025 Unit Share |
| Gen Z (born after 1996) | 20% |
| Millennials (born 1981–1996) | 33% |
| Gen X (born 1965–1980) | 28% |
| Baby Boomers (born 1946–1964) | 18% |
| Matures (born before 1946) | 1% |
OpenBrand’s Trend insights
Millennials continue to lead the category, but Gen X and Gen Z together account for nearly half of all purchases, reinforcing the need for messaging that spans both established homeowners and younger shoppers entering the category. This mix suggests brands should balance performance and durability cues with approachable value and project-oriented education.
Power Tools Purchase Drivers
Competitive price remains the top reason shoppers choose a retailer for Power Tools, followed by product selection, convenient location, and prior experience with the store. On the product side, replacement remains the biggest purchase trigger, while first-time purchases and additional tool purchases also represent meaningful demand.
Why consumers select a specific retailer
| Retailer Purchase Driver | % of Shoppers Mentioning |
| Competitive price | 50% |
| Good selection of products | 30% |
| Convenient location | 21% |
| Previous experience with store | 19% |
| Already in store buying other items | 16% |
OpenBrand’s Power Tools Trend Insights
Nearly half of shoppers cite competitive price as the main reason they choose a retailer, confirming that Power Tools remains a cost-sensitive category. Assortment, convenience, and prior store experience still play major supporting roles, which means retailers cannot rely on pricing alone.
Why consumers purchase a Power Tool product
| Product Purchase Driver | % of Purchases |
| Replacement for broken, lost, or not working item | 34.9% |
| First-time purchase of this item | 17.3% |
| Wanted an additional one | 10.9% |
| Part of remodeling project | 10.3% |
| Just wanted a new one | 9.9% |
OpenBrand’s Power Tools Trend Insights
Replacement needs drive more than one-third of category purchases, which keeps functional, solution-oriented messaging highly relevant. At the same time, first-time buyers and expansion purchases create room for education, comparison content, and project-based merchandising.
Power Tools Competitive Intelligence: Pricing & Promotions
OpenBrand’s Q4 2025 competitive intelligence data shows how shelf presence, pricing, discounting, and new product activity differ across major Power Tools brands. Together, these indicators help explain which brands are building visibility, defending margins, and investing in future demand.
Our infographic offers insight into pricing, promotions, and product debuts. Here’s a look at how brand share of shelf is trending.
Brand share of shelf
There are 5,074 total category placements across tracked retailers.
| Brand | Share of Shelf |
| DEWALT | 15% |
| Milwaukee | 9% |
| Makita | 9% |
| Ryobi | 5% |
| Bosch | 4% |
| California Air Tools | 4% |
| Skil | 3% |
| Wen | 3% |
| Craftsman | 2% |
| Hyper Tough | 1% |
OpenBrand’s Trend insights
DEWALT’s share of shelf has clear value: the brand leads in unit and dollar share as well, highlighting the value of claiming space in store.
Power Tools Industry Outlook and Emerging Trends
What’s next for the US Power Tools market in 2025?
Looking into 2026, several factors are shaping the Power Tools market:
Sustainability and compliance reshape the competitive landscape
Battery platforms continue to expand as states phase out gas equipment and tighten emissions rules. Consumer demand is shifting toward cleaner, quieter, and lower-maintenance tools. Brands with established battery ecosystems and multi-tool compatibility are positioned to win as the category moves further into full electrification.
Smart technology and automation gain traction
Connected tools, diagnostics, and automation are moving from early adoption into mainstream use. Rising labor costs are accelerating interest in features like performance tracking, app-based management, theft prevention, and intelligent controls. Expect more high-capacity battery packs, faster charging innovations, and premium user experiences centered on efficiency and uptime.
Omnichannel execution becomes a key differentiator
In-store remains the anchor for Power Tools, but online growth continues to outpace the rest of the category. Amazon is closing the gap with Home Depot, and shoppers increasingly expect seamless pricing, strong digital content, and fast fulfillment. Retailers that integrate BOPIS, clear comparisons, and strong reviews will gain share as buying journeys shift.
Margin pressure increases and drives consolidation
Electrification, software integration, and regulatory compliance are raising the cost of doing business. Brands are reducing SKU complexity, leaning deeper into platform ecosystems, and taking a more disciplined approach to partnerships and pricing. The result is a more consolidated market where scale and innovation matter more than ever.
Get more insight into Power Tools market trends
Q4 2025 shows a Power Tools market shaped by premium and value segmentation, strong store-led demand, and a competitive mix of retailers and brands fighting for share.
As electrification, smart features, and omnichannel expectations continue to evolve, current market data becomes more important for pricing, assortment, and merchandising decisions.
See the Power Tools Total Market Insights Infographic
Get the complete Q4 2025 picture: brand and retailer share, draw and close rates, price-band breakdowns, SKU winners, share of shelf, discount depth, and product debuts in one view.
Want the data for a specific category, brand, or retailer? Contact us today!
Power Tools Market Share FAQs
Who has the largest Power Tools market share in Q4 2025?
By brand, DEWALT and Ryobi are tied for the lead at 19% unit share each, with DEWALT well ahead on dollar share at 28%. By retailer, Home Depot leads at 43% unit share, followed by Lowe’s at 26%.
Which brand leads Power Tools dollar share?
DEWALT leads dollar share at 28%, more than double Ryobi’s 11% despite their tied unit share. Milwaukee also over-indexes on dollars at 22% versus 13% unit share, signaling a premium position.
Which retailer has the highest close rate in Power Tools?
Among the top draw retailers, Home Depot has the highest close rate at 75%, converting the most shoppers it attracts. Harbor Freight closes 70% of a much smaller draw, pointing to upside if it can widen consideration.
Where do Home Depot’s lost Power Tools shoppers go?
More than half of Home Depot’s lost shoppers, 53%, end up purchasing at Lowe’s. Amazon captures 15% and Walmart 11%, making convenience and price the main fallback drivers.
Are Power Tools bought more online or in store?
The category remains store-led, with 72% of Q4 2025 purchases completed in a retail store and 28% online. That online share is large enough that product content, reviews, and availability messaging still influence consideration.

5 Questions Category Managers Should Be Able to Answer After Line Reviews
You’ll sit through dozens of product line reviews this year. Most of them will show you the same things: velocity by SKU, year-over-year sales, maybe a trade spend summary. The competitive slide will conveniently leave out every brand doing better than theirs.
By the end of the meeting, you’ll have a thorough picture of how the vendor is performing at your stores. The harder question of how that performance compares to the broader market rarely makes it into the deck.
The five questions below are a framework for what a line review should actually leave you knowing. They’re not about making the vendor uncomfortable. They’re about walking out with a clear view of the category overall, as well as a clear view of that vendor’s position within it.
5 Questions Your Product Line Review Should Answer
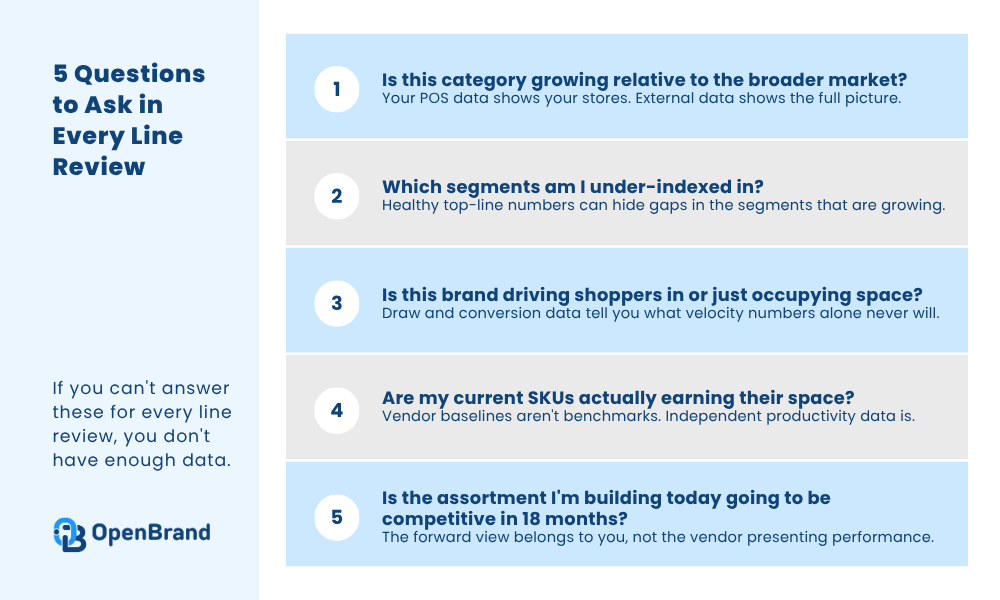
Q1: Is This Category Growing or Shrinking Relative to the Broader Market?
Your POS data tells you what’s happening at your stores. It doesn’t tell you whether you’re keeping pace with the market, lagging it, or outperforming it. That distinction matters enormously for how you treat a flat or declining category.
A flat category at your stores could mean three different things: the market is flat and you’re tracking it, the market is growing and you’re losing share, or the market is contracting and you’re actually holding up better than average.
Each of those calls for a different response. Without external market data, you’re making a call based on one data source, which is the same position the vendor is trying to put you in.
What to do about it: The benchmark you need isn’t in their deck. It has to come in with you.
Q2: Which Segments Am I Under-Indexed In?
Even a healthy overall category can have growth concentrated in a segment you’re barely carrying. Think price tiers, product formats, or feature-driven subsets of the category. If one of those is taking share in the market and your shelf set is thin there, that’s a gap in your assortment, not a reason to feel good about your top-line numbers.
Segment-level data is where most line reviews fall short. Vendors typically present at the brand level, occasionally at the sub-line level.
What you need is a read on how different segments within the category are performing across the market: which are gaining, which are plateauing, and what the trajectory looks like. That’s the context that tells you whether your current shelf set reflects where the category is going or where it was three years ago.
What to do about it: Don’t wait for a vendor to surface a gap that benefits them to fill. Know your segment coverage against the market before the meeting starts.
Q3: Is This Brand Bringing Shoppers In or Just Occupying Space?
Not every brand on your shelf is pulling its weight the same way. Some drive traffic. Some convert browsers into buyers. Some do neither and exist mainly because they’ve always been there. Draw and conversion data tell you which category a brand actually falls into.
A vendor will show you their velocity numbers. What they likely won’t show you is whether shoppers who came in for their brand left with it, left with something else, or left without buying at all.
That gap between draw and close is where the real assortment decision lives. A brand with strong draw but weak close points to a pricing or placement problem. A brand with weak draw isn’t earning its space regardless of how its velocity looks.
What to do about it: Evaluate external draw, close, and leakage data for brands before the meeting, not during it. If you’re looking at a brand’s shelf contribution using velocity alone, you’re only seeing part of the picture.
Q4: Are My Current SKUs Actually Earning Their Space?
Every vendor walks in ready to defend their SKUs. The more useful question is whether you can evaluate them independently of whatever baseline the vendor chose to present against.
A vendor will almost always frame SKU performance against their own historical numbers. What that framing can’t tell you is how your shelf productivity compares to what’s typical for this category across other retail environments. Are you carrying SKUs that occupy space and drive low incremental value while higher-demand segments go underrepresented? Productivity benchmarking answers that. Vendor presentations typically don’t.
What to do about it: Run your own productivity benchmarks before the review, not after. If you’re evaluating SKU performance using only the vendor’s framing, you’ve already lost the upper hand.
Q5: Is the Assortment I’m Building Today Going to Be Competitive in 18 Months?
Most line reviews are backward-looking by design. Vendors present trailing performance because trailing data supports their case. The forward view of where the category is heading, which segments are early in their growth curve, and which are under regulatory pressure rarely comes from a vendor with a stake in the answer.
As the buyer, that forward view is yours to own. Which formats are gaining consumer attention? Which parts of this category face regulatory headwinds in the next two years? Which segments are late-stage versus just getting started?
If you’re not stress-testing your category strategy against those questions independently, you’re letting vendors set the agenda on a category you manage.
What to do about it: Build your forward view independently. Trend and innovation data should inform your category strategy before vendors arrive to tell you what it means for theirs.
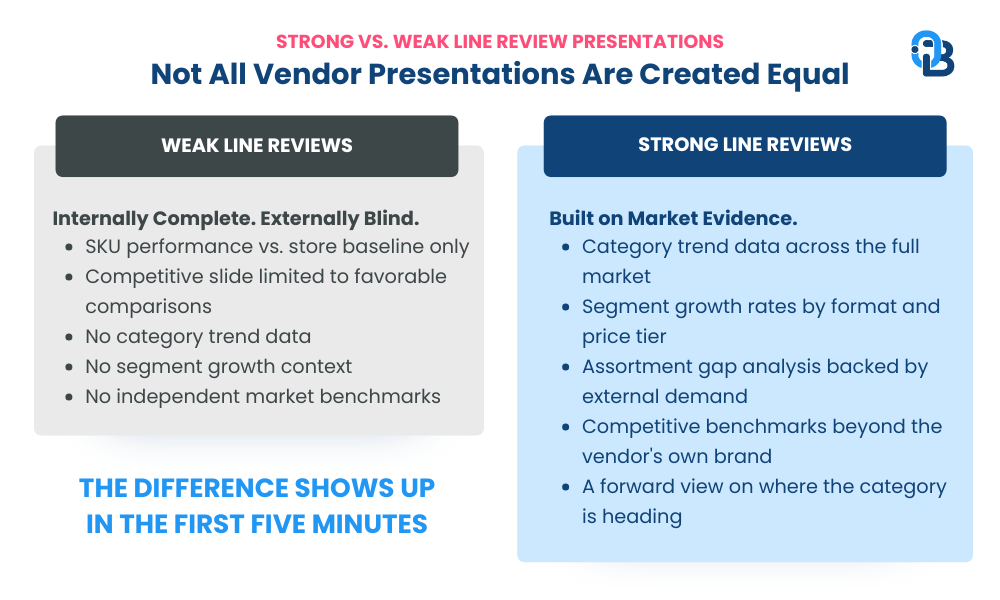
Strong vs. Weak Line Review Presentations: What to Look For
After enough product line reviews, you develop a quick read on presentations within the first five minutes. The evaluation lens for vendor presentations is simpler than most category managers make it.
Weak presentations are internally complete and externally blind. They show SKU-level performance at your store, brand trajectory against a narrow competitive set, and a pitch that assumes your store’s numbers are the whole story.
Strong presentations bring outside-in context. Category trend data. Segment growth rates across the market. Assortment gaps backed by evidence of consumer demand, not just vendor preference. There’s a meaningful difference between a vendor who has done the homework on the category and one who has done the homework on their own brand.
The tell is usually the competitive slide. A vendor who only shows you their own brand’s trajectory against your store’s baseline has done the minimum. A vendor who shows you how a whole segment is shifting, and where your assortment sits within it, has done something more useful.
If you’re on the brand side of this conversation, we’ve covered what your presentation should include.
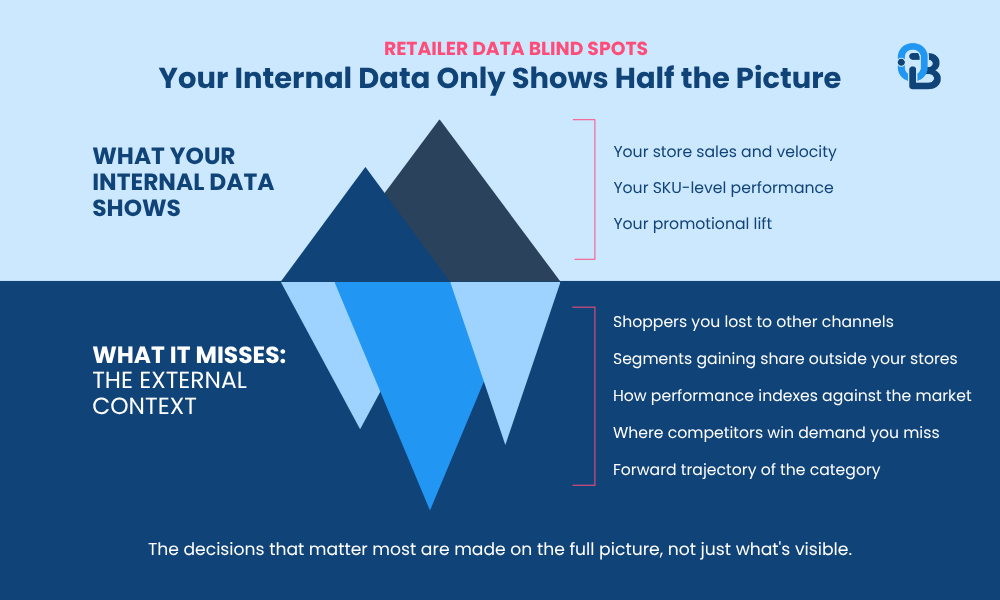
The Data Blind Spot Most Retail Buyers Don’t Talk About
Category managers are rigorous about holding vendors accountable for data quality. They’re less rigorous about holding themselves accountable to the same standard. Most default to POS data as the primary source of truth, and that data only shows you your customers, not the ones you don’t have.
A buyer who has managed a stagnant category for three years and never benchmarked it against external market data may have been watching the category erode without a reference point to recognize it. The line reviews kept coming. The vendors kept optimizing their own position within a shrinking pie. Nobody brought the map.
This isn’t a failure of diligence. It’s a structural limitation of relying on a single data source. POS data is necessary. It isn’t sufficient.
A well-prepared brand will walk in with all four of these covered. Here’s what that preparation looks like from the brand side.
How Market Data Changes the Line Review Dynamic
When retailers have external market intelligence that’s independent of what vendors bring, the dynamic in the line review changes.
Stop evaluating a vendor’s claims in isolation. Start pressure-testing them against a market view you already have.
If a vendor says their segment is growing, you can verify it. If they’re pitching for more facings based on velocity trends, you can cross-reference whether their segment is gaining or losing share at a market level. That cross-reference is what separates a confident shelf decision from one that’s based on whoever gave you the most polished presentation.
OpenBrand gives retailers that external layer: market trends, assortment benchmarking, and segment-level performance data across channels. The practical effect is faster decisions, more confidence in assortment calls, and a line review that’s a genuine strategic conversation rather than a vendor pitch you’re evaluating without a reference point.
Get Your Line Review Readiness Report
Want to see how this comes together in practice? We’ve built a Line Review Readiness Report that maps the right data to the right narrative, so you can walk into your next review with a complete story, not just a slide deck.
You can preview and download our template here.


If you want to unlock the data to fill it out, connect with our team to get the conversation started. The completed report is free. Just let us know what retailers and products are most important to you. We’ll generate a custom report and setup time to walk you through the data.
FAQ
What is a product line review?
A product line review (PLR) is a structured meeting where a brand presents category and brand performance data to a retail buyer to negotiate shelf space, defend existing SKUs, or propose assortment changes.
The quality of those decisions depends on whether the buyer has independent market data to pressure-test what vendors bring in, which is what OpenBrand provides for retail category teams.
What should a category manager get out of a product line review?
A category manager should leave a line review knowing whether the category is growing or contracting relative to the market, which segments are underserved in their current assortment, where they’re losing shoppers, whether existing SKUs are productive, and whether their assortment strategy is forward-looking.
OpenBrand gives retail buyers the external market intelligence to answer all five questions independently of what vendors present.
How do you evaluate vendor presentations in a line review?
The key differentiator is whether the vendor brings external market context or only internal performance data. Strong presentations include category trend data, segment growth rates across the market, and assortment gap analysis backed by external demand signals.
OpenBrand gives category managers an independent read on all of those signals so vendor claims can be verified, not just accepted.
Why isn’t POS data enough for a product line review?
POS data only shows what’s happening within your four walls. It doesn’t show whether you’re keeping pace with the broader market, which segments are growing outside your stores, or where you’re losing shoppers to other channels or formats.
OpenBrand fills that gap with market-level category intelligence that’s independent of what any single vendor brings to the table.

What Data to Include in Your Next Line Review (Best Practices)
Line reviews are one of the highest-stakes conversations between brands and retailers.
The buyer has already seen a dozen decks before yours. Most of them look the same.
The brands that walk away with more shelf space aren’t always the ones with the best products. The decision of who keeps shelf space, who gains it, and who loses it often comes down to who came prepared with the right story, backed by the right numbers.
New to line reviews? [Start here].
Here’s the data you need to improve your line review outcome.
The Data Types That Matter in a Line Review
Not all data carries equal weight in a line review. Retailers care about category growth, assortment optimization, and whether your brand is helping them increase shopper dollars.
With the right brand data, Line Review presentations are able to confidently do the following things:
- Understand category shifts
- Defend existing SKUs
- Make the case for expanding share of shelf
- And (most importantly!) explain why
Each requires a different type of evidence, and buyers notice when they are missing.
Most teams walk in with the internal proof already covered: sell-through trends, margin performance, promotional ROI, inventory, etc. It’s the external data that really elevates the story.
To be clear, internal data is critical – and buyers expect to see it. But internal data only tells the buyer how your products performed at their store. Internal data doesn’t answer the harder questions: How does that performance compare to the market? Where is the category headed? What’s missing from the shelf and why should it be yours?
That’s where external data completes the picture. Let’s look at the internal vs. external data sources and the value they bring.
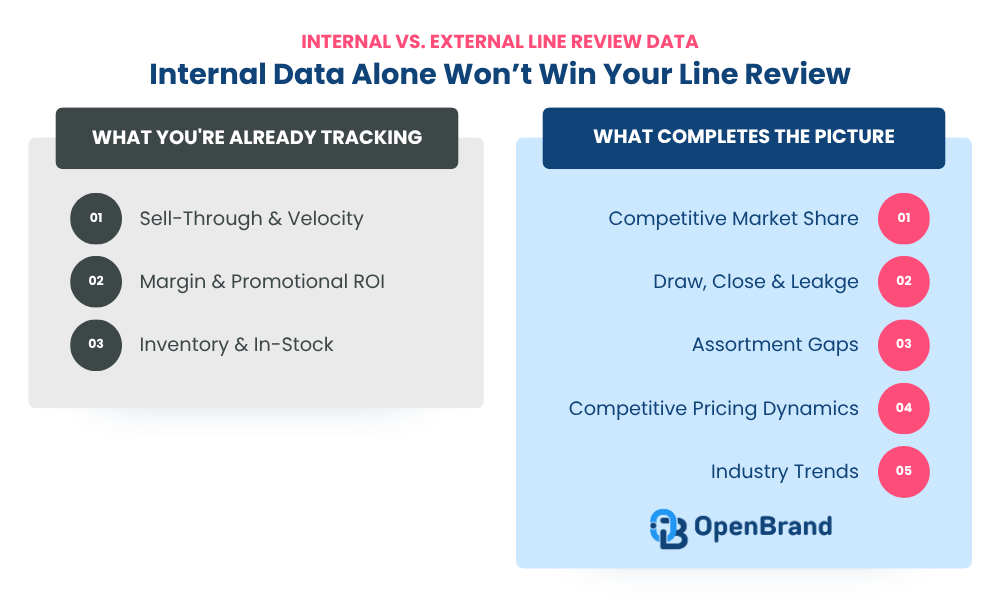
Internal Brand Data: Your Product Line Review Baseline
Sell-through & velocity
Your baseline. Shows which SKUs are earning their space and which aren’t pulling their weight.
Margin & promotional ROI
Demonstrates that your products are profitable for the retailer and that your promotional investment is working.
Inventory & in-stock performance
Establishes operational credibility and shows you can support the assortment you’re recommending.
External Market Data: What Completes the Line Review Story
Market share
Unit and dollar share across retailers and brands shows where the category is concentrating and where it’s leaking. The right market share data will give the buyer a clear view of the competitive landscape and position your brand within it.
Draw & close rates
Retailers can have strong shopper traffic but still lose the sale. The right conversion data reveals where intent breaks down and gaps exist, with the ability to connect that to pricing, placement, or product mix.
Walk rate & leakage
Where do shoppers go when they don’t buy at this retailer? Where do they go when they don’t buy your brand? This right leakage data pinpoints competitive threats and helps you build a case for why your products close the gap.
Pricing & promotions
Price is often the primary decision factor. Showing how your pricing and promotional cadence aligns with shopper demand and competitors matters to buyers focused on conversion. The right pricing data will help you connect back to leakage, draw, share, and beyond.
Assortment gaps
Which segments are underserved? Where is your competitor winning volume that this retailer is not capturing? The right assortment data helps map SKU coverage to demand signals so buyers can understand what they’re leaving on the table.
Industry trends & innovations
Regulatory changes, technology shifts, and emerging consumer behaviors all affect what products will matter on shelf in the next 12–18 months. Bringing that context elevates your role from vendor to category expert.
Why Each Line Review Data Type Matters to the Retailer
Buyers run their own performance analysis for your brand and SKUs before you even walk in the door. What they want from a supplier is the external layer. They want to see the market context they can’t easily find in their own internal data.
Here are examples of how each data type maps to the four things your line review needs to do.
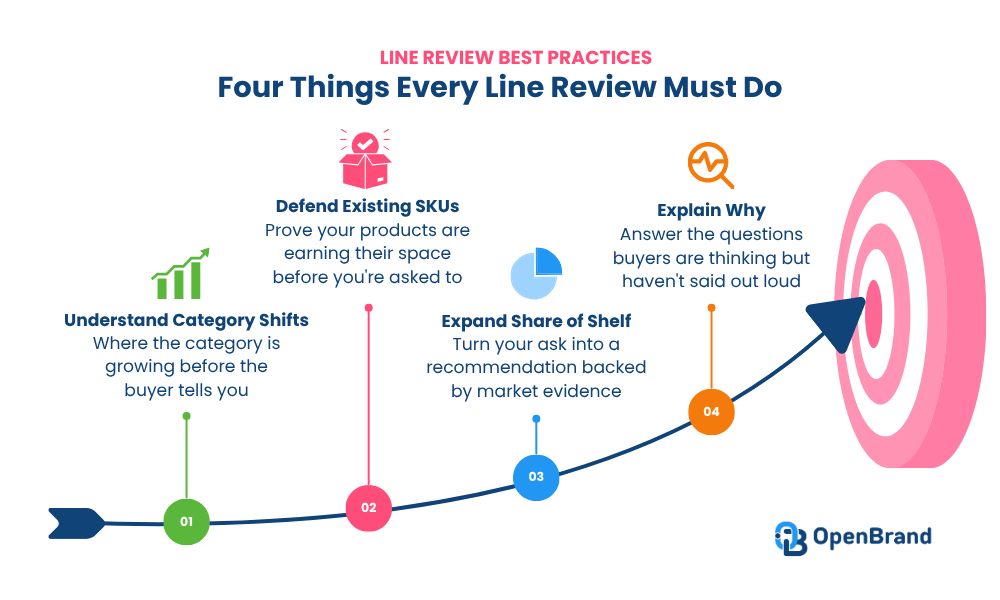
Line Review Best Practice #1: Understand Category Shifts
Understanding category shifts means showing where demand is moving, which segments are growing and plateauing, and how shopper behavior is evolving. Buyers need to understand the category before they evaluate any individual brand. If you bring that context, you control the starting point of the conversation.
Market share and industry trend data give you that view. They show where the category is growing, which segments are outpacing the rest, and where this retailer is under-indexed relative to the market. It’s the picture of the category that the buyer’s own POS data can’t provide.
If you’re still building out your overall preparation approach, this guide covers how to structure your full PLR presentation.
Line Review Best Practice #2: Defend Existing SKUs
Defending your SKUs means proactively proving they’re earning their space. Buyers evaluate every item through the lens of productivity, and the brands that keep their shelf space come in ready to show their products are working.
Draw, conversion, and pricing data make the case for what’s already on shelf. When you can show that your products are driving traffic, converting at a competitive rate, and supporting the retailer’s margin goals, decreases in shelf space becomes a much harder argument to make.
Line Review Best Practice #3: Confidently Recommend Expanding Share of Shelf
A request for more space without market support reads as self-serving. A recommendation backed by external demand data, showing a real gap in the current assortment and a clear shopper need your product fills, reads as category expertise.
Assortment gap analysis is where the line review shifts from defense to offense. You’re showing the buyer what’s missing from the current set, what shopper demand looks like for those gaps, and which of your products are positioned to capture it. That’s a fundamentally different conversation.
This is where a product library and SKU-level data, both complete with rich product specs, is key to figuring out whitespace and opportunity in the market.
Not to mention this is the kind of data that will turn line reviews into an easy decision for the retailer. It’s about creating a win-win partnership, backed by data, between your brand and your buyers.

Line Review Best Practice #4: Explain Why
Buyers are asking “why” even when they don’t say it out loud. Why is this segment growing? Why does this SKU belong here? Why will this assortment hold up next year? The brands that answer it proactively get treated as partners, not vendors.
Trend and innovation data is what lets you answer those questions with confidence. It shows retailers that the assortment you’re recommending will be competitive 18 months from now, accounting for regulatory shifts, emerging features, and segment growth trajectories. That forward-looking view is what separates a vendor pitch from a category partnership.
How External Data Wins Line Reviews
When your data maps cleanly to each of those four objectives, you stop defending your position and start driving the agenda.
Here’s the problem most teams run into: they spend months building their internal story and show up to the line review with a clean deck. The buyer nods, asks a few questions, and moves on.
That’s because internal data alone doesn’t answer the retailer’s most pressing question: Compared to what?
External data fills that gap. When you can show how your conversion rate compares to the rest of the category at that specific retailer, how your brand’s walk rate stacks up against competitors, or how your segment is trending relative to the market, you’re giving the buyer something they can’t get anywhere else in the room.
That’s your edge: the data that gives the retailer a reason to act.
The brands that win shelf space in competitive reviews aren’t always the ones with the biggest promotional budget or the longest relationship. They’re the ones who showed up with a point of view that matched the retailer’s priorities, with the numbers to back it.
It’s about creating an easy, compelling case for your buyer that makes it advantageous on both sides of the conversation to green light more shelf space.

You Control the Story. We Bring the Market Data.
You know your products, your category, and your account relationship better than anyone. No data partner changes that. What external data does is give you the market context to make your story defensible through the category view, the competitive dynamics, and the shopper behavior patterns that your internal data can’t capture on its own.
OpenBrand gives durable goods brands the market, retailer, and category intelligence they need to build that case. From retail share and conversion benchmarks to assortment gap analysis and trend context, we bring the external signals that connect your recommendations to what’s actually happening in the market.
The result: a line review where you’re driving the category conversation, not just defending your position in it. That’s the difference between leaving with more shelf space and leaving with a follow-up email asking you to justify your numbers.
When you control the conversation, you control the outcome.
Get Your Line Review Readiness Report
Want to see how this comes together in practice? We’ve built a Line Review Readiness Report that maps the right data to the right narrative, so you can walk into your next review with a complete story, not just a slide deck.
You can preview and download our template here.
If you want to unlock the data to fill it out, connect with our team to get the conversation started. The completed report is free. Just let us know what retailers and products are most important to you. We’ll generate a custom report and setup time to walk you through the data.
FAQ
What is a line review?
A line review or category/product line review (PLR) is an annual or semi-annual meeting between a brand and a retail buyer where the brand presents performance data to defend existing SKUs and negotiate shelf space and assortment for the upcoming period. The brands that come in with the most complete data (internal and external) consistently leave with better outcomes.
What data should you bring to a line review?
The strongest line review presentations combine internal data (sell-through, margin, promotional ROI) with external market data including category share, segment trends, assortment gap analysis, and conversion benchmarks. Internal data shows how your products performed. External data shows why your recommendations are right for the category.
OpenBrand gives durable goods brands access to that external layer, from retail share and conversion benchmarks to assortment gap analysis and trend context.
How do you win a line review?
Winning a line review comes down to answering four things: demonstrating category shifts, defending existing SKUs with performance data, making a market-backed case for expanded shelf space, and explaining why the assortment you’re recommending will be competitive going forward.
OpenBrand’s Line Review Readiness Report is built around exactly that framework, providing exclusive and proprietary market data that sets brands apart from their competitors and elevates line review success.
What is the difference between internal and external data in a line review?
Internal data is what you track in your own systems: sales velocity, margin, inventory.
External data comes from the broader market and includes retail share, shopper conversion rates, and category trend signals. External data gives retailers the “compared to what” context that internal data alone can’t provide.
OpenBrand specializes in that external layer for durable goods brands preparing for retailer reviews.

Outdoor Cooking Market Insights: Top Grill Brands, Share & Retail Trends
As consumers head into another grilling season, the outdoor cooking market continues to evolve around three major forces:
- Value-driven purchasing behavior
- Intensifying retailer competition
- Increasing brand fragmentation
Using data from OpenBrand’s latest Outdoor Cooking Market Insights report [download now!], we analyzed how consumers are shopping the outdoor cooking category, where retailers are winning and losing share, and which top grill brands are gaining traction.

The outdoor cooking market referenced here includes traditional grills, griddles, and smokers, reflecting how consumers shop across outdoor cooking products today.
While the data reflects Q4 2025, the trends highlighted below represent the current direction of the outdoor cooking market heading into 2026.
SOURCE: All data insights in this article covers Q4 2025 data within the OpenBrand Total Market Insights Outdoor Cooking category. This includes includes traditional bbq grills, griddles, and smokers.
Summary: Outdoor Cooking Market Key Stats
- Walmart leads outdoor cooking retailer share at 28.8%
- Blackstone ranks as the top grill brand by unit share, followed by Weber and Traeger
- Products priced between $200 and $399 account for the largest share of sales
- Replacement purchases remain the primary driver of demand
- Price and quality continue to be the top purchase drivers for consumers
- Millennials represent the largest outdoor cooking buyer segment
- Retail competition remains tight, with shoppers frequently comparing multiple retailers before purchasing
Who are the top retailers in the outdoor cooking market?
According to OpenBrand’s Q4 2025 market data, retail leadership in the outdoor cooking market remains concentrated among a few dominant players, but competition between them is tightening. Walmart leads in unit share, but the narrow gap between the top three retailers means even small shifts can materially impact the market.
Top Retailers in the Outdoor Cooking Market (Unit Share)
| Rank | Outdoor Cooking Retailer | Unit Share (%) |
| 1 | Walmart | 28.8% |
| 2 | Home Depot | 27.4% |
| 3 | Lowe’s | 26.5% |
| 4 | Amazon | 11% |
| 5 | Ace Hardware | 5.1% |
Source: OpenBrand Outdoor Cooking Market Insights, Q4 2025
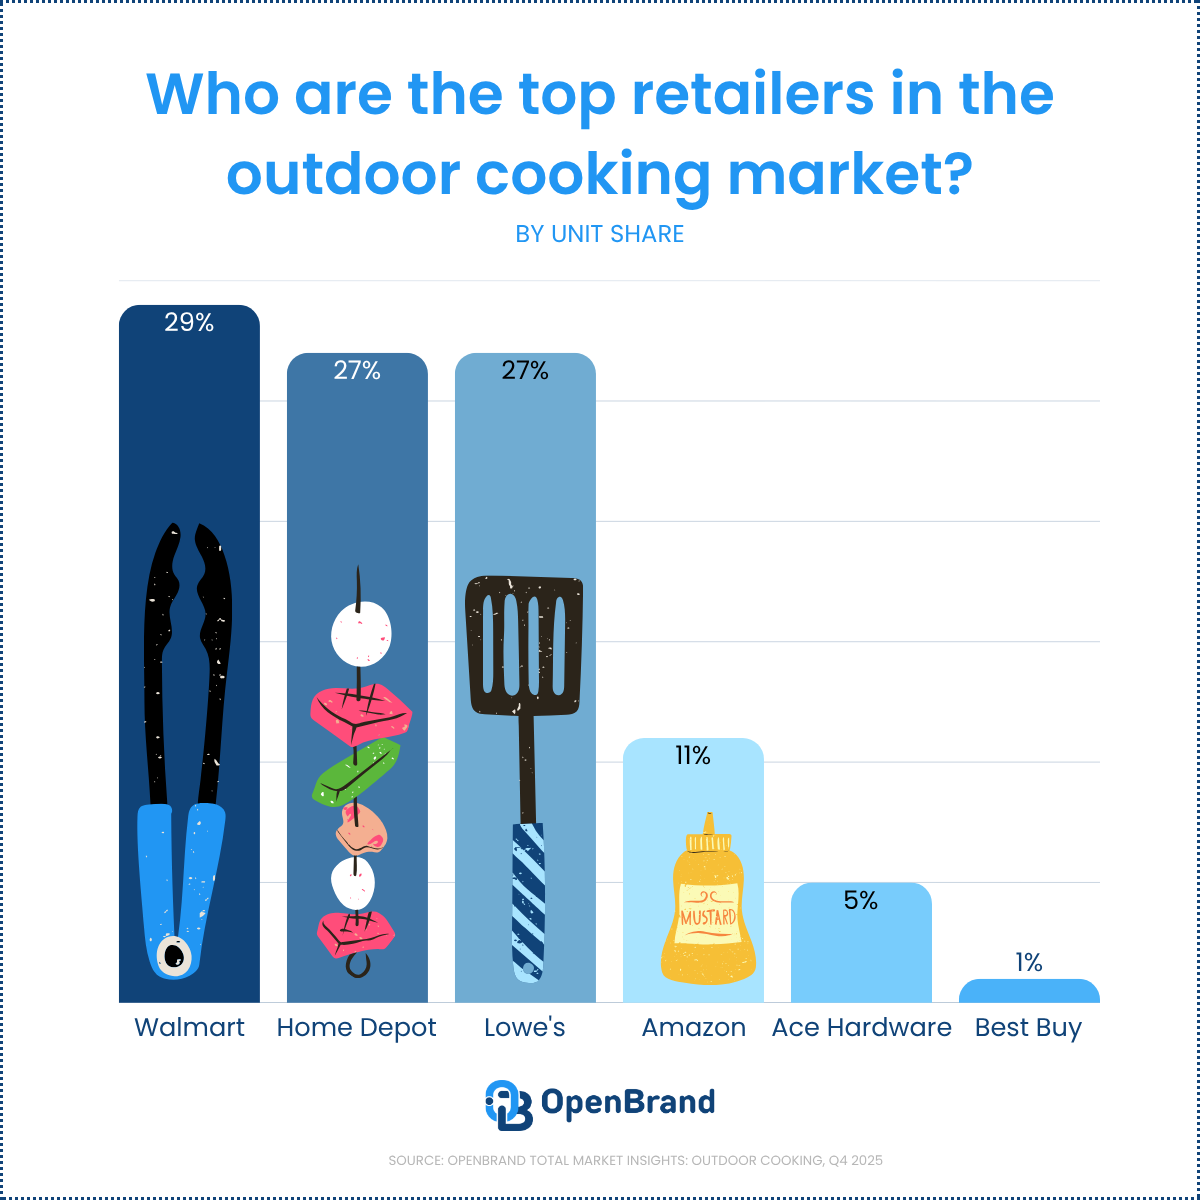
OpenBrand’s Outdoor Cooking Trend Insights
The outdoor cooking market is becoming increasingly competitive at the retailer level because share is tightly concentrated among the leading players. This makes pricing strategy, promotions, assortment, and conversion efficiency critical levers for growth.
As consumers continue researching products across multiple retailers before purchasing, retailers are competing less on simple availability and more on overall shopping experience and conversion.
For more outdoor cooking retailer insights, including retailer leakage, conversion trends, and shopper behavior data, download the full infographic.
Outdoor cooking retailers are competing more aggressively for shopper conversion
In a market where consumers actively compare retailers before making a purchase, the ability to convert high-intent shoppers can materially impact market share performance.
Q4 2025 Outdoor Cooking Retailer Draw Rates
| Outdoor Power Retailer | Draw Rate | Close Rate |
| Walmart | 35% | 71% |
| Home Depot | 34% | 64% |
| Lowe’s | 33% | 54% |
| Amazon | 13% | 57% |
| Ace Hardware | 8% | 52% |
Source: OpenBrand Outdoor Cooking Market Insights, Q4 2025
Walmart leads in both drawing and converting shoppers, while Home Depot and Lowe’s remain highly competitive in closing high-intent consumers.
Want deeper insights into retailer conversion and shopper leakage trends? Download the infographic for the full breakdown.
OpenBrand’s Outdoor Cooking Trend Insights
Consumers shopping for outdoor cooking products are increasingly comparison-driven, evaluating:
- price
- quality
- features
- retailer experience
- brand reputation
This creates a market where traffic alone is not enough. Retailers that convert efficiently and reduce shopper leakage are better positioned to gain share.
Shopper leakage reveals how directly retailers compete
Retail competition becomes even clearer when looking at what happens when a retailer loses a sale – and who gains their lost shoppers. This is uncovered through OpenBrand’s proprietary retail leakage analysis data.
When Walmart does not close a shopper:
- Home Depot captures the largest share of those lost shoppers
- Lowe’s captures the next largest portion
- Amazon captures a smaller share
This highlights how interconnected the outdoor cooking market has become.
OpenBrand’s Outdoor Cooking Trend Insights
Consumers rarely shop a single retailer before purchasing a grill, griddle, or smoker. Instead, many move between retailers during the decision process, comparing products, pricing, and perceived value before making a final purchase.
This makes shopper retention and final-stage conversion increasingly important to maintaining market share.
Value-driven pricing continues defining the outdoor cooking market
According to OpenBrand’s market data, retail competition is closely tied to how consumers approach pricing across outdoor cooking products. The majority of demand continues to concentrate in the mid-tier price range.
Outdoor Cooking Market by Price Range (Unit Share)
| Price Range | Share of Units |
| $199 or less | 22% |
| $200 to $399 | 42% |
| $400 to $599 | 21% |
| $600+ | 16% |
Source: OpenBrand Outdoor Cooking Market Insights, Q4 2025
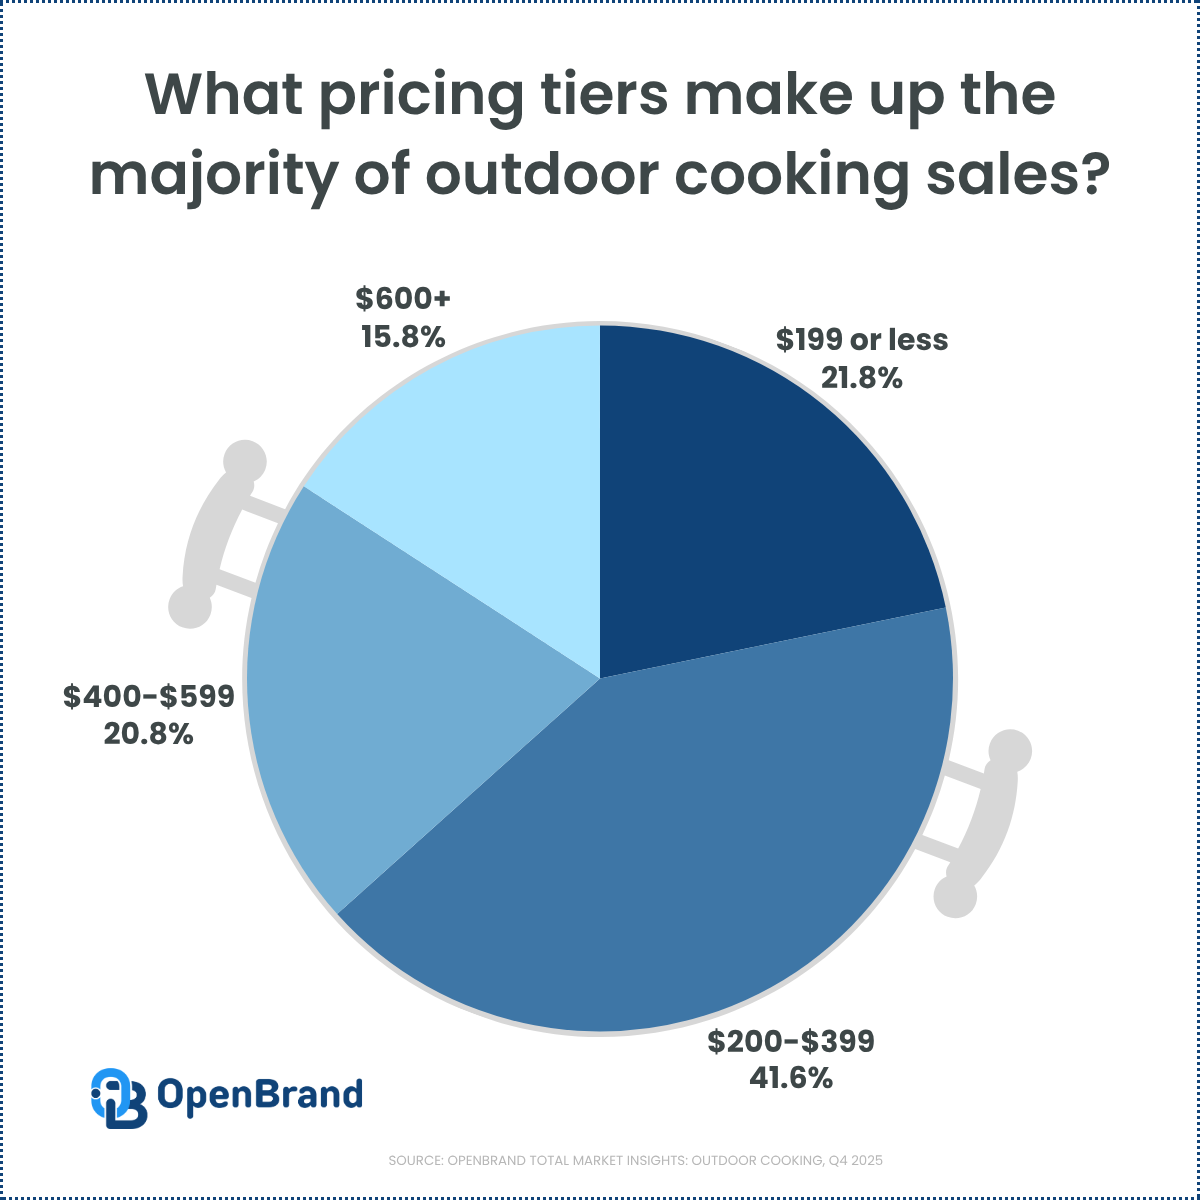
OpenBrand’s Outdoor Cooking Trend Insights
The outdoor cooking market remains fundamentally value-driven rather than purely premium.
Consumers are balancing:
- affordability
- perceived quality
- desired features
- long-term value
This behavior helps explain why mid-tier products continue driving the majority of category volume.
Purchase drivers reinforce a value-first market
This pricing behavior becomes even more visible when looking at purchase drivers.
Top Purchase Drivers for Outdoor Cooking Brands
| Driver | Share |
| Price | 36% |
| Quality | 35% |
| Brand Name | 27% |
| Features | 25% |
Source: OpenBrand Outdoor Cooking Market Insights, Q4 2025
In addition, the leading trigger for entering the market remains replacement demand, often because an older product broke or required service.
OpenBrand’s Outdoor Cooking Trend Insights
Because much of the category is replacement-driven, consumers tend to enter the market with highly practical purchase intent.
This increases the importance of:
- competitive pricing
- trusted quality
- retailer availability
- clear feature differentiation
Brands that communicate value effectively are better positioned to win in this environment.
Top grill brands ranked by market presence
Who leads outdoor grilling market share by brand in Q4 2025?
As consumers become more value-conscious, competition among the top grill brands continues intensifying.
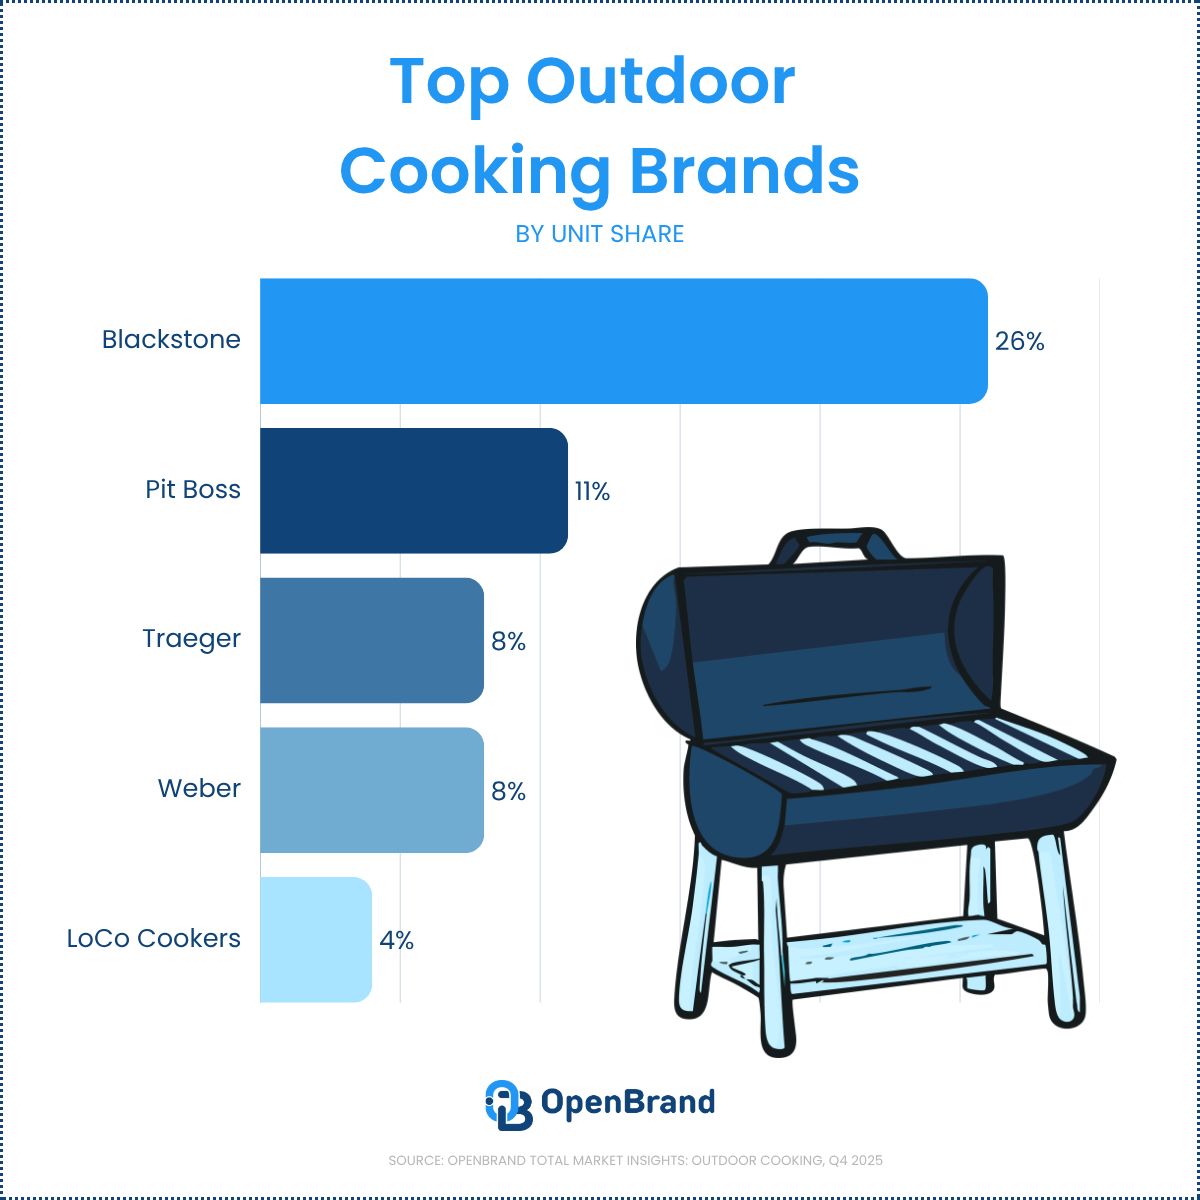
Leading brands in the outdoor cooking market include:
- Blackstone
- Traeger
- Pit Boss
- Weber
- LoCo Cookers
Brand leadership within the outdoor cooking market continues shifting as consumers increasingly compare grills, griddles, and smokers together during the purchase process.
Top Grill Brands Ranked by Outdoor Cooking Market Share
| Rank | Outdoor Cooking Brand | Unit Share |
| 1 | Blackstone | 26% |
| 2 | Weber | 8% |
| 3 | Traeger | 8% |
| 4 | Pit Boss | 11% |
| 5 | LoCo Cookers | 4% |
Source: OpenBrand Outdoor Cooking Market Insights, Q4 2025
At the same time, the category remains highly fragmented, with many smaller brands competing for shelf space and consumer attention.
For more insights into top grill brands (including dollar share breakdown), share trends, product launches, and competitive positioning, download the full infographic.
OpenBrand’s Outdoor Cooking Trend Insights
Blackstone’s continued leadership reflects the growing influence of griddles within the broader outdoor cooking market, while legacy brands like Weber and Traeger continue competing through brand recognition, product breadth, and premium positioning.
At the same time, fragmentation across the category remains high, creating opportunities for challenger brands to gain visibility through pricing, innovation, and retailer assortment strategy.
Product strategy is diverging across brands
As competition increases, brands are taking different approaches to growth. The latest data shows:
- variation in discount depth across brands
- differences in pricing strategies
- uneven pace of product introductions
OpenBrand’s Outdoor Cooking Trend Insights
Brands appear to be following one of two primary strategies:
- protecting margins through premium positioning
- driving growth through promotions and broader assortment
This divergence highlights a market still balancing profitability and share growth.
Outdoor Cooking Shopper Demographics
Younger consumers continue shaping the future of outdoor cooking
OpenBrand’s census-balanced data provides a snapshot of today’s outdoor cooking buyer. Shifts in who is buying are influencing the long-term direction of the category. Millennials and Gen X continue to dominate purchases, while Gen Z steadily grows its share of the market.
Outdoor Cooking Purchases by Generation
| Generation | Share of Purchases |
| Gen Y | 36% |
| Gen X | 31% |
| Baby Boomers | 17% |
| Gen Z | 15% |
| Matures | 1% |
Source: OpenBrand Outdoor Cooking Market Insights, Q4 2025
OpenBrand’s Outdoor Cooking Trend Insights
Younger consumers are influencing:
- product expectations
- digital research behavior
- pricing sensitivity
- feature prioritization
As their purchasing power grows, brands and retailers will likely continue adapting toward more digitally informed and value-conscious shopping behavior.
What this means for the outdoor cooking market
Outdoor Cooking in 2026
The latest outdoor cooking market data points to a category that remains stable in demand, but increasingly competitive in execution.
Several trends are shaping the market simultaneously:
- Consumers are concentrating demand in value-oriented price tiers
- Retailers are competing heavily on conversion and shopper retention
- Brands are responding through pricing strategy, promotions, and innovation
- Younger buyers are influencing long-term category direction
Together, these forces define the current direction of the outdoor cooking market and where the greatest opportunities for growth may exist moving forward.
Want the Full Outdoor Cooking Market Report?
The trends highlighted here represent only a portion of the latest outdoor cooking market data available through OpenBrand.
Download the full infographic to explore deeper insights into:
- outdoor cooking market share
- top grill brands and rankings
- retailer performance
- pricing and promotions
- product launches and SKU trends
- consumer shopping behavior

To learn how OpenBrand can help your business stay ahead of market shifts, get in touch with our team.
FAQ: Outdoor Cooking Market Trends
Outdoor Cooking in 2026
What are the top grill brands right now?
Blackstone, Weber, Traeger, Pit Boss, and LoCo Cookers are among the leading brands in the outdoor cooking market based on OpenBrand’s Q4 2025 data.
What price range dominates the outdoor cooking market?
According to OpenBrand’s Q4 2025 data, products priced between $200 and $399 account for the largest share of unit sales.
Which retailer has the largest outdoor cooking market share?
According to OpenBrand’s modeled MarketShare data, Walmart leads retailer unit share, followed closely by Home Depot and Lowe’s.
What is driving outdoor cooking purchases?
According to OpenBrand’s MindShare consumer survey data, replacement demand remains the leading purchase trigger, while price and quality are the top purchase drivers when selecting which brand to purchase.

Outdoor Power Equipment Market Share: Q4 2025 Trends & Rankings
The Outdoor Power Equipment (OPE) market closed out 2025 with noticeable shifts in how share is won and defended across retailers and brands.
Q4 is always a defining quarter for the category. Seasonal demand, aggressive promotions, and heightened competition create conditions where even small execution differences can lead to meaningful share movement.
Our public MarketSignal dashboard shows that while category leaders remain firmly in place, momentum is beginning to shift, particularly as Amazon gains traction and value-driven brands continue to scale.
Key Takeaways
According to OpenBrand’s Q4 2025 OPE market intelligence data:
- Walmart continues to attract significant shopper traffic and is gaining share, but its draw rate still outpaces its close rate, signaling additional opportunity in conversion, assortment, and fulfillment.
- Ego continues to outperform expectations, maintaining a top-tier position in dollar share despite more limited consumer awareness relative to legacy brands.
- Home Depot and Lowe’s remain the defining forces in OPE, supported by Ryobi’s scale at Home Depot and a strong mix of Craftsman and Ego at Lowe’s.
- Women and Millennials are playing a larger role in shaping demand, influencing growth in battery-powered equipment, smart features, and more accessible product positioning.
Explore these and the rest of our latest insights or dive into the dashboard to see how the market is moving.
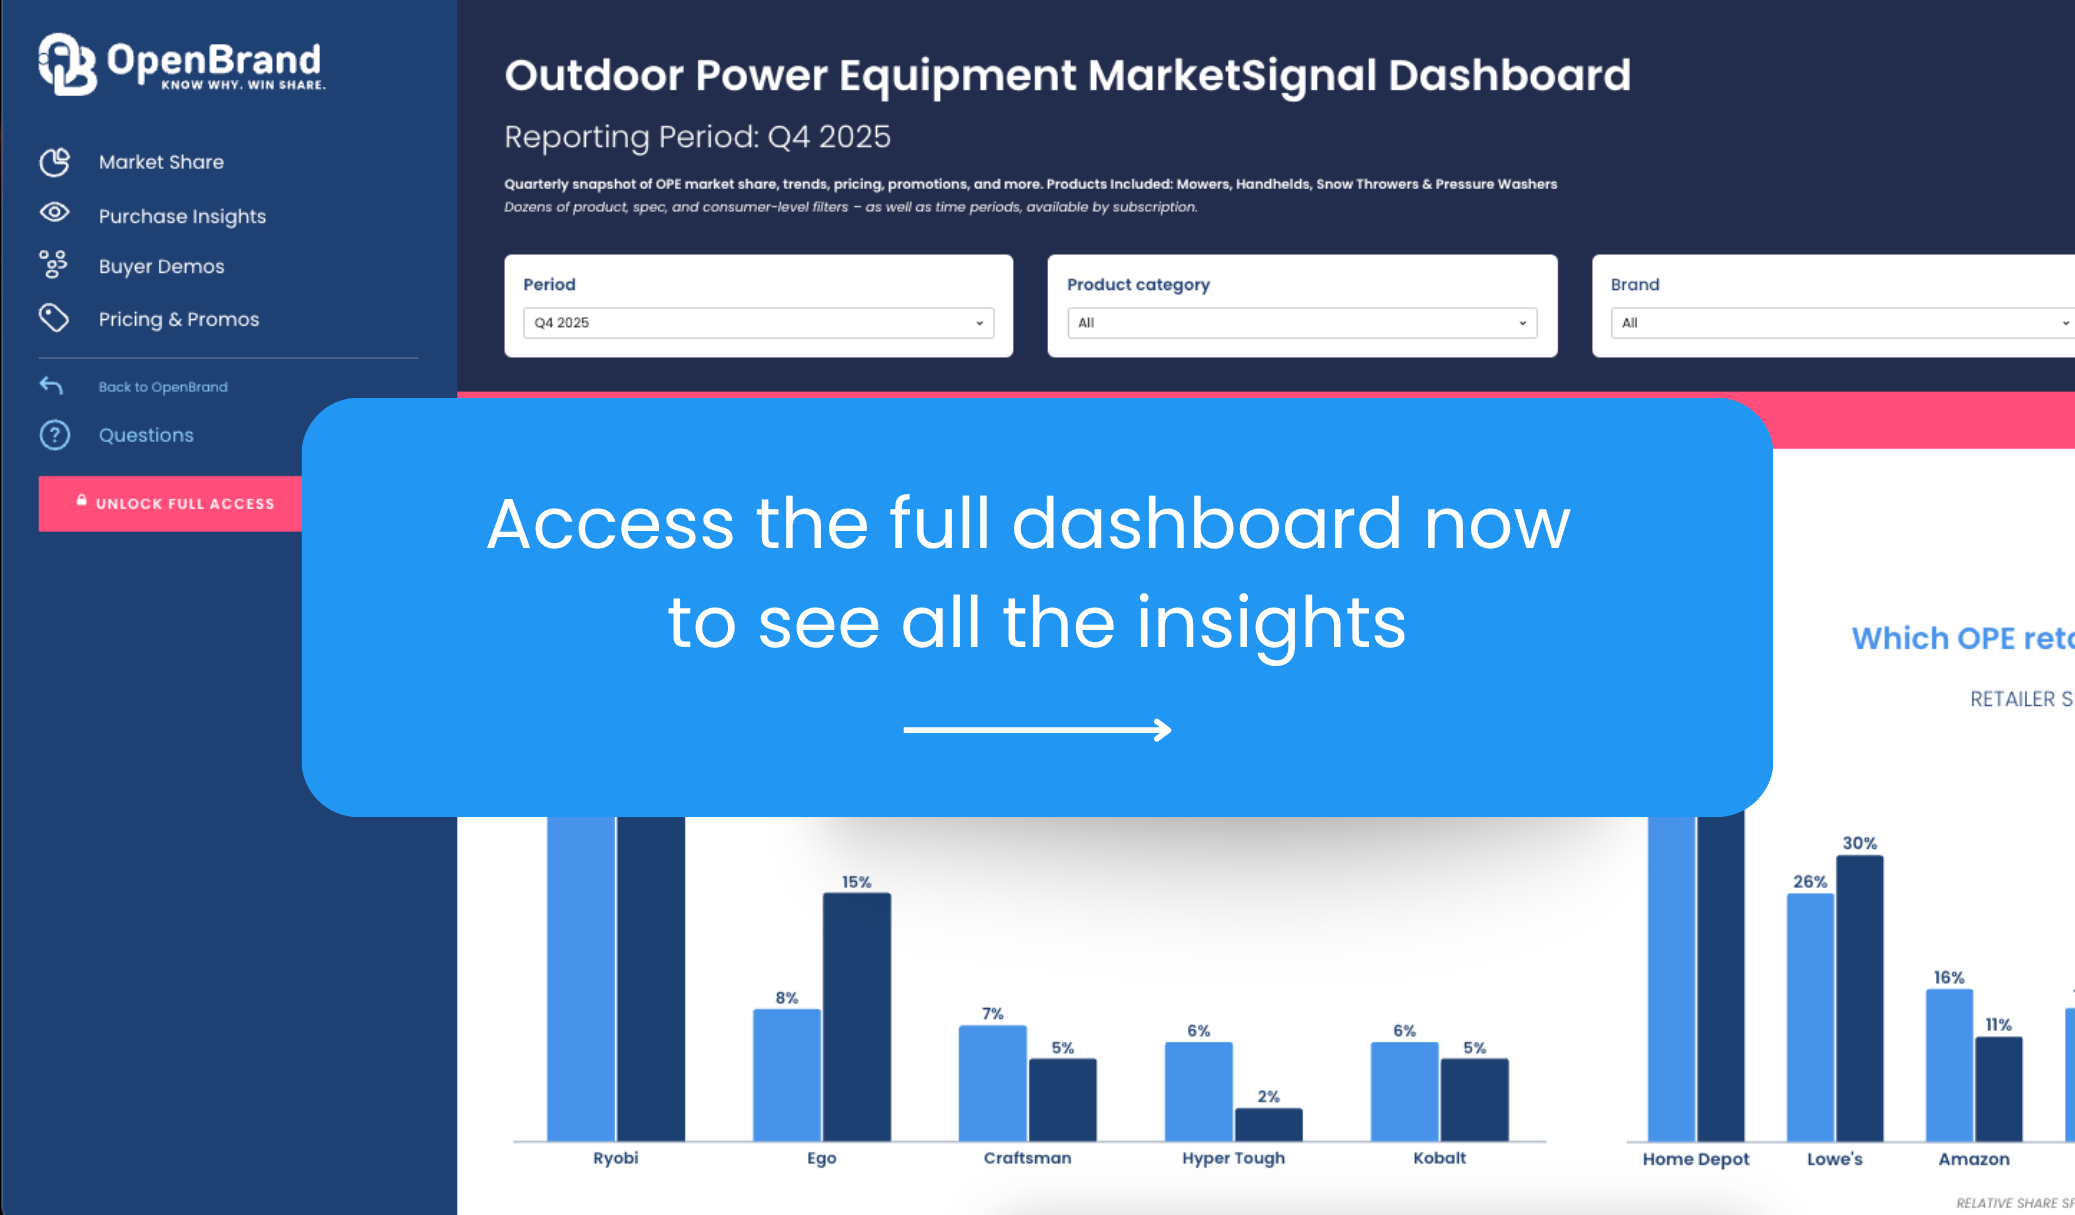
SOURCE: All data insights in this article cover OpenBrand Q3-Q4 2025 market intelligence data within an OpenBrand aggregate category of several products including Mowers, Handhelds, Snow Throwers and Pressure Washers.
Who are the top Outdoor Power Equipment retailers by market share?
According to OpenBrand’s Q4 2025 market intelligence data, the top OPE retailers are Home Depot and Lowe’s, leading in both unit and dollar share, with Amazon gaining ground in Q4.
Q4 performance points to a relatively stable competitive landscape, with incremental movement rather than major disruption across top retailers. Check out the retailer share growth from Q3 to Q4 2025, as well as the quarter-over-quarter (QoQ) percentage point (ppt) change below.
Note: OpenBrand’s share split is based on our retailer panel, which currently consists of Home Depot, Lowe’s, Amazon, Walmart, Ace Hardware, Best Buy, and Tractor Supply Co. These retailers make up a majority of non-individual dealer sales in the OPE industry.
Outdoor Power Equipment Retailer Unit Share Winners
| OPE Retailer | Q3 2025 Unit Share | Q4 2025 Unit Share | QoQ Change |
| Home Depot | 37.0% | 36.8% | -0.2 ppts |
| Lowe’s | 26.8% | 25.8% | -1 ppts |
| Amazon | 15.5% | 15.8% | +0.3 ppts |
| Walmart | 13.6% | 14.1% | +0.5 ppts |
| Ace Hardware | 5.9% | 6.2% | +0.3 ppts |
Outdoor Power Equipment Retailer Dollar Share Winners
| OPE Retailer | Q3 2025 Dollar Share | Q4 2025 Dollar Share | QoQ Change |
| Home Depot | 37.4% | 38.4% | +1.0 ppts |
| Lowe’s | 34.4% | 30.4% | -4.0 ppts |
| Amazon | 8.4% | 10.8% | +2.3 ppts |
| Walmart | 8.1% | 9.3% | +1.2 ppts |
| Ace Hardware | 5.3% | 9.5% | +4.2 ppts |
OpenBrand’s OPE Retailer Trend Insights
Amazon converts at the highest rate, turning efficiency into share gains. Amazon’s performance in Q4 highlights the importance of conversion over reach. With the highest close rate among major retailers (71.6%), it is able to translate a smaller shopper base (14.3% draw rate) into steady gains in both unit and dollar share. Its strength during key promotional periods further reinforces its role as a high-efficiency channel in the category.
Home Depot leads with scale and consistency across the funnel. Home Depot remains the most complete performer in OPE, combining the highest shopper reach (38% draw rate) with a strong close rate (68.3%). This balance allows it to maintain leadership in unit share while also expanding dollar share in Q4. The data points to continued strength in both traffic generation and higher-value product mix.
Lowe’s faces dollar share pressure despite stable traffic and units. Lowe’s held relatively steady in unit share and continues to attract strong shopper consideration, but its decline in dollar share (-4.0 pts QoQ) signals pressure in pricing or product mix. While it remains a key destination for shoppers, particularly those leaving Home Depot, Q4 results suggest challenges in maintaining value per transaction during a highly promotional period.
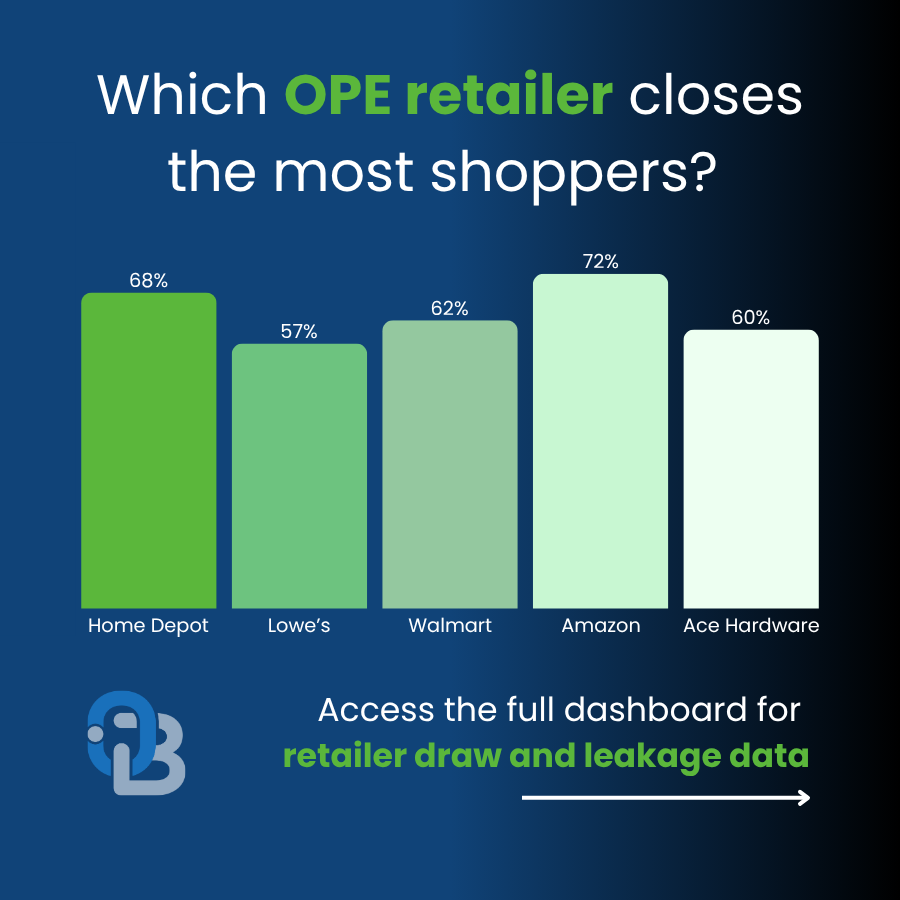
Outdoor Power Equipment Retailer Draw Rates
| Retailer | Q4 2025 Draw Rate | Q4 2025 Close Rate |
| Home Depot | 38% | 68% |
| Lowe’s | 33% | 57% |
| Walmart | 18% | 62% |
| Amazon | 14% | 72% |
| Ace Hardware | 7% | 60% |
OpenBrand’s OPE Retailer Trend Insights
Q4 continues to highlight the gap between attracting shoppers and converting them.
Walmart remains one of the most frequently considered retailers but continues to trail in conversion relative to its reach. Amazon, by contrast, converts at one of the highest rates, turning a smaller audience into stronger share gains.
Home Depot continues to lead in both reach and close rate, reinforcing its position as the most balanced retailer in the category. Lowe’s remains a critical alternative destination, particularly for shoppers who begin their journey at Home Depot.
Learn more about the impact of our leakage analysis: do you know who is winning your lost shoppers?
Who leads the Outdoor Power Equipment market share by brand?
According to OpenBrand’s Q4 2025 market intelligence data, the top three Outdoor Power Equipment brands are Ryobi, Craftsman, and Ego.
Outdoor Power Equipment Brand Unit Share Winners
| OPE Brand | Q3 2025 Unit Share | Q4 2025 Unit Share | QoQ Change |
| Ryobi | 22.2% | 23.9% | +1.8 pts |
| Craftsman | 10.2% | 9.2% | -1.0 pts |
| Ego | 7.8% | 8.4% | +0.6 pts |
| Hyper Tough | 6.1% | 5.7% | -0.4 pts |
| Kobalt | 5.1% | 5.5% | +0.4 pts |
Outdoor Power Equipment Brand Dollar Share Winners
| Outdoor Power Equipment Brand | Q4 2025 Dollar Share |
| Ryobi | 20% |
| Ego | 14.9% |
| Craftsman | 6.4% |
| Kobalt | 4.5% |
| Hyper Tough | 2.3% |
For more brand share insights, including share trend over time, access our public OPE dashboard now.
OpenBrand’s OPE Market Trend Insights
Ryobi converts scale into sustained category dominance. Ryobi continues to lead the OPE category by a wide margin, growing unit share to 23.9% in Q4 while maintaining strong conversion (72.2% close rate). Its ability to pair high consideration (12.1%) with efficient conversion reinforces its position as the default choice for many shoppers. This performance is further amplified by its exclusive alignment with Home Depot, allowing it to scale both reach and consistency across the purchase funnel.
Ego drives outsized dollar share through premium positioning. Ego continues to outperform on value, capturing 14.9% of dollar share on just 8.4% unit share. This gap highlights its strength in higher-priced products and its ability to convert shoppers seeking premium performance. While its consideration levels trail more established brands, its ability to monetize demand once in the funnel makes it one of the most efficient revenue drivers in the category.
Challenger brands compete through conversion, not consideration. Brands like DEWALT, Black & Decker, and John Deere demonstrate that high awareness is not required to win in OPE, but strong conversion is. Each posts close rates above 60%, with several exceeding 70%, indicating that when these brands enter the consideration set, they are highly competitive. Leakage data reinforces this dynamic, with DEWALT and Black & Decker capturing a meaningful share of Ryobi’s lost shoppers, signaling that value, trust, and positioning can overcome scale disadvantages at the point of purchase.
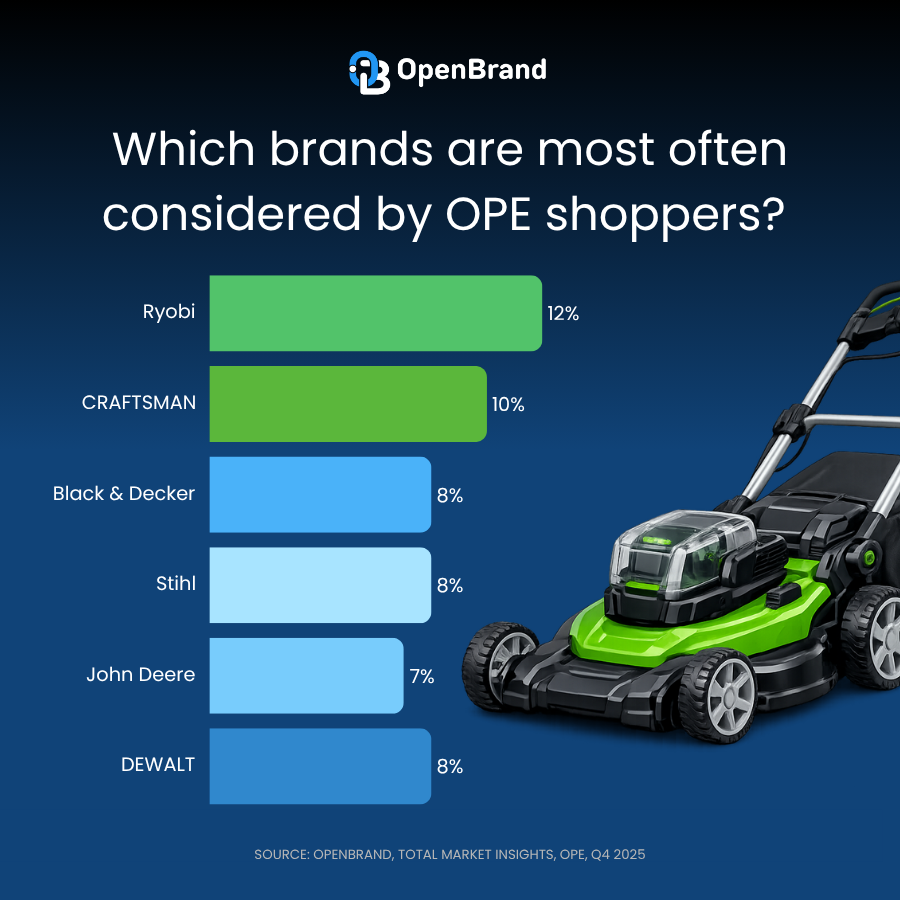
Brand Consideration Rates
When purchasing Outdoor Power Equipment, consumers consider the following three brands most often:
| Brand | Q4 2025 Consideration | Q4 2025 Close Rate |
| Ryobi | 12% | 72% |
| Craftsman | 10% | 63% |
| Stihl | 8% | 71% |
| DEWALT | 8% | 62% |
| Black & Decker | 8% | 75% |
| John Deere | 7% | 77% |
How are online and in-store sales trending for the Outdoor Power Equipment market?
According to OpenBrand’s MindShare consumer survey insights, Q4 2025, brick-and-mortar stores continued to dominate OPE sales, though online purchases have carved out nearly a third of the market:
- In-store: 69% of purchases
- Online: 31% of purchases
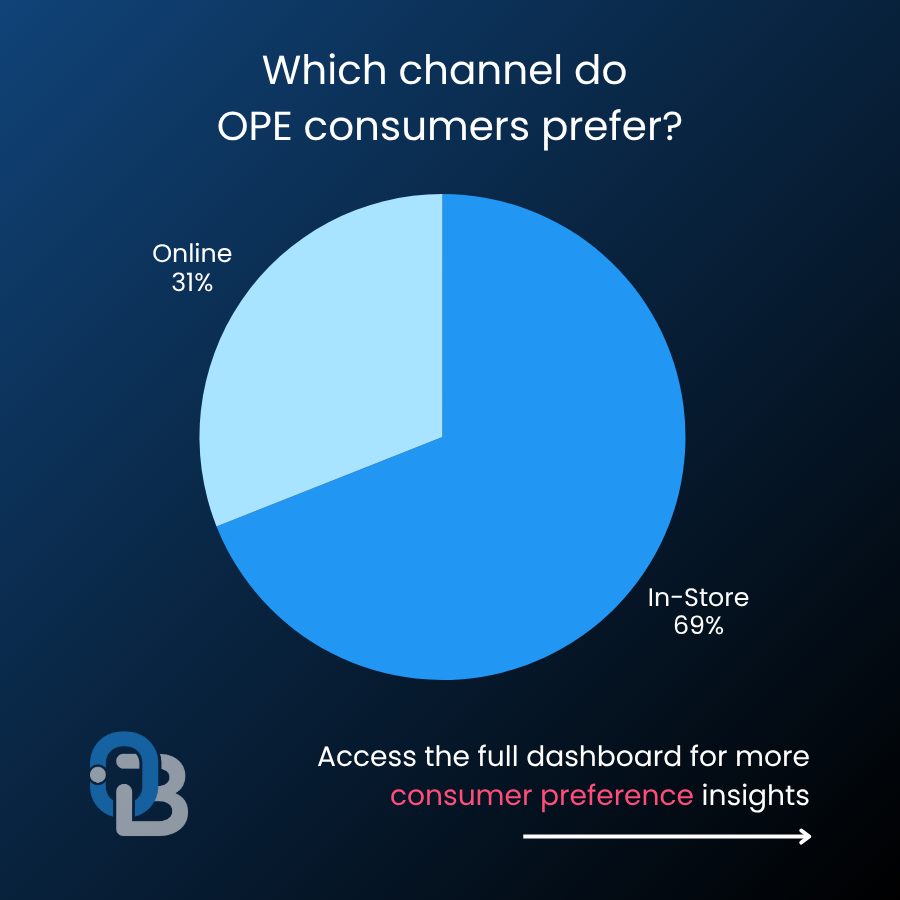
OpenBrand’s OPE Channel Trend Insights
Outdoor Power Equipment Consumer Demographics
OpenBrand’s consumer tracking survey provides a census-balanced view of who is purchasing Outdoor Power Equipment and how that profile is evolving over time.
In Q4 2025, the typical OPE buyer reflects a category still closely tied to homeownership and maintenance-driven needs:
- 76% of purchasers are homeowners, while 21% rent
- 55% of purchasers are married
- 69% of purchases were made by males only in the buying process, compared to 31% by females only
- Millennials accounted for 32% of purchases, followed by Gen X at 28%
OpenBrand’s OPE Consumer Trend Insights
OPE Purchase Drivers
Why do consumers select a specific retailer for purchase? According to OpenBrand, the most mentioned reasons for purchasing Outdoor Power Equipment at a specific retailer were:
Why consumers select a specific retailer
- Competitive price — 50.5%
- Good selection of products — 30.3%
- Convenient location — 20.7%
- Previous experience with store — 19.2%
Key OPE Pricing and Promotions Insights
Driving Share & Strategy in Q4 2025
Promotional activity played a critical role in shaping Outdoor Power Equipment performance in Q4 2025, particularly during key retail events such as Prime Big Deal Days and Black Friday/Cyber Week.
OpenBrand’s Pricing and Promotion Insights
- Promotional activity remained consistently high throughout Q4.
Across the full quarter, average promotional values stayed elevated, indicating sustained reliance on discounting rather than short-term spikes tied only to major events. - Discount rates were stable across the quarter.
Average discount percentages held within a relatively tight band week-to-week, suggesting that retailers maintained consistent promotional depth rather than increasing discounts late in the quarter. - Pricing variability was driven more by product mix than discounting changes.
While average net prices fluctuated throughout Q4, discount rates remained steady, pointing to shifts in product mix and assortment as the primary driver of pricing changes. - Promotional execution was continuous, not event-dependent.
Despite the presence of major retail moments in Q4, the data shows that promotions were deployed consistently across weeks, reinforcing that pricing strategy is an always-on lever in OPE. - Sustained discounting reinforces price sensitivity in the category.
The persistence of promotions and stable discounting levels aligns with broader purchase behavior, where price remains the top driver of retailer selection.
See more pricing and promotions data on the MarketSignal dashboard.
OPE Industry Outlook and Emerging Trends
What to expect in 2026 for the US Outdoor Power Equipment market?
The OPE market enters 2026 with continued momentum behind electrification, evolving consumer expectations, and increased pressure on retail execution. While category leaders remain stable, the drivers of growth are shifting.
OPE demand is stabilizing, but growth will hinge on the housing market.
With 75.5% of purchases tied to homeowners, the category remains closely linked to housing activity. As demand normalizes, future growth will depend heavily on homeownership trends, new construction, and ongoing property maintenance cycles.
Consumers remain highly value-focused, especially in digital channels.
With 50.5% of shoppers citing price as the primary purchase driver and discounting remaining consistent throughout Q4, value continues to dominate decision-making. This is especially evident online, where pricing transparency and comparison shopping are highest.
Cordless has effectively become the default fuel type.
The continued strength of brands like Ryobi (23.9% unit share) and Ego (14.9% dollar share) reflects growing consumer preference for battery-powered ecosystems, driven by convenience, lower maintenance, and platform compatibility.
Marketplaces are reshaping retail dynamics.
Amazon’s combination of the highest close rate (71.6%) and steady share gains highlights how marketplaces are influencing pricing expectations, fulfillment speed, and conversion behavior across the category.
Technology will define long-term competitive advantage.
As Millennials lead the category (32.4% of purchases), demand is shifting toward ease of use, connectivity, and performance. Brands that invest in battery innovation, smart features, and integrated ecosystems will be best positioned to win long-term.
Get more insight into Outdoor Power Equipment market trends
The market insights don’t stop here.
For more retail sales data, market share, and insights on the Outdoor Power Equipment industry, access the Outdoor Power Equipment MarketSignal dashboard now.

To see insights for other industries or find out how we can help power growth for your business, contact us today.
Frequently Asked Questions: Outdoor Power Equipment Market Share
Who has the highest market share in the Outdoor Power Equipment category?
According to OpenBrand’s Q4 2025 data, Home Depot leads all retailers in both unit share (36.8%) and dollar share (38.4%). Among brands, Ryobi holds the top position with 23.9% unit share and 20% dollar share — the largest of any single brand in the category.
Which OPE brand has the best close rate?
According to OpenBrand’s Q4 2025 data, John Deere leads all tracked brands with a 77% close rate in Q4 2025, followed by Black & Decker at 75% and Ryobi at 72%. These rates indicate that when shoppers consider these brands, they convert to purchase at a very high frequency.
Is Amazon gaining share in Outdoor Power Equipment? Y
es. According to OpenBrand’s Q4 2025 data, Amazon gained unit share (+0.3 ppts) and dollar share (+2.3 ppts) from Q3 to Q4 2025, and leads all retailers in close rate at 72%. Its growth reflects increasing consumer comfort with purchasing OPE online, particularly during promotional events like Prime Big Deal Days.
What percentage of OPE purchases happen online vs. in-store?
According to OpenBrand’s Q4 2025 data, in-store purchases continue to dominate at 69%, while online accounts for 31% of sales. Amazon is the primary driver of online momentum in the category.
Who is the typical Outdoor Power Equipment buyer?
Based on OpenBrand’s Q4 2025 consumer tracking survey, the typical OPE buyer is a homeowner (76%), married (55%), and male (69%). Millennials represent the largest generational segment at 32% of purchases, followed by Gen X at 28%.
What drives consumers to choose a specific retailer for OPE purchases?
According to OpenBrand’s Q4 2025 data, competitive price is the top driver, cited by 50.5% of shoppers. This is followed by good product selection (30.3%), convenient location (20.7%), and prior store experience (19.2%).
Why is Ego punching above its weight in dollar share?
According to OpenBrand’s Q4 2025 data, Ego captures 14.9% of dollar share on just 8.4% unit share in Q4 2025. This gap reflects its premium price positioning and its ability to convert shoppers who are specifically seeking high-performance, battery-powered equipment — making it one of the most revenue-efficient brands in the category.
Where can I access the full OPE market share data?
OpenBrand’s public OPE MarketSignal dashboard provides a quarterly snapshot at no cost, including brand share trends over time, draw and close rates, pricing and promotions data, and consumer demographics. To get current and historical market share data, contact OpenBrand today.

US Major Appliance Market Share: Q4 2025 Trends & Rankings
Q4 2025 closed out the year with the U.S. major appliance market still highly concentrated, as leading retailers and brands held their positions through a promotion-heavy holiday season.
Lowe’s and Home Depot continued to anchor the retail landscape, while GE, LG, Whirlpool, and Samsung remained the dominant brands. At the same time, purchasing behavior showed little structural change, with most transactions still happening in-store despite steady online participation.
Our public MarketSignal dashboard highlights how these shifts are playing out across retailer performance, brand positioning, and consumer behavior.
Keep reading for the latest Q4 insights, or explore the full dashboard for a deeper view into the market.
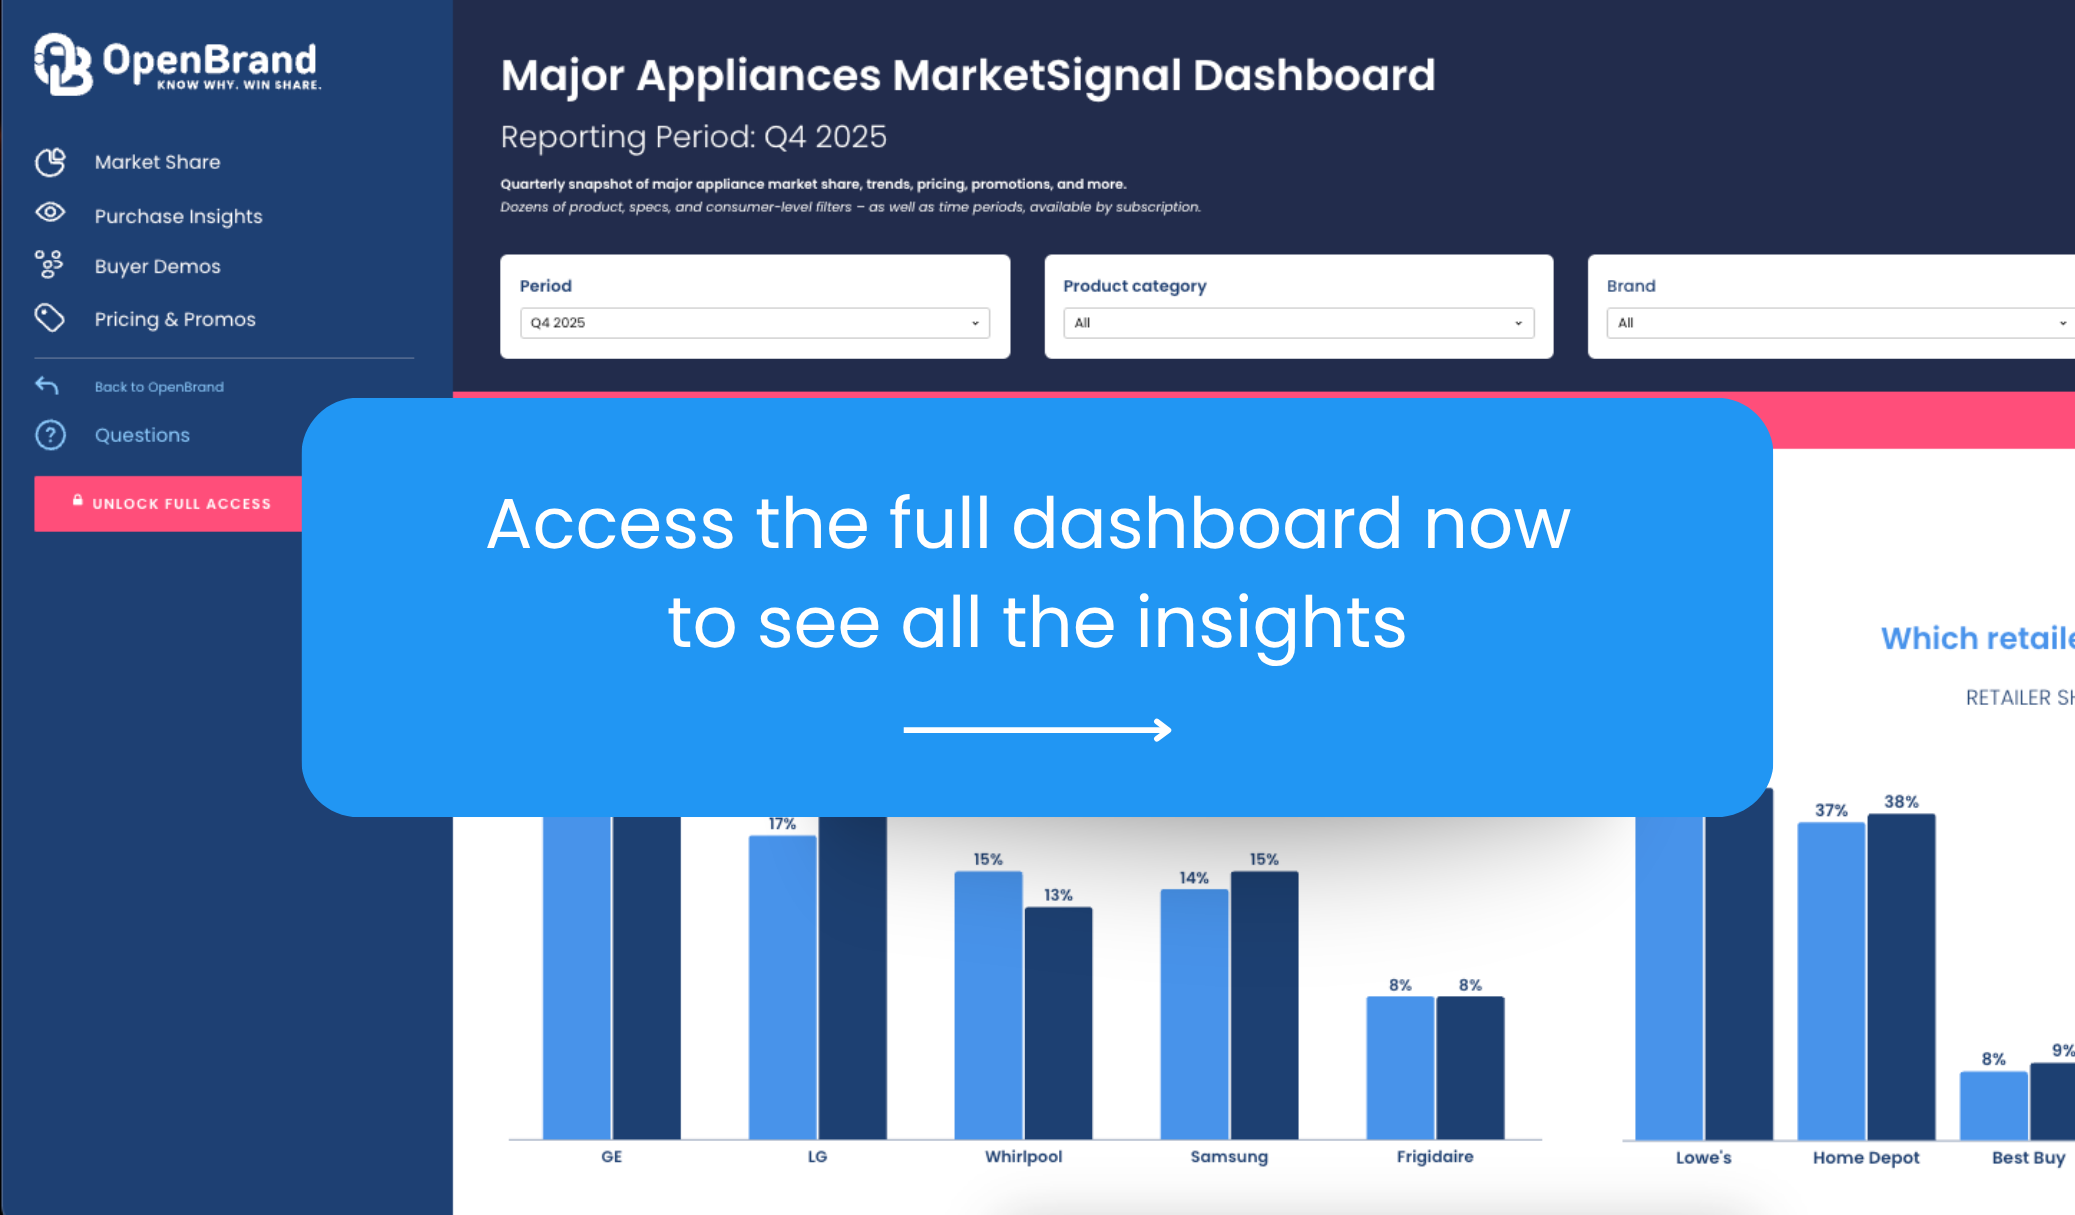
SOURCE: All data insights in this article covers Q4 2025 data within the OpenBrand Market Measurement suite. This category covers an aggregate of several products including Refrigerator, Clothes Washer, Clothes Dryer, Dishwasher, Freezer, Free-Standing Range, Cooktop, Wall Oven, Compact Refrigerator, and Built-In Range.
Key Takeaways:
Q4 2025 U.S. Major Appliance Market
- Lowe’s leads retail with 43.5% unit share (+0.7 pts QoQ) and the largest dollar share gain (+1.1 pts); Home Depot added +0.7 pts in dollar share
- Costco saw the largest unit share decline (-2.1 pts QoQ) but held dollar share better (-0.5 pts), suggesting fewer but higher-value purchases
- GE leads brand unit share at 20.1%; LG leads dollar share at 20.9%, reflecting its premium positioning
- 73.6% of appliance purchases still happen in-store, even during the peak holiday season
- LG and Samsung lead brand consideration at 34% and 32%, respectively
- Millennials and Gen X account for 63% of appliance buyers; price drives 52% of retailer selection decisions
- Frigidaire leads close rate among major brands, converting 67% of shoppers
Who are the top major appliances retailers by market share?
According to OpenBrand’s Q4 2025 market data, retail leadership remained largely unchanged in Q4, with Lowe’s and Home Depot continuing to capture the majority of appliance sales.
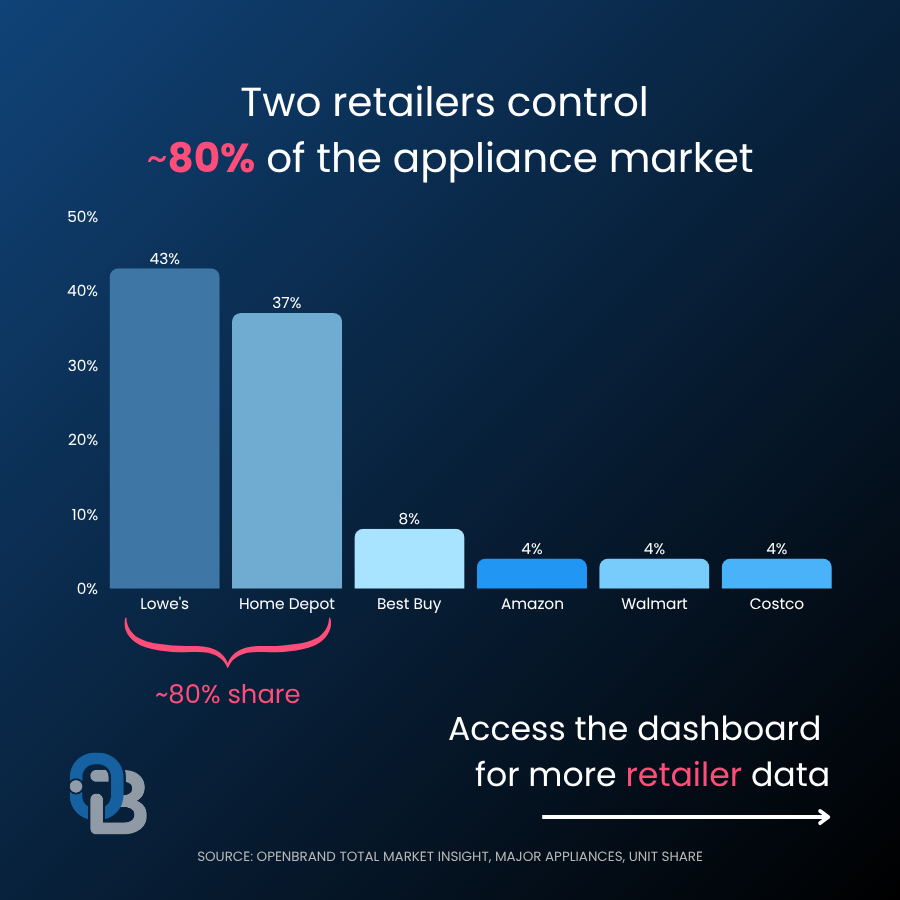
Q4 2025 Major Appliances Retailer Unit Share Winners
| Major Appliance Retailer | Q3 2025 Unit Share | Q4 2025 Unit Share | QoQ Change |
| Lowe’s | 42.8% | 43.5% | +0.7 pts |
| Home Depot | 36.3% | 36.6% | +0.3 pts |
| Best Buy | 8.4% | 7.9% | -0.5 pts |
| Amazon | 3.8% | 4% | +0.2 pts |
| Walmart | 4.1% | 4% | -0.1 pts |
| Costco | 4.5% | 4% | -2.1 pts |
Q4 2025 Major Appliances Retailer Dollar Share Winners
| Major Appliance Retailer | Q3 2025 Dollar Share | Q4 2025 Dollar Share | QoQ Change |
| Lowe’s | 40.3% | 41.4% | +1.1 pts |
| Home Depot | 38.1% | 38.1% | 0.0 pts |
| Best Buy | 9.9% | 9.2% | -0.7 pts |
| Amazon | 3.2% | 3.4% | +0.2 pts |
| Walmart | 3.1% | 3.2% | +0.1 pts |
| Costco | 5.3% | 4.8% | -0.5 pts |
Biggest QoQ Major Appliance Movers (Q3 → Q4 2025)
- Largest unit share gain: Lowe’s (+0.7 pts)
- Largest dollar share gain: Lowe’s (+1.1 pts)
- Largest unit share decline: Costco (-2.1 pts)
- Largest dollar share decline: Best Buy (-0.7 pts)
OpenBrand’s Major Appliance Trend Insight
Lowe’s delivered the strongest performance in Q4, gaining +0.7 pts in unit share and +1.1 pts in dollar share, widening its lead during the holiday period.
Home Depot saw modest unit growth (+0.3 pts) but remained flat in dollar share, suggesting steadier performance without a premium-driven lift.
Best Buy declined across both metrics, losing -0.5 pts in units and -0.7 pts in dollars, indicating softer holiday performance relative to competitors.
Among secondary retailers:
- Amazon gained modestly in both units (+0.2 pts) and dollars (+0.2 pts), continuing gradual progress in appliances
- Walmart remained largely flat, with minimal QoQ movement
- Costco shows a mixed story, with a sharp drop in unit share (-2.1 pts) but a more modest -0.5 pt decline in dollar share, suggesting fewer transactions but relatively higher average ticket sizes
Q4 2025 Major Appliance Retailer Draw Rates
According to OpenBrand’s consumer survey data, the top major appliance retailers continue to lead in consumer traffic:
- Lowe’s: 42% draw rate
- Home Depot: 41% draw rate
- Best Buy: 18% draw rate
OpenBrand’s Major Appliance Trend Insight
While Amazon, Walmart, and Costco maintain presence in the category, consumer traffic remains heavily concentrated in Lowe’s and Home Depot.
Best Buy continues to stand out on conversion, closing 66% of shoppers who consider it, compared to Lowe’s (65%) and Home Depot (59%).
This highlights a consistent pattern: secondary retailers face a traffic challenge, not a conversion problem.
For more insights on draw rates — and to see how these retailers compare in closing the consumers they brought in — quarterly major appliances MarketSignal dashboard.
Who leads the major home appliances market share by brand in Q4 2025?
Brand rankings remained stable overall, though Q4 introduced some movement driven by promotions and product mix.
Q4 2025 Major Appliances Brand Unit Share Winners
| Major Appliance Brand | Q3 2025 Unit Share | Q4 2025 Unit Share | QoQ Change |
| GE | 20.1% | 20.1% | 0.0 pts |
| LG | 17.7% | 17.1% | -0.6 pts |
| Whirlpool | 15.0% | 15.5% | +0.5 pts |
| Samsung | 14.0% | 14.2% | +0.2 pts |
Q4 2025 Major Appliances Brand Dollar Share Winners
| Major Appliance Brand | Q3 2025 Dollar Share | Q4 2025 Dollar Share | QoQ Change |
| LG | 21.7% | 20.9% | -0.8 pts |
| GE | 20.0% | 20.1% | +0.1 pts |
| Samsung | 15.2% | 15.3% | +0.1 pts |
| Whirlpool | 12.3% | 12.6% | +0.3 pts |
Biggest QoQ Major Appliance Movers (Q3 → Q4 2025)
- Largest unit share gain: Whirlpool (+0.5 pts)
- Largest dollar share gain: Whirlpool (+0.3 pts)
- Largest unit share decline: LG (-0.6 pts)
- Largest dollar share decline: LG (-0.8 pts)
OpenBrand’s Major Appliance Trend Insight
GE maintained its leadership in unit share at 20.1% (flat QoQ), reflecting consistent volume performance across retailers.
LG saw a decline in unit share from 17.7% to 17.1% (-0.6 pts), but remains the leader in dollar share at 20.9%, despite a -0.8 pt QoQ decline from 21.7%. This reinforces LG’s premium positioning, even as it faced some pressure during a highly promotional quarter.
Whirlpool delivered the strongest unit share growth, increasing from 15.0% to 15.5% (+0.5 pts), and also gained in dollar share from 12.3% to 12.6% (+0.3 pts), indicating improved momentum in value-oriented segments.
Samsung posted moderate gains in both metrics, with unit share rising from 14.0% to 14.2% (+0.2 pts) and dollar share increasing from 15.2% to 15.3% (+0.1 pts), reflecting stable performance through Q4.
Overall, Q4 shows a slight shift toward value-driven growth, with Whirlpool gaining share while premium leaders like LG experienced modest declines.
Brand Consideration Rates
When purchasing major appliances, consumer consideration remains concentrated among a few key brands. OpenBrand’s Q4 2025 survey data shows:
| Major Appliance Brand | Q3 2025 Brand Consideration Rate | Q4 2025 Brand Consideration Rate |
| Samsung | 33% | 34% |
| LG | 35% | 32% |
| GE | 28% | 26% |
| Whirlpool | 28% | 27% |
OpenBrand’s Major Appliance Trend Insight
- Frigidaire stands out for efficiency. While considered by just 9% of shoppers, it converted 67% of those into buyers, the highest close rate among major brands.
- LG and Samsung continue to lead at the top of the funnel, while GE and Whirlpool maintain strong presence through the middle of the purchase journey.
- Samsung is the only brand seeing growth in QoQ consideration.
Discover the factors — from pricing dynamics to promotional activity — influencing lower conversion rates in our latest quarterly major appliances MarketSignal dashboard.

How are online and in-store sales trending for the Major Appliance market?
Channel mix remained largely consistent in Q4, with physical retail continuing to dominate. According to OpenBrand’s Q4 2025 data, in-store still accounts for nearly three-quarters of all appliance purchases.
| Major Appliance Purchase Channel | Q3 2025 | Q4 2025 | QoQ Change |
| In-Store | 74.1% | 73.6% | -0.5 pts |
| Online | 25.9% | 26.4% | +0.5 pts |
OpenBrand’s Major Appliance Trend Insights
Online purchases increased slightly in Q4, but the shift remains gradual. Even during peak holiday shopping, the majority of appliance purchases took place in-store.
The category continues to rely on physical retail due to delivery logistics, installation requirements, and the need for in-person product evaluation.
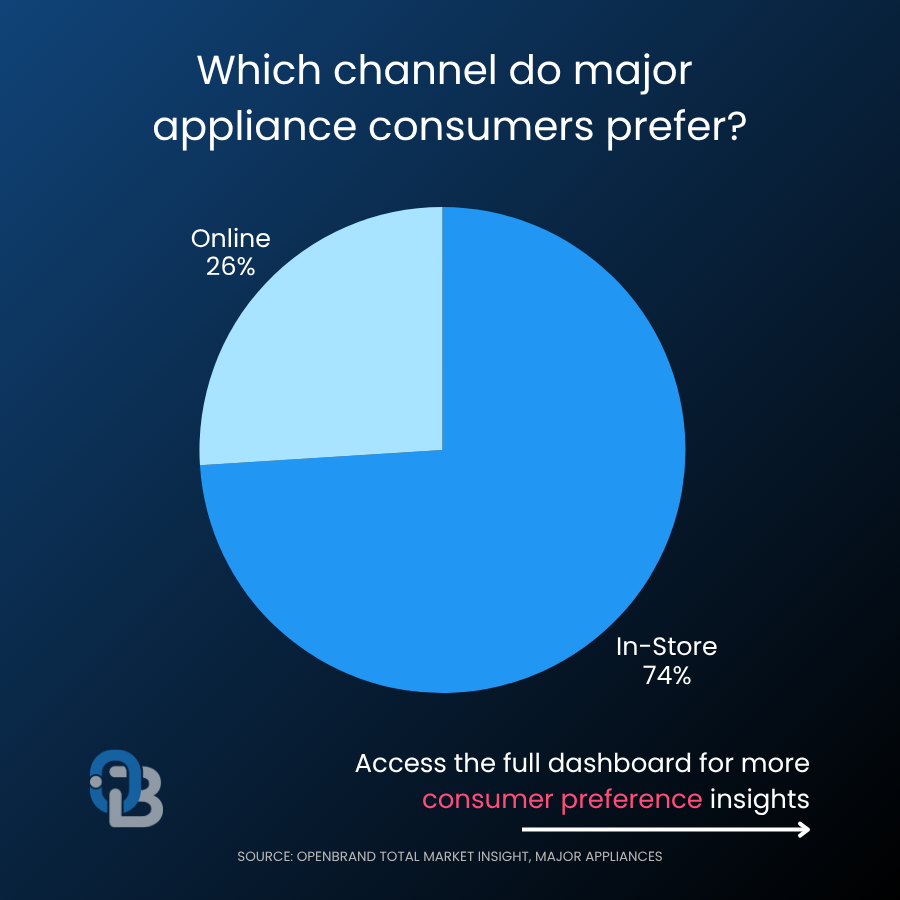
Major Appliance Consumer Demographics
OpenBrand’s census-balanced data provides a snapshot of today’s appliance buyer.
In Q4 2025:
- 74% of buyers were homeowners
- 54% were married
- 60% of purchases were made by males only, compared to 40% by females only
- 63% of purchases came from Millennials and Gen X
- Millennials: 35%
- Gen X: 28%
OpenBrand’s Major Appliance Trend Insights
Millennials remain the largest buying group, continuing to shape demand patterns across the category. Gen X also represents a significant portion of buyers, while Gen Z is gradually increasing its presence.
Major Appliance Purchase Drivers
Several key factors continue to influence where consumers choose to purchase major appliances, according to OpenBrand’s Q4 2025 consumer survey:
- Competitive pricing: 52%
- Product selection: 35%
- Store location convenience: 27%
- Prior experience: 25%
OpenBrand’s Major Appliance Trend Insights
Price remains the most influential factor, but it is not the only one. Selection, convenience, and familiarity still play meaningful roles in shaping retailer choice.
This aligns with broader pricing pressure seen throughout 2025, where rising costs and promotional cycles have pushed consumers to weigh value more carefully against premium features.
Appliance Industry Outlook and Emerging Trends
What’s next for the US Major Appliance market in 2026?
Looking ahead to 2026, several themes continue to shape the appliance market:
Retail remains concentrated: Lowe’s and Home Depot continue to control the majority of sales, making retail partnerships critical for brands.
Q4 acts as a reset moment: The holiday season has become a key window where promotions can temporarily shift share and influence momentum.
Premium and value strategies are diverging: LG leads in dollar share while GE leads in units, highlighting different paths to growth.
In-store continues to lead: Despite steady digital influence, most purchases still happen in physical locations.
Younger consumers are driving demand: Millennials remain the largest segment, reinforcing the need for strong omnichannel experiences.
Get more insight into Major Appliance market trends
The companies gaining share aren’t guessing. They’re using real-time data to understand what’s changing and why.
Explore OpenBrand’s MarketSignal dashboard for deeper insights into retailer performance, brand trends, and consumer behavior.

To learn how OpenBrand can help your business stay ahead of market shifts, get in touch with our team.

Retail Leakage: Who Is Winning Your Lost Shoppers and Why?
Retail leakage measures where shoppers go when they don’t choose you and which competitors win them instead.
According to OpenBrand’s consumer durables market intelligence, leakage analysis reveals how demand shifts between brands and retailers, and whether losses are driven by a draw (consideration) gap or a close (conversion) gap.
For durables brands and retailers, this answers a critical question most teams still cannot quantify: Who is winning your lost shoppers and why?
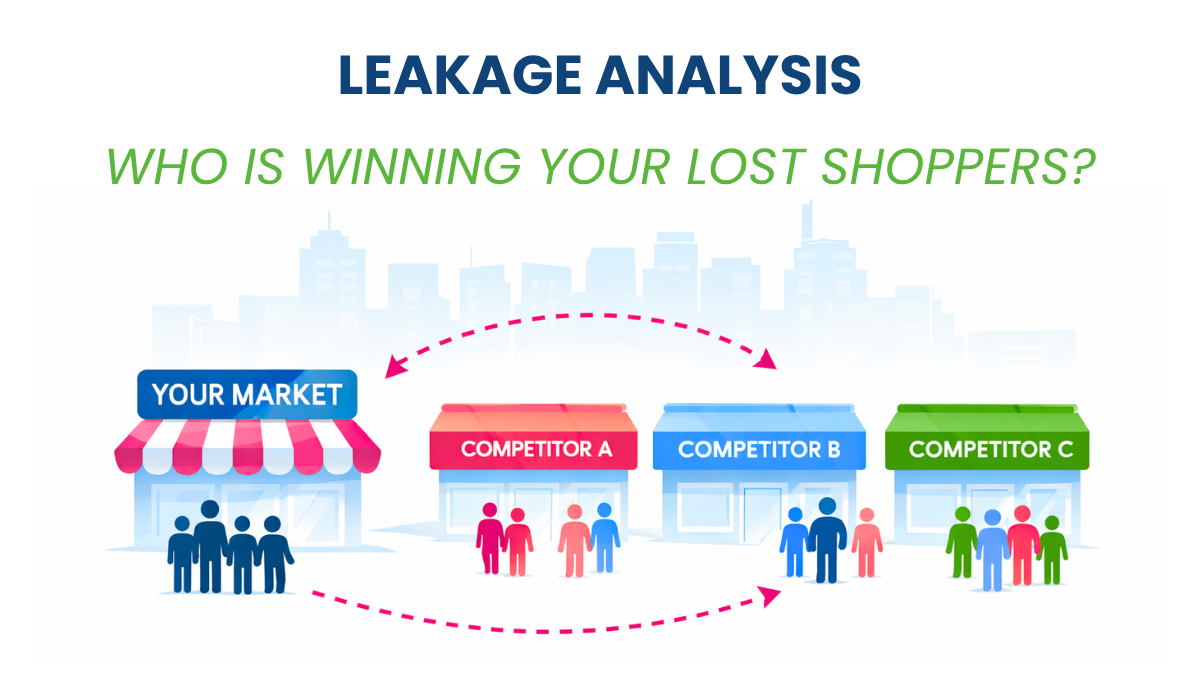
Share. Pricing. Promotions. Assortment. Placement. You know what you are doing. You may even know what your competitors are doing. (If not? OpenBrand can show you!) However, without leakage analysis, you cannot see how shoppers respond or where that demand actually goes.
That gap between activity and outcome is where growth is won or lost – and it is exactly why OpenBrand’s leakage analysis changes the game.
DOWNLOAD OUR BRAND AND RETAILER LEAKAGE REPORTS

Key Takeaways: Leakage in Consumer Durables
- Retail leakage shows where shoppers go when they don’t choose you and which competitors win them
- According to OpenBrand data, performance gaps often come down to draw (consideration) vs. close (conversion)
- Leakage reveals which competitors are consistently capturing your lost demand
- In many categories, a small number of competitors capture the majority of leakage (e.g., 50–60% in power tools)
- The biggest risk is not losing shoppers — it is misdiagnosing where they went and focusing on the wrong competitors
What Is Retail Leakage and Why Does It Matter for Consumer Durables Brands?
At its core, leakage is the measurement of lost shoppers and where they end up instead.
It answers three fundamental questions:
- Who is losing shoppers?
- Who is winning them?
- What needs to change to win them back?
Unlike traditional performance metrics, leakage goes beyond lost sales to reveal who wins lost shoppers and provides a target for where to focus next.
For durables categories like appliances, power tools, and home improvement, where purchase cycles are longer and decisions are higher-consideration, this visibility is critical.
When a shopper leaves, they are not disappearing. They are choosing someone else.
Why Traditional Metrics Miss the Most Important Question in Retail
Most organizations rely heavily on 4Ps data (price, promotion, product, placement) for competitive targeting. This data tells you what actions were taken by your competition and how your strategy compares. It does not tell you how shoppers responded.
For example:
- You may be priced competitively
- You may carry the right brands
- You may have strong distribution
And still lose the sale.
Leakage fills that gap by connecting your strategy to actual shopper outcomes, revealing whether your actions influenced draw or close – and which competitors benefited when they didn’t.
It helps answer critical questions like:
- Are shoppers leaving due to a draw (consideration) gap or a close (conversion) gap?
- Which brands or retailers are consistently winning those lost shoppers?
- Where should you focus across price, promotion, assortment, or placement to win them back?
OpenBrand’s data shows brands like Frigidaire with very low consideration (~6%) but high conversion (~64%), illustrating how strong close rates alone cannot drive share without sufficient draw.
Leakage takes this one step further, showing you where the competition is winning your lost traffic.
How Draw and Close Work Across Brands and Retailers
Draw and close apply across both brands and retailers, but they show up differently.
Leakage connects both sides of this equation. It makes it possible to see not just where breakdowns occur, but whether they originate at the brand level, the retailer level, or both.
Brand Leakage
- Draw = consideration
- Close = how effectively demand converts across retailers
How Does Retail Leakage Help Brands Identify Who Is Taking Their Customers?
For manufacturers, leakage answers a critical question:
Which competitor brands are taking your customers and why?
This unlocks several high-impact opportunities:
- Identify conquest targets
- Diagnose gaps between awareness and conversion
- Align marketing spend to actual shopper behavior
- Strengthen retail partnerships with shared insights
Instead of guessing where brand share is shifting, brands can quantify it and act on it.
Real-World Example: Brand Leakage in Appliances
According to OpenBrand’s consumer insights data, GE converts major appliance shoppers at a significantly higher rate than LG or Samsung (64% vs. 58% and 56%), but draws fewer shoppers overall.

This reveals a very different growth story:
- Conversion is strong (close is not the issue)
- Growth depends on increasing draw (consideration)
Leakage also shows how competitors capture lost demand:
- Samsung converts a large share of LG’s lost shoppers
- GE’s lost shoppers are distributed across multiple competing brands
This allows brands to move beyond general awareness strategies and instead target specific competitive conquest opportunities.
Retailer Leakage
- Draw = traffic and shopper entry
- Close = in-store or online conversion
How Can Retailers Use Retail Leakage to Diagnose Lost Share?
For retailers, leakage becomes a diagnostic engine for growth.
It enables teams to:
- Pinpoint exactly where shoppers are lost
- Identify which competitors are benefiting
- Prioritize investments across pricing, promotions, and assortment
- Quantify the size of the opportunity
Most importantly, it answers a question every merchant and executive is asking: “We’re losing share. What do we fix?”
Leakage provides a clear, data-backed answer.
Real-World Example: Appliances and Retail Leakage
According to OpenBrand’s consumer insights data, Lowe’s converts major appliance shoppers at a significantly higher rate than Home Depot (66% vs. 59%). Leakage reveals the real opportunity:
- Lowe’s is converting well
- The constraint is shopper draw
In other words, the fastest path to growth is not fixing conversion. It is driving more qualified traffic.
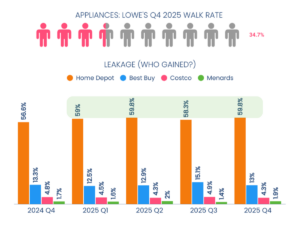
At the same time, competitors like Best Buy are capturing shoppers leaving the home improvement channel, especially in premium segments.
That insight changes strategy entirely:
- It highlights cross-channel competition
- It reframes where share is actually being lost
- It points directly to where to invest next
Without leakage, those signals remain invisible.
From Insight to Action: Turning Leakage Into Growth
The real value of leakage is about visibility and prioritization. Brands and retailers that misdiagnose where shoppers are going or who is winning them often waste time and resources competing in the wrong places. Leakage brings clarity to both, ensuring teams focus on the competitors, levers, and opportunities actually driving share.
Leakage eliminates that risk by tying every lost sale back to:
- Draw
- Close
- And the competitor who won
That means every action can be precise:
- If draw is weak → increase visibility and demand
- If close is weak → improve conversion drivers
- If both are weak → rethink positioning
This is how teams move from reactive decisions to precision growth strategies.
Leakage Is Not Random. It’s Predictable.
One of the most powerful aspects of leakage is that it is not evenly distributed.
In many categories, a small number of competitors consistently capture the majority of lost shoppers.
According to OpenBrand’s retailer leakage data, competitors like Home Depot consistently capture nearly 60% of Lowe’s lost appliance shoppers, reinforcing how leakage is concentrated among a small number of key players.
As another example, in power tools, leading brands like DEWALT capture as much as 50–60% of lost shoppers, creating highly concentrated share shifts.
This reframes competition around identifying and targeting the specific competitors consistently capturing your customers, so you can improve performance where it actually drives share.
The Bottom Line
You already know what you and your competitors are doing. Leakage shows how those actions translate into shopper decisions and which competitors benefit when they don’t.
In an environment where margins are tight and competition is intensifying across channels, that level of clarity is a competitive advantage. Growth comes from knowing exactly where you are losing, who is winning, and what to fix to win those shoppers back.
Free Leakage Reports
Want to see real draw, close, and leakage data?
In these reports, you’ll see a real world example of:
- Where shoppers are leaving?
- Who is capturing them
- Whether opportunity is increasing consideration or improving conversion
Available for download now:
- Retailer Leakage Report → See where traffic and conversion are breaking down across retailers
- Brand Leakage Report → Understand which competitors are winning your customers and why
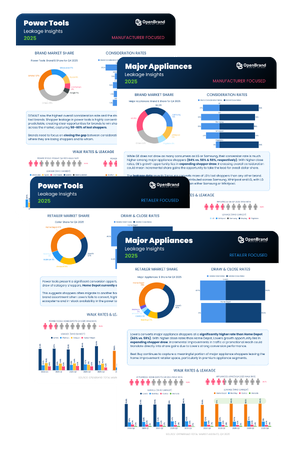
Key Definitions in Leakage Analysis
| Term | Definition |
| Leakage | The measurement of where shoppers go when they don’t choose you and which competitors win them instead |
| Draw Rate (Consideration) | The percentage of shoppers who choose to consider your brand or retail channel |
| Close Rate (Conversion) | The percentage of shoppers who convert after considering you |
| Share Shift | The movement of demand from one brand or retailer to another |
| Leakage Concentration | The degree to which lost shoppers are captured by a small set of competitors |
FAQ
What is retail leakage analysis?
OpenBrand’s retail leakage analysis measures where your shoppers go when they don’t purchase from you. It identifies which competitors are winning your lost customers — and whether the breakdown is happening at the consideration stage (draw) or the conversion stage (close).
How do brands measure where lost shoppers go?
Brands measure lost shoppers through consumer survey data that tracks the full purchase journey — including which brands and retailers were considered, where shoppers ultimately bought, and why they switched. OpenBrand’s leakage analysis combines this survey data with market share and pricing intelligence to quantify exactly which competitors are capturing lost demand.
What is the difference between draw and close rate?
Draw measures whether shoppers choose to consider you — it’s a traffic and awareness metric. Close rate measures whether you convert shoppers who do consider you. A brand or retailer can have a strong close rate but still lose share if their draw is low, and vice versa. Leakage analysis separates the two so teams can diagnose the right problem and invest in the right solution.
Why is leakage analysis important for consumer durables brands?
In consumer durables — appliances, power tools, outdoor equipment — purchase decisions are high-consideration and infrequent. When a shopper leaves, they may not return for years. Leakage analysis identifies which competitors are capturing those shoppers and whether the loss stems from awareness, consideration, or conversion gaps, so brands can act before share erodes further.
Which competitors are most likely to capture my lost shoppers?
Leakage is rarely evenly distributed. In most durables categories, a small number of competitors capture the majority of lost shoppers. For example, in power tools, leading brands like DEWALT capture as much as 50–60% of lost shoppers. Leakage analysis identifies your highest-concentration competitors so you can prioritize conquest efforts where they actually move share.
How does leakage analysis differ from market share data?
Leakage analysis and market share data are not meant to be used as alternatives to one another. They work together to provide a more complete view of performance.
Market share shows how performance is shifting across brands and retailers. It tells you who gained and who lost over a given period.
Leakage analysis complements that by revealing where share actually went, which competitors captured it, and what drove those shifts in shopper behavior. Instead of just seeing you lost share, you can understand whether the issue is a draw (consideration) gap or a close (conversion) gap, and which specific competitors are consistently winning your lost shoppers.
Together, they connect performance to action:
- Market share shows what changed
- Leakage shows where it went and how to win it back
That combination allows teams to move beyond reporting and into prioritized, competitive strategy, focusing on the right competitors and the right levers across price, promotion, assortment, and placement.
Want to see what leakage and share insights look like for your brand or category? Connect with OpenBrand to uncover where your shoppers are going, who is winning them, and where to focus to take that share back.
Can retailers use leakage analysis the same way brands do?
Yes, but the application differs. For retailers, leakage identifies where shoppers are entering and exiting the purchase funnel — and which competing retailers or channels are capturing them. For example, OpenBrand’s data shows that while Lowe’s converts major appliance shoppers at a higher rate than Home Depot (66% vs. 59%), its bigger opportunity is increasing shopper draw, not improving conversion. That’s a strategic insight traditional POS data alone can’t surface.