


Top 2025 Consumer Durables Brands and Retailers: Market Share Rankings
The consumer durables market in 2025 saw continued shifts in retailer competition, brand performance, pricing strategies, and consumer purchase behavior. To help brands and retailers understand the competitive landscape, OpenBrand analyzed performance across 6 key consumer durables categories and released our 2025 Consumer Durables Market Rankings.
The OpenBrand 2025 Consumer Durables Market Rankings identify the brands and retailers that captured the most demand in 2025 across 6 consumer durables categories using market share data, pricing intelligence, and consumer purchase surveys.
The rankings reveal:
- Top consumer durables brands in 2025
- Top consumer durables retailers in 2025
- Shopper draw and close rates
- Online versus in store performance
- Promotional activity and pricing
- Product level performance
Read on for 10 quick takeaways or view the 2025 Consumer Durables Market Rankings dashboard to see which brands and retailers led the market this year for categories including: Computing, Floor Care, Grills, Mowers, Refrigerators & Saws.
OpenBrand covers additional product categories not featured in the rankings. To see the data for other categories or dig into the data by retailer, product type, spec, etc., contact our team.
2025 Consumer Durables Market Rankings Snapshot
The table below highlights several of the top consumer durables brands and retailers in 2025 identified in the 2025 Consumer Durables Market Rankings across major consumer durables industries.
| Category | 2025 Leading Retailer | 2025 Leading Brand | Top Product SKU in 2025 | Top Online Retailer in 2025 | Top Promoted Brand in 2025 |
| Computing | Best Buy | Apple | Apple: MD4A4LL/A | Amazon | Apple |
| Floor Care | Amazon | Shark | Shark: s1000wm | Amazon | Shark |
| Grills | Home Depot | Weber | Expert Grill: XGS236178263002 | Amazon | Weber |
| Refrigerators | Lowe’s | LG | Midea: MRT18D3BWW | Home Depot | Whirlpool |
| Saws | Home Depot | DEWALT | Ryobi: PCL525B | Amazon | DEWALT |
| Walk-Behind Mowers | Lowe’s | EGO | Ryobi: RY401170 | Amazon | Greenworks |
These rankings highlight the retailers capturing the most consumer spending, the brands generating the most demand, and the individual products driving category performance across the consumer durables industry.
Explore the full 2025 Consumer Durables Market Rankings to see detailed performance metrics, shopper conversion insights, and pricing and promotion analysis.
10 Consumer Durables Insights From the 2025 Rankings
Here are 10 data-backed takeaways from the 2025 rankings.
1. Major appliances still rely on big-box retailers over online channels
Across most consumer durables categories, Amazon leads as the top online retailer. However, in major appliances such as Refrigerators, traditional big-box retailers like Lowe’s and Home Depot continue to dominate online sales, reflecting consumer preference for established retailers in high-consideration purchases.
2. Amazon is the top retailer for floor care products in 2025
While Lowe’s and Home Depot dominate most durables categories, Amazon comes in as the leading retailer for Floor Care products, signaling the category’s shift to online purchase channel preference.
3. Apple leads the computing category in market share and conversion
Apple captured the highest market share in Computing across both online and in-store channels. With a 71% close rate, Apple significantly outperforms competitors like HP, which captures a portion of Apple’s lost shoppers but trails by more than 10 percentage points in total market share.
4. Walmart shows strong shopper conversion in grills despite lower share
In the Grills category, Walmart demonstrates higher shopper draw and close rates than leading retailers like Home Depot and Lowe’s. However, lower average price points limit its total market share compared to premium-positioned competitors.
5. Heavy discounting doesn’t guarantee market share in Grills
Nexgrill leads in promotional activity, discounting products at rates nearly 10 percentage points higher than competitors and 20 points higher than Weber. Despite this, Weber maintains stronger overall positioning, showing that aggressive discounting alone does not drive market leadership.
6. Ryobi leads in top-selling SKUs across multiple categories
Ryobi does not lead overall brand market share in categories like saws and walk-behind mowers, where DEWALT and EGO rank higher, respectively. However, Ryobi holds the top-selling individual SKUs in 2025 in both categories, demonstrating strong product-level performance.
7. Purchase channel shifts brand winners in Walk-Behind Mowers
EGO leads in total dollar share for Walk-Behind Mowers, but brand leadership changes by channel. Greenworks leads in online sales, while Toro leads in in-store purchases, highlighting the importance of channel-specific strategy in consumer durables.
8. Whirlpool leads promotional activity but trails in refrigerator market share
Whirlpool has the highest share of promotions in the refrigerator category. However, it trails LG by more than 10 percentage points in market share, indicating that promotional frequency alone does not determine category leadership.
9. Highly promoted brands capture leakage in Mowers.
Greenworks ran the most promotions for Walk-Behind Mowers in 2025, which led to the successful capture of EGO’s lost shoppers. Greenworks took nearly a third of EGO’s lost shoppers.
10. Winning in appliances requires more than promotions or pricing alone
GE had the second highest number of promotions in 2025 and the largest increase in average net price from January to December (+5% / ~$73 ). GE also ranked in the top 5 for market share. Alongside other category trends, this reinforces that neither heavy discounting nor pricing strength alone drives leadership but instead success depends on a balanced execution across price, promotion and assortment.
Want to see how all the data for your brand or competitor comes together? Contact our team to start the conversation.
Explore the 2025 Durables Market Rankings
The OpenBrand 2025 Durables Market Rankings provide detailed insights across multiple consumer durables categories.
Explore the full rankings to see:
- Leading retailers by category
- Top performing brands
- Draw and close performance
- Shopper leakage insights
- Top selling products
- Pricing and promotion trends
If you would like to see rankings for additional product categories or take a look into 2026 market insights, contact OpenBrand to start the conversation.
Key Metrics in the 2025 Durables Market Rankings
The 2025 Durables Market Rankings use several key metrics to measure competitive performance across consumer durables categories. These metrics help brands and retailers understand how consumers move through the purchase journey and where demand ultimately converts into sales.
Market Share
Market share measures the percentage of total category sales captured by a brand or retailer.
In the rankings, market share is derived from OpenBrand’s proprietary and multi-sourced durables market share model, which uses six inputs (four of which are exclusive to OpenBrand) to create a nuanced and durables-grade model for determining true market share.
Consumer-Reported Share
Our rankings also take a look at how brands and retailers are performing online and in-store. To do this, we look at our proprietary survey data to see how consumers report shopping. Consumer-reported market share reveals which companies capture the largest portion of consumer demand.
Retailer Draw Rate
Retailer draw rate measures which retailers attract the most shoppers during the purchase process.
A retailer with a high draw rate is successful at bringing consumers into the shopping journey through factors such as product assortment, brand availability, pricing, or marketing visibility. Draw rate reflects consumer consideration, not necessarily final purchase.
Retailer Close Rate
Retailer close rate measures how effectively a retailer converts shoppers into buyers.
A retailer may attract a large number of shoppers but fail to convert them into purchases. Close rate reveals which retailers successfully turn shopper interest into completed transactions. Understanding close rates helps brands evaluate which retail partners convert demand most efficiently.
Brand Consideration Rate
Brand draw rate measures which brands consumers most frequently consider during the shopping process. High brand draw typically reflects strong brand awareness, product availability, or retailer presence.
Draw rate provides insight into brand visibility and consumer interest.
Brand Close Rate
Brand close rate measures how often a brand converts shopper consideration into purchases.
A brand may attract interest but lose shoppers to competitors if pricing, features, or promotions are not competitive. Close rate highlights brands that effectively turn interest into sales.
Shopper Leakage
Shopper leakage occurs when consumers consider a brand or retailer but ultimately purchase from a competitor.
Leakage analysis reveals direct competitive relationships between brands and retailers. Understanding leakage helps brands identify which competitors are capturing their lost demand.
Promotional Activity / Discount Depth
Promotional activity measures how frequently brands or product types are discounted or promoted across retailers.
Promotions can influence consumer demand and affect competitive positioning within a category. These insights help brands evaluate how pricing strategies affect performance.
Net Price
Net price refers to the final price paid by consumers after promotions or discounts.
Tracking net price helps identify pricing trends across product categories and promotional events, and understand how pricing strategies influence demand over time.
FAQs: 2025 Consumer Durables Market Rankings
OpenBrand’s 2025 Consumer Durables Market Rankings is a data-driven analysis of brand, retailer, and product performance across key durables categories, including major appliances, consumer electronics, small appliances, outdoor cooking, outdoor power equipment, and power tools.
The rankings are powered by OpenBrand’s proprietary market measurement model, which combines market share data, consumer-reported purchase behavior, pricing intelligence, and promotional activity. This provides brands and retailers with a comprehensive view of competitive performance, helping them understand where demand is being won, lost, and influenced across the purchase journey.
The rankings are built for consumer durables brands and retailers looking to understand their competitive position in the market. This includes companies in major appliances, consumer electronics, small appliances, outdoor cooking, outdoor power equipment, and power tools that want to track performance, benchmark competitors, and identify growth opportunities.
The rankings cover key consumer durables category groups, including major appliances, consumer electronics, small appliances, outdoor cooking, outdoor power equipment, and power tools. These categories provide a comprehensive view of the broader durables market.
OpenBrand’s rankings are powered by a proprietary, multi-source market measurement model that combines market share data, consumer-reported purchase behavior, pricing intelligence, and promotional tracking. This approach provides a more complete and actionable view of the consumer durables market compared to traditional single-source datasets.
The 2025 consumer durables market rankings provide visibility into market share, shopper behavior, pricing trends, and promotional activity across key categories. Brands and retailers can use these insights to understand where they are winning or losing demand, how competitors are performing, and what is driving conversion across channels.
While the 2025 consumer durables ranking dashboard is specific to certain categories, OpenBrand provides detailed visibility into how brands and retailers perform across the durables landscape. Contact us for details on full category coverage and ranking visibility.
You can explore the full rankings to see detailed performance across brands, retailers, and products, along with deeper insights into market share, real-time pricing, and shopper behavior. To see how your business compares and where opportunities exist, request access or connect with OpenBrand.
Monitor Your Market With OpenBrand
OpenBrand provides market measurement and competitive intelligence solutions for consumer durables brands and retailers.
Our platform helps companies:
- Track market share across retailers
- Monitor pricing and promotional activity
- Understand consumer purchase behavior
- Identify product level opportunities
- Measure competitive performance across categories
To learn how OpenBrand can help your team make smarter market decisions, contact us to get the conversation started.

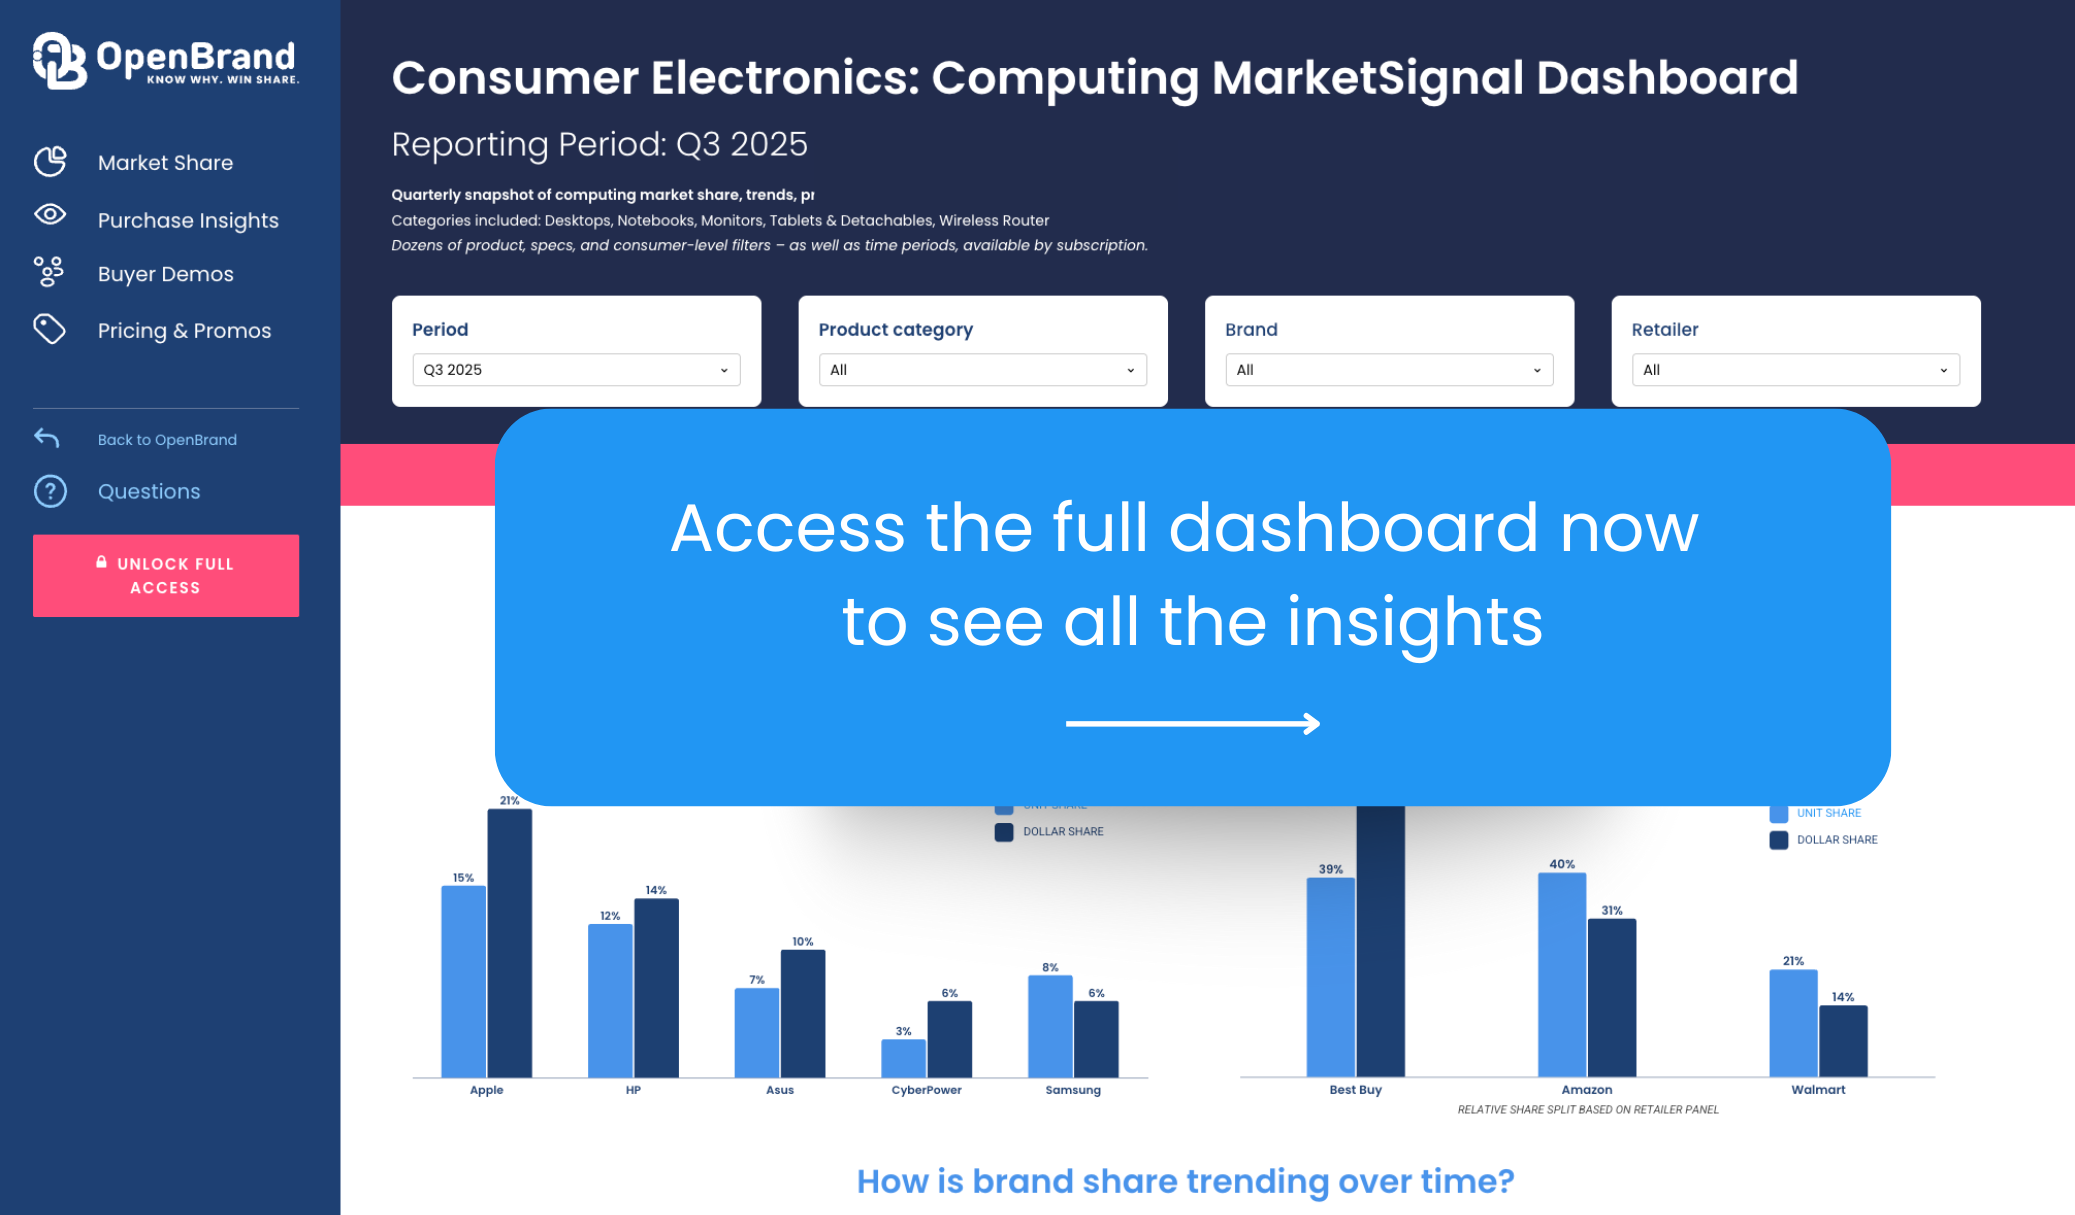
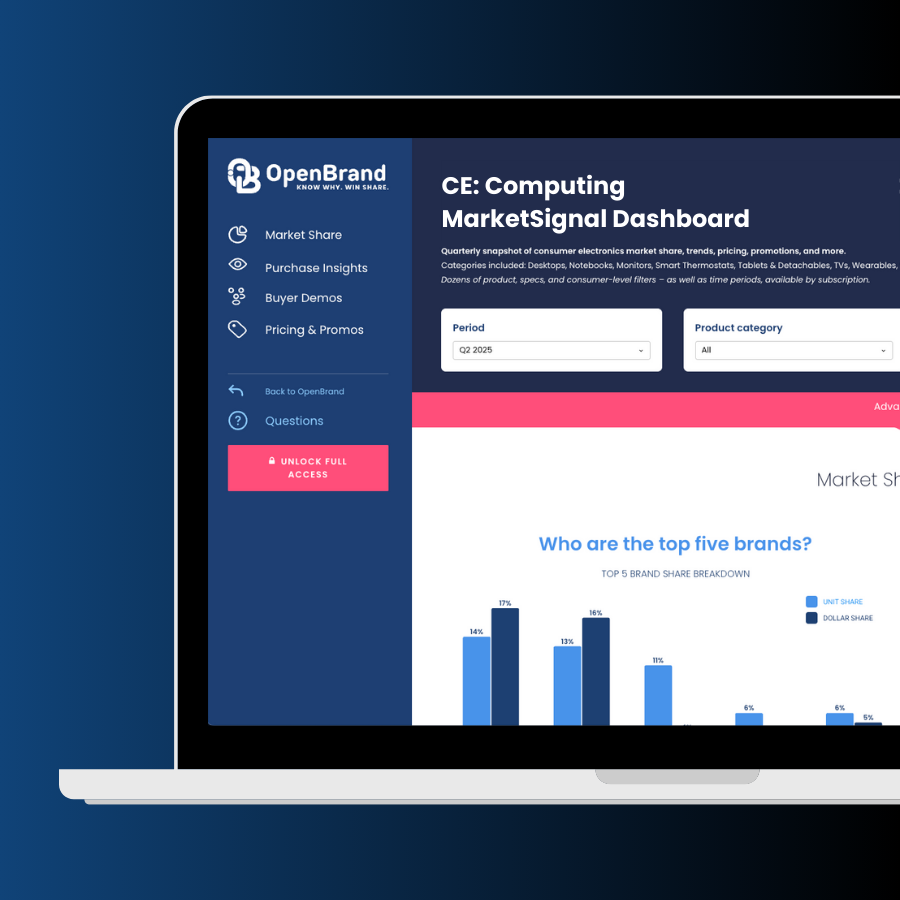
Consumer Electronics: Personal Computer Market Share | Q3 2025 Trends & Rankings
The Consumer Electronics market evolved at unprecedented speed in 2025, reshaping how consumers research, shop, and decide which brands earn their trust. Innovation cycles are shorter, price sensitivity is higher, and differentiation increasingly depends on real value rather than feature overload.
In the Computing / Personal Computer market sector, innovation is being driven by AI-enabled PCs, longer battery life through energy-efficient designs, and ecosystems that connect devices, software, and services into a single experience. While big-box retailers and national chains remain critical for Computing purchases, e-commerce marketplaces and brand-direct channels continue to gain influence, reshaping how share is won and defended across the category.
Our public MarketSignal Computing dashboard brings these shifts into focus, offering an interactive view of retailer performance, brand share, pricing trends, and consumer behavior.
Explore the latest insights or dive into the dashboard to see how the market is moving.
Category Grouping Note: All data insights in this article reflect Q3 2025 data from an OpenBrand aggregate category that includes Desktops, Notebooks, Monitors, Tablets & Detachables & Wireless Routers
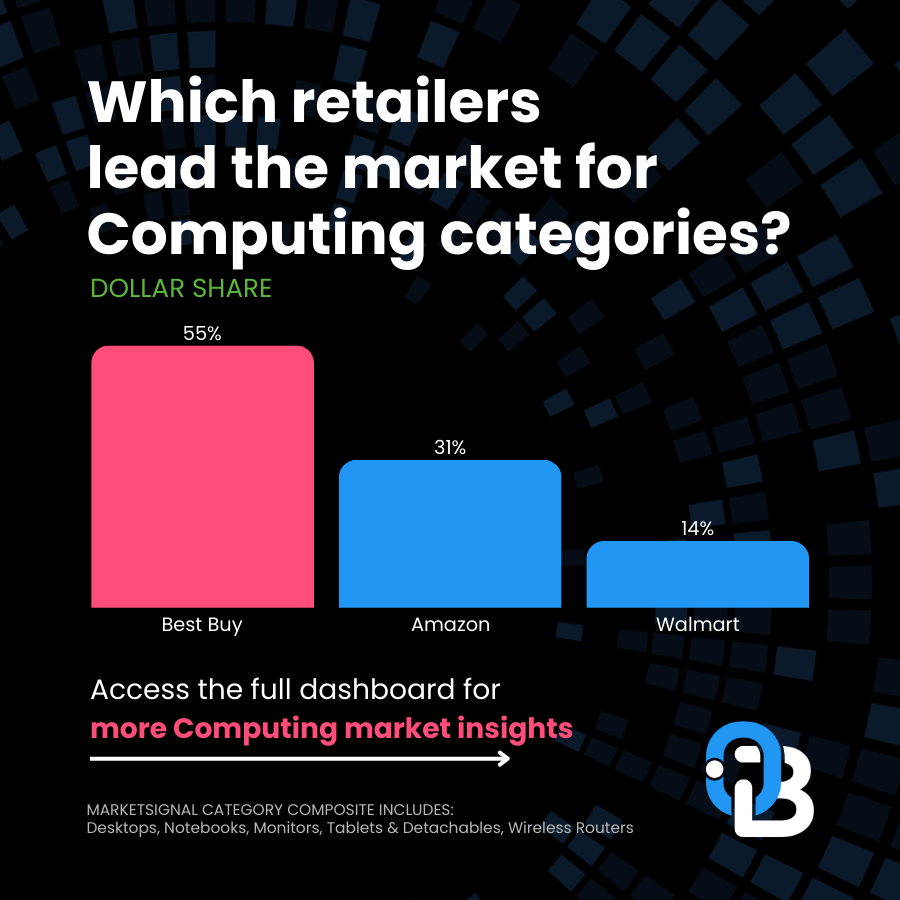
Who are the top retailers for Personal Computer market share?
The top retailers for Computing purchases are Best Buy and Amazon – across categories including Desktops, Notebooks, Monitors, Tablets & Detachables & Wireless Routers. Best Buy and Amazon lead in most dollars earned and most units sold, respectively.
Q3 2025 Computing Retailer Dollar Share Winners
| Computing Retailer | Q3 2025 Dollar Share |
| Best Buy | 55% |
| Amazon | 31% |
| Walmart | 14% |
Q3 2025 Computing Retailer Unit Share Winners
| Computing Retailer | Q3 2025 Unit Share |
| Amazon | 40% |
| Best Buy | 39% |
| Walmart | 21% |
Note: OpenBrand’s share split is based on our retailer panel, which currently consists of Home Depot, Lowe’s, Amazon, Walmart, and Best Buy. Retailers with >1% share are not shown. More retailers are coming soon.
Q3 2025 Computing Retailer Draw Rates
Our top market leaders also continue to lead in outlet draw rate, with:
- Amazon and Best Buy tie for draw, bringing in 33% of all Computing shoppers
- Walmart follows, drawing in 28% of shoppers
Among these top three retailers, Walmart and Best Buy also tie for close rate, winning 67% of the shoppers they bring in.
OpenBrand’s Computing Trend Insights
Amazon leads Computing sales for most units sold – but not by any landslide: Amazon takes Best Buy’s place as leading retailer by unit share, winning just 1% more of the market. However, Amazon falls behind Best Buy nearly 20 percentage points when looking at dollars earned. This means Amazon is moving nearly as much product, but at a much lower average price.
Apple makes the sale – but struggles in draw rate: Apple closes the most Computing shoppers at 75% but only draws in 11% of all shoppers. If Apple stores could draw in more shoppers, with a close rate that beats out even our leading retailers, they could bring in far more share by increasing draw rate.
Who leads the Computing market share by brand?: Apple Market Share Wins & More
The top Computing brand is Apple, leading in both unit and dollar share.
Q3 2025 Computing Brand Dollar Share
| Computing Brand | Q3 2025 Dollar Share |
| Apple | 21% |
| HP | 14% |
| ASUS | 10% |
| CyberPower | 6% |
| Samsung | 6% |
Q3 2025 Computing Brand Unit Share
| Computing Brand | Q3 2025 Unit Share |
| Apple | 15% |
| HP | 12% |
| Asus | 7% |
| CyberPower | 3% |
| Samsung | 8% |

For more brand share insights, including data on these share trends over time, access our public Consumer Electronics: Computing dashboard now.
Computing Brand Consideration Rates
When purchasing Desktops, Monitors, Notebooks, Tablets & Detachables, and Wireless Routers, consumers consider the following brands most often:
- Apple – 25%
- HP – 25%
- Dell – 25%
- Samsung – 13%
- Lenovo – 12%
- Kindle – 4%
OpenBrand’s Computing Trend Insights
Apple remains the top seller for Computing: Apple’s winning close rate of 70% helps it hold the spot as top brand across Computing. An equal number of consumers consider HP, Samsung, and Apple as a brand when purchasing Computing products, but Apple closes more shoppers (more than 7 percentage point difference), contributing to the brand’s place as unit and dollar share leader.
Lenovo products are often considered, but purchased at a far lower rate: Lenovo nearly matched Samsung in consideration rate, but lower close rate drops it out of top brands. At 12% brand consideration rate, Lenovo nearly matches Samsung’s 13%. However, with nearly 10 ppt difference in close rate, Lenovo (52% close) does not make it into the top 5 brands.
Explore the drivers and promotions data that may contribute to low conversion rates in our quarterly Consumer Electronics: Computing MarketSignal dashboard.
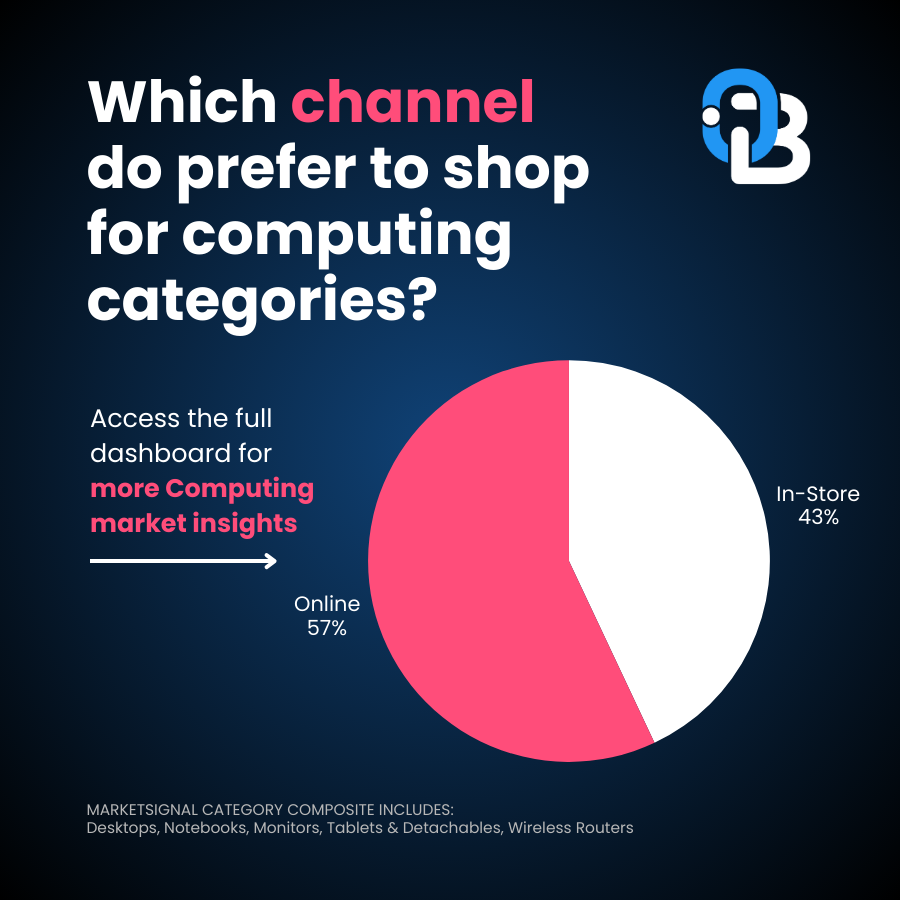
How are online and in-store sales trending for the Consumer Electronics market?
In Q3 2025, the majority of Computing sales were made online.
- In-store: 43% of purchases
- Online: 57% of purchases
OpenBrand’s Computing Trend Insights
Computing shoppers lean more toward online purchases than other Durable Goods markets. Unlike other Durable Goods markets (such as Power Tools), online sales take over half the market. This highlights a significant difference in how Consumer Electronics shoppers are making purchases versus other markets. The online channel is critically important for electronics retailers and brands.
Computing Consumer Demographics
Who is shopping most for Desktops, Monitors, Notebooks, Tablets & Detachables, and Wireless Routers? OpenBrand illustrates the typical buyer using survey results from our long-standing and census-balanced consumer durables tracking survey.
As of Q3 2025, Computing consumers showed the following traits:
- 63% of purchasers are homeowners, 33% rent
- 46% of purchasers are married
- 57% of purchases made were with males in the buying process; 43% were made with females involved
- 30% of purchases were made by Millennials, making up the biggest segment of shoppers, with Gen X buyers (26%) and Baby Boomers (23%) next. Want to see where Gen Z falls?
Purchase Drivers for Computing Products
The most frequently mentioned reasons for purchasing Computing products at a specific retailer were:
Why consumers select a specific retailer
- Competitive price — 58%
- Good selection of products — 34%
- Previous experience with store — 23%
- Convenient location — 16%
Get more Consumer Electronics: Computing market share trends
The market insights don’t stop here. For more retail sales data, market share, and insights on the Computing industry, access the Consumer Electronics: Computing MarketSignal dashboard now.
To see insights for other industries or find out how we can help power growth for your business, contact us today.

Pros & Cons of Consumer Data Collection Types
Consumer data is a critical tool for understanding your market and improving your business strategy. It provides insight into purchasing behavior, preferences, and trends. This data helps optimize product placement, inventory management, and marketing strategies — ultimately enhancing customer satisfaction and driving sales growth.
In this blog post, we will look at the advantages and disadvantages across different types of consumer data collection. Read to discover key principles to look for when evaluating how to collect consumer data and reasons to use one option versus another.
5 major consumer data collection types
Here is a list of the primary types of data collection that we will examine in this article.
- Credit Cards
- Loyalty Programs and Subscription Records
- Government (Census, Voter History)
- Receipt Panels
- Surveys (Door-to-Door, Mall Intercept, Telephone, Mail, Online)
1. CREDIT CARD DATA
Due to heavy market usage (with an estimated 191 million Americans owning at least one credit card), credit cards are a prominent source of consumer data and a valuable metric for analyzing retail performance.
ADVANTAGES OF CREDIT CARD DATA
- Data is robust and easily obtainable
- Factual, transaction-specific information — no room for subjectivity
- Delivers insight into buying behaviors and spending patterns at specific retailers
- Good for wholistic retailer metrics
- Tracks transactions across online and in-store purchases
- Data can be updated very frequently
DISADVANTAGES OF CREDIT CARD DATA
- Often lacks specificity; lacks a breakdown of spending by line item or category
- Lacks the granularity to explain why consumers make specific purchases or emotional responses to products
- Quantitative data only
2. Loyalty Programs and Subscription Records
Customer loyalty data analytics track consumers’ ongoing interactions with a brand — from repeat purchases and engagement frequency to redemption patterns and churn risk.
ADVANTAGES OF SUBSCRIPTION & CUSTOMER LOYALTY DATA
- High consumer identification accuracy
- Captures consumer patterns over time; useful for churn prediction and retention analysis
- Cross-channel tracking: links in-store, online, and app-based behaviors for a single consumer profile
DISADVANTAGES OF SUBSCRIPTION & CUSTOMER LOYALTY DATA
- Very limited; only reflects consumers enrolled in the program
- Requires strict compliance with consumer data protection laws
- Skewed insights; loyalty participants typically more brand-loyal and spend more
- Requires consistent technology infrastructure and incentive management
3. GOVERNMENT DATA
Government data, such as the US Census, is a good source of consumer demographic information.
ADVANTAGES OF GOVERNMENT DATA
- Rich demographics data
- Direct from consumer
- Publicly accessible, available to anyone
- High-quality
DISADVANTAGES OF GOVERNMENT DATA
- Timeliness; may be very lagged – such as the US census is only fully collected once every 10 years
- Can be complex to extract insights from; needs a level of expertise to understand
- Typically quantitative data only
4. RECEIPT PANEL DATA
Receipt panel data typically involves consumer-submitted receipt images from either a photographed paper receipt or emailed digital receipt.
ADVANTAGES OF RECEIPT DATA
- Detailed purchase insights; SKU-level information, basket purchases, etc.
- Typically includes online and in-store data
- Authenticity, as it does not rely on consumer recall
DISADVANTAGES OF RECEIPT DATA
- Cannot calculate market share
- Representation will be limited due to panel base and low incident items
- Low data quality and gaps in data due to variance in submitted receipts
- Retail variation in product numbers (SKUs) and features create discrepancy
- Privacy concerns limit the ability to collect without consumer submission
- Quantitative data only
- Sample representation may be biased towards those willing to use a smartphone to take photos
- Requires “product information master” to decode items on the receipt into an actual product
5. SURVEYS & INTERVIEW DATA
Alongside the advancement of technology, survey and interview methodologies evolved over the past few decades — taking us from heavily limited door-to-door questionnaires to the more modern and highly accessible online survey.
While all these methods are still a valid method of gathering information, this list will highlight the evolution of surveys and the disadvantages of each.
ONLINE SURVEYS
Today, the most popular and efficient method of survey data collection are online surveys, which use the internet to distribute questionnaires through a technological device.
ADVANTAGES OF ONLINE SURVEYS
- Can accommodate high response numbers, allowing for a better market representation
- Extremely wide reach, not limited to geographical area
- Cost-effective
- Panel profiling allows for better targeting and therefore less expensive
- Automated data collection decreases turnaround time
- Easy integration with data analysis tools
- Can result in both quantitative and qualitative data
- Reporting may be made in real-time and changes can be made to sampling or surveys “on the fly”
DISADVANTAGES OF ONLINE SURVEYS
- Consumer recall bias
- Low engagement of respondents (survey fatigue)
- Can be lengthy and boring for consumers
- Representation — some demographics are under-represented (low income, unacculturated Hispanics for example)
- Privacy concerns
- Data quality issues between fraud and validity of responses — requires a backend system that can mitigate data quality risks
TELEPHONE SURVEYS
This method of data collection involves interviewers using phone calls to reach respondents. Today, these surveys often use automated voice systems to conduct the interviews.
ADVANTAGES OF TELEPHONE SURVEYS
- Can reach a wide range of consumers — not limited by geographical area
- Cost-effective compared to in-person interview methods like door-to-door
- Efficient, allows for quick turnaround of data especially when using automated response recording technologies
- Reduced response bias — delivers sense of anonymity compared to face-to-face interviews
- Can result in both quantitative and qualitative data
DISADVANTAGES OF TELEPHONE SURVEYS
- Response rates are declining, hang-ups are more frequent
- Technological limitations — poor connection, speaker clarity, etc.
- Data quality issues
- Expensive
MAIL SURVEYS
Still used prevalently throughout the world, mail surveys are standardized questionnaires that are sent to someone’s physical address to be filled out and mailed back.
ADVANTAGES OF MAIL SURVEYS
- Wide reach, not limited to geographical location, online, or telephone access
- Not limited by technology
- No interview bias
- Can result in both quantitative and qualitative data
DISADVANTAGES OF MAIL SURVEYS
- Low response rate
- Can be costly with prepping, mailing, receiving, processing
- Slow — delayed consumer response rate
- Limited data and low depth to insights gathered
DOOR-TO-DOOR
While used less frequently today in the US, door-to-door questionnaires were once a prevalent method of gathering consumer data. As indicated by the name, door-to-door involves visiting individual homes to conduct a survey or in-person interview.
ADVANTAGES OF DOOR-TO-DOOR
- Personal interaction/verify speaking with real human (allows for sight-screening)
- Geo-targeting typically allows for socio-economic targeting
- High response rate
- Detailed data collection as interviewer can follow-up on information provided
- Can result in both quantitative and qualitative data
- Can be highly representative by including harder to reach audiences
DISADVANTAGES OF DOOR-TO-DOOR
- Can be costly
- Very time-consuming
- Limited by local area/geographical restraints (e.g harder to collect representative data in remote areas)
- Data can be biased as consumers may look to provide socially desirable answers due to the face-to-face nature of the interview (acquiescence bias)
MALL INTERCEPT INTERVIEWS
This method involves approaching potential respondents in a mall or similar retail setting to conduct surveys or interviews. Often used to gather consumer opinions on products or services relevant to the location where the interview is held.
ADVANTAGES OF MALL INTERCEPT
- Targeted sampling / sight-screening; allows interviews to target specific demographics to create a better representation within collected data
- Detailed data collection, opportunity for follow-up
- Immediate feedback / product interaction
- High volume of respondents in a single location
- Can result in both quantitative and qualitative data
DISADVANTAGES OF MALL INTERCEPT
- Biased responses can be an issue as consumer could be hurried or looking to provide socially acceptable answers due to the face-to-face nature of the interview
- Consumer representation restricted to those who shop at that location
- Not always permissible
- Data input and analysis can be time costly
Which method is best for data collection?
The truth is, no single data source tells the whole story. Each type of consumer data collection comes with tradeoffs — some provide precise numbers but little context, while others uncover the “why” behind behavior but lack scale.
The most effective approach depends on what business question you’re trying to answer – with a multi-sourced approach delivering the most complete view of the market.
Below is a breakdown of when each method works best, drawing on the strengths and weaknesses discussed above.
| If your goal is… | Use this data type: | Why it works: |
| Measure real-world purchase behavior | Credit card and receipt data | Provides factual, verifiable transactions |
| Segment your audience or build demographic profiles | Government and/or survey data | Offers statistically representative population insights |
| Understand brand loyalty or predict churn | Loyalty and subscription records | Tracks repeat engagement and purchase frequency |
| Test new product concepts or marketing messages | Surveys and interviews | Reveals opinions, motivations, and emotional responses |
| Build a holistic consumer understanding | Combination of receipt data + survey data | Merges “what and how much” with “why” for deeper strategic insight |
Contact Us
OpenBrand integrates a multitude of data sources, each weighted dynamically based on how strong and relevant the signal is for a given product or category. It’s a flexible, pragmatic approach designed for a market where traditional methods often fall short. Learn more about what makes OpenBrand’s data stand out.
Contact us to see how OpenBrand can support your consumer data and market intelligence needs.

US Major Appliance Market Share: Q2 2025 Trends & Rankings
The second quarter of 2025 reinforced the rapid transformation underway in the U.S. major-appliance market, as consumer behaviour, channel disruption and brand positioning all accelerate. While traditional big-box retail remains influential, the rise of online and omnichannel models is gaining momentum and intensifying competition.
At the same time, the industry is navigating a fresh wave of trade- and tariff-driven headwinds — from rising input costs tied to steel and aluminium duties to altered sourcing strategies — creating a new strategic divide between market leaders with scale and agility, and challengers still reacting to the shifts.
Our public MarketSignal dashboard highlights how these industry shifts are impacting the market, offering an interactive look at retailer performance, brand share shifts, pricing dynamics, and evolving consumer behavior.
Keep reading for Q2 2025 highlights, or jump into the dashboard to explore the latest data firsthand.

SOURCE: All data insights in this article covers Q2 2025 data within the OpenBrand Market Measurement suite. This category covers an aggregate of several products including Refrigerator, Clothes Washer, Clothes Dryer, Dishwasher, Freezer, Free-Standing Range, Cooktop, Wall Oven, Compact Refrigerator, and Built-In Range.
Who are the top major appliances retailers by market share?
In Q2 2025, Lowe’s and Home Depot remain the undisputed leaders in major appliance sales, topping both unit and dollar share.
Q2 2025 Major Appliances Retailer Unit Share Winners
| Major Appliance Retailer | Q1 2025 Unit Share | Q2 2025 Unit Share |
| Lowe's | 43% | 41% |
| Home Depot | 34% | 36% |
| Best Buy | 17% | 16% |
Q2 2025 Major Appliances Retailer Dollar Share Winners
| Major Appliance Retailer | Q1 2025 Dollar Share | Q2 2025 Dollar Share |
| Lowe's | 41% | 39% |
| Home Depot | 36% | 37% |
| Best Buy | 18% | 18% |
OpenBrand’s Major Appliance Trend Insight
Lowe’s saw a small decline in share from Q1 to Q2. As the leading retailer for major appliances, Lowe’s saw slight decrease in share (2 ppt in both unit and dollar share), while Home Depot saw 2 ppt gain in unit and 1 ppt gain in dollar share.
Q2 2025 Major Appliance Retailer Draw Rates
Our top market leaders also continue to lead in outlet draw rate, with:
- Lowe’s and Home Depot both drawing in 43% of all consumers who bought Major Appliances
- Best Buy follows as the third most-visited outlet, drawing 18% of consumers
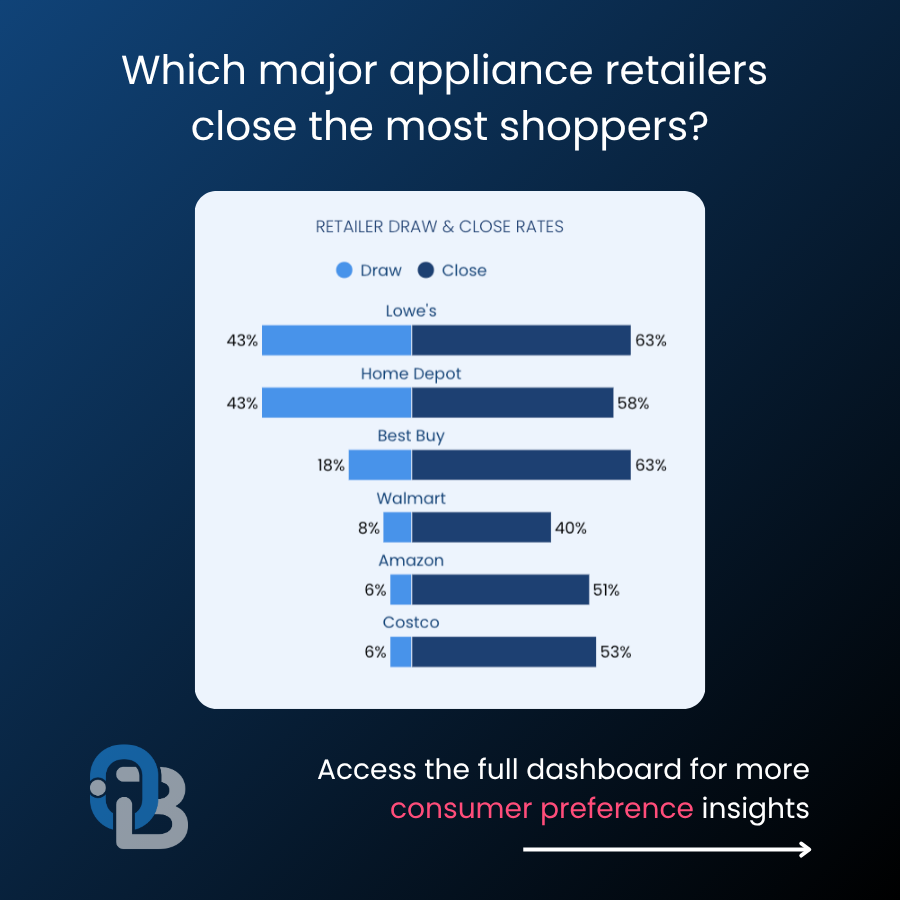
OpenBrand’s Major Appliance Trend Insight
Best Buy draws in fewer shoppers, but closes the same amount as Lowe’s – and more than Home Depot. This highlights an opportunity for Best Buy. If they can draw in more shoppers, their ability to convert browsing customers into buyers at the same rate as Lowe’s, the share leader, they are likely to gain share.
For more insights on draw rates — and to see how these retailers compare in closing the consumers they brought in — quarterly major appliances MarketSignal dashboard.
Who leads the major home appliances market share by brand in Q2 2025?
Whirlpool, GE, LG, and Samsung remain the leading major appliance brands in Q2 2025, each maintaining double-digit share in both unit and dollar sales.
Q2 2025 Major Appliances Brand Unit Share Winners
| Major Appliance Brand | Q2 2025 Unit Share |
| GE | 21% |
| LG | 18% |
| Samsung | 16% |
| Whirlpool | 13% |
Q2 2025 Major Appliances Brand Dollar Share Winners
| Major Appliance Brand | Q2 2025 Dollar Share |
| GE | 20% |
| LG | 20% |
| Samsung | 16% |
| Whirlpool | 11% |
OpenBrand’s Major Appliance Trend Insight
GE saw the most share gains from Q1 to Q2. Across the top 10 brands, GE is the only brand to see a 2 ppt unit share gain. Whirlpool, meanwhile, saw a 2 ppt decrease in unit share.
Brand Consideration Rates
When purchasing major appliances, almost a third of all consumers consider these top four brands in their purchase.
| Major Appliance Brand | Q1 2025 Brand Consideration Rate | Q2 2025 Brand Consideration Rate |
| Samsung | 32% | 34% |
| LG | 32% | 33% |
| GE | 28% | 28% |
| Whirlpool | 27% | 27% |
OpenBrand’s Major Appliance Trend Insight
- While Frigidaire is only considered by 10% of consumers buying major appliances, they close 65% of those shoppers – the highest close rate of all the top major appliance brands. This high close contributes to how the brand holds 10% of market unit share, despite not being considered as often as brands like Samsung and LG.
- LG and Samsung lead all brands in consideration: Each approaches one-third of consumers, while GE and Whirlpool follow close behind at just over a quarter.
Discover the factors — from pricing dynamics to promotional activity — influencing lower conversion rates in our latest quarterly major appliances MarketSignal dashboard.
How are online and in-store sales trending for the Major Appliance market?
Physical retail remained the dominant channel for major appliance sales in Q2 2025, yet e-commerce continued its steady rise — capturing more than one in four purchases:
- In-store: 74% of purchases
- Online: 26% of purchases
OpenBrand’s Major Appliance Trend Insights
Omnichannel Advantage: With online sales now accounting for over a quarter of all major appliance purchases, brands can’t afford pricing or merchandising gaps across channels. The biggest winners are retailers that have turned BOPIS into a growth engine.

Major Appliance Consumer Demographics
OpenBrand provides census-balanced insights that reveal a clear picture of the typical major appliance customer.
As of Q2 2025, Major Appliance consumers showed the following traits:
- 73% of purchasers are homeowners, down 2 ppt since Q1
- 52% of purchasers are married, down 4 ppt since Q1
- 60% of purchases were made with males only in the buying process; 40% were made with female only
- 61% of purchases were made by Millennials or Gen Xers
- 33% were Millennials, up 2 ppt
- 28% were Gen X, down 1 ppt
OpenBrand’s Major Appliance Trend Insights
Major appliance consumers skew younger. Millennials lead as the largest buying segment for the category, and saw a 2 ppt rise between Q1 and Q2 2025. Gen Z already makes up 16% of major appliance consumers.
Major Appliance Purchase Drivers
Why do consumers select a specific retailer for purchase? The most mentioned reasons for purchasing major appliances at a specific retailer were:
Why consumers select a specific retailer
- Competitive price — 56% (down 1 ppt since Q1)
- Good selection of products — 31% (down 1 ppt since Q1)
- Convenient location — 28% (down 1 ppt since Q1)
- Previous experience with store — 27%
OpenBrand’s Major Appliance Trend Insights
Shopper familiarity is key: “Previous experience with the store” was the only purchase driver to not see a decrease from Q1 to Q2 2025, suggesting that trust, service consistency, and positive past interactions should not be ignored in where consumers choose to buy. For retailers, this highlights the importance of loyalty, reputation, and delivering a seamless experience that keeps shoppers coming back.
Appliance Industry Outlook and Emerging Trends
What’s next for the US Major Appliance market in 2025?
Looking beyond Q2 2025, several factors are shaping the major appliance market:
Holiday & Big Deal Days Gain Even More Weight: The traditional year-end shopping surge (including the Amazon Prime Days, Black Friday, and holiday promos) will continue to shape appliance volume. Retailers and brands should be prepared for intensified competition across both online and in-store as consumers expect deeper deals and faster fulfillment.
Tariff, Supply Chain & Pricing Risks Continue: With ongoing global trade uncertainty and tariff headwinds still on the radar, brands must remain agile in sourcing and cost-structure modeling. Unexpected input-cost shifts or policy changes in late 2025 could force pricing or promotional adjustments.
Elevated Promo Activity amid Economic Sensitivity: Given that consumers remain price-conscious, despite moderating inflation, promotional intensity is likely to stay high through Q4. Brands and retailers should expect discounting to remain a key lever for driving traffic and share.
Housing Market Dynamics Could Drive a Late-Year Lift: Appliances continue to correlate with housing activity. If new-home starts, remodeling projects, or existing-home sales pick up in late 2025, major appliance demand may receive a lift. Monitoring housing indicators will provide early signals.
Energy Efficiency & Smart Features Move Front-and-Center: With regulatory pressure increasing (for example around energy-use standards) and more consumers seeking sustainable, connected products, appliance makers that prioritise efficiency and smart-home integration will have a competitive edge.
Get more insight into Major Appliance market trends
The market insights don’t stop here.
For more retail sales data, market share, and insights on the major appliance industry, access our public major appliances MarketSignal quarterly dashboard now – no paid subscription required.

To see insights for other industries or find out how we can help power growth for your business, contact us today.

Outdoor Power Equipment Market Share: Q2 2025 Trends & Rankings
The Outdoor Power Equipment market continues to evolve at a rapid pace, reshaping how consumers shop, which brands they trust, and what drives their purchase decisions.
From the strength of big-box retailers and dealer networks to the steady rise of online sales, the data reveals an increasingly competitive landscape where market leaders are widening their edge and challengers are finding new ways to compete.
Our public MarketSignal dashboard brings these shifts into focus, offering an interactive view of retailer performance, brand share, pricing trends, and consumer behavior.
In our breakdown below, learn why:
- Walmart is winning attention but losing the sale, signaling major conversion opportunites in pricing, assortment, and fulfillment.
- Ego is punching above its weight, delivering top-three share despite lagging in consumer awareness.
- Home Depot and Lowe’s are still the class of the OPE category, powered by Ryobi’s volume machine at Home Depot and Craftsman/Ego strength at Lowe’s.
- Women and Millennials are reshaping demand, driving interest in battery ecosystems, smart features, and more inclusive product positioning.
Explore these and the rest of our latest insights or dive into the dashboard to see how the market is moving.

SOURCE: All data insights in this article cover Q2 2025 within an OpenBrand aggregate category of several products including Mowers, Handhelds, Snow Throwers and Pressure Washers.
Who are the top Outdoor Power Equipment retailers by market share?
The top Outdoor Power Equipment retailers in 2025 remain Home Depot and Lowe’s, leading in both unit and dollar share – with Amazon and Walmart gaining ground.
Note: OpenBrand’s share split is based on our retailer panel, which currently consists of Home Depot, Lowe’s, Amazon, Walmart, and Best Buy. These retailers make up a majority of non-individual dealer sales in the OPE industry. More retailers are coming soon.
Outdoor Power Equipment Retailer Unit Share Winners
| Outdoor Power Equipment Retailer | Q2 2025 Unit Share |
| Home Depot | 38% |
| Lowe's | 30% |
| Amazon | 16% |
| Walmart | 15% |
Outdoor Power Equipment Retailer Dollar Share Winners
| Outdoor Power Equipment Retailer | Q2 2025 Dollar Share |
| Home Depot | 41% |
| Home Depot | 39% |
| Amazon | 10% |
| Walmart | 9% |
OpenBrand’s OPE Retailer Trend Insights
Lowe’s and Home Depot compete for unit and dollar share in OPE; Home Depot’s Ryobi exclusivity heavily influences their place as unit share winner: While Home Depot reigns for most units sold, Lowe’s keeps pace in unit and dollars earned. Ryobi makes up 58% of units sold at Home Depot, with a majority of those units falling in the $499 and below range. Meanwhile, Craftsman and Ego make up 31% and 23% respectively at Lowe’s, accounting for nearly as many units sold at the retailer as Ryobi’s 56% at Home Depot. Correspondingly, Craftsman and Ego both skew into mid to high price brands in their sales at Lowe’s.
Amazon dollar share sees YOY stability after growth, lightly driven by Prime Day events in July and Oct. Amazon’s share YoY remains flat, however they saw a 4 percentage point growth in unit share from Q2 2024 to Q4 2024, likely indicating the success of their heavy promotional periods from Prime Day in Q3 to Prime Big Deal Days and Black Friday/Cyber Week in Q4.
| Amazon | Q2 24 | Q3 24 | Q4 24 | Q1 25 | Q2 25 |
| Dollar Share | 9.5% | 10.5% | 13.5% | 11% | 9.7% |
| Unit Share | 16.6% | 17.4% | 18.4% | 18.1% | 16.1% |
Outdoor Power Equipment Retailer Draw Rates
Our top market leaders also continue to lead in outlet draw rate, with:
- Home Depot drawing in 42% of all Outdoor Power Equipment purchasers
- Lowe’s drawing in 36%
- Walmart following as the third most considered outlet at 19%

OpenBrand’s OPE Retailer Trend Insights
Walmart beats Amazon in draw rate – but not in market share: Walmart attracts nearly one in five Outdoor Power Equipment shoppers, outperforming Amazon in initial consideration. Yet despite its strong draw rate, Amazon’s equal close rate of 68% gives it an edge in converting interest to actual sales, highlighting Walmart’s opportunity to strengthen conversion through assortment, pricing, or fulfillment advantages.
Home Depot closes the same percent of shoppers as Amazon: Home Depot continues to lead the category in reach, drawing 42% of Outdoor Power Equipment shoppers and closing 68%. Notably, Amazon matches this 68% close rate — despite drawing in just 14% of shoppers — signaling untapped potential. If Amazon can expand its shopper base, even modestly, its ability to convert at Home Depot–level efficiency could translate into meaningful share gains in the quarters ahead.
For more insights on draw and close rates – and to see who is stealing the shoppers lost by the leading retailer — check out our quarterly Outdoor Power Equipment MarketSignal dashboard.
Who leads the Outdoor Power Equipment market share by brand?
The top three Outdoor Power Equipment brands are Ryobi, Craftsman, and Ego.
Outdoor Power Equipment Brand Unit Share Winners
| Outdoor Power Equipment Brand | Q2 2025 Unit Share |
| Ryobi | 22% |
| Craftsman | 10% |
| EGO | 9% |
Outdoor Power Equipment Brand Dollar Share Winners
| Outdoor Power Equipment Brand | Q2 2025 Dollar Share |
| Ryobi | 13% |
| EGO | 11% |
| Craftsman | 9% |
For more brand share insights, including share trend over time, access our public OPE dashboard now.
OpenBrand’s OPE Market Trend Insights
Ryobi dominates in unit share, but sells at a lower price point: With over 10 ppt more in unit share than the second and third leading OPE brand, Ryobi wins these sales with a lower price point, with 60% of sales coming in at the lowest price band ($499 and below). Notably, Ryobi did see a 3 ppt growth from Q1 to Q2.
Ryobi leads the market, despite being exclusive to Home Depot: Ryobi continues to hold the top spot as Outdoor Power Equipment brand winner, capturing 21% of unit share and 13% of dollar share — all through a single retail partner, Home Depot. Its dominance underscores the strength of Home Depot’s channel reach and Ryobi’s appeal among value-driven shoppers. Even without a multi-retailer presence, Ryobi’s combination of accessibility, breadth of lineup, and competitive pricing keeps it well ahead of broader-distributed rivals like Ego and Craftsman.
Brand Consideration Rates
When purchasing Outdoor Power Equipment, consumers consider the following three brands most often:
| OPE Brand | Brand Consideration Rate |
| Ryobi | 14% |
| Craftsman | 11% |
| Black & Decker | 8% |
| Toro | 8% |
| Stihl | 8% |
| DEWALT | 8% |
OpenBrand’s OPE Market Trend Insights
Ego ranks high in share but lags in consumer consideration: Despite holding a spot in the top three Outdoor Power Equipment brands for unit and dollar share, Ego doesn’t appear among the six most-considered brands, signaling low top-of-funnel visibility. This gap suggests that while Ego performs strongly once shoppers reach the purchase stage, likely driven by premium positioning and retailer partnerships, its overall awareness and early-stage influence trail behind competitors like Ryobi, Craftsman, and DEWALT. For Ego, growing mindshare could be key to sustaining its market momentum.
Ego captures Ryobi’s lost shoppers despite low consideration: Even though Ego isn’t among the top six most-considered Outdoor Power Equipment brands, it still captures 9% of Ryobi’s lost shoppers, a notable win given Ryobi’s 25% walk rate. The trend highlights Ego’s strength in converting late-stage buyers, often those trading up for higher performance or premium features, despite weaker early-stage awareness. Increasing visibility earlier in the purchase journey could help Ego translate this conversion efficiency into broader share growth.
Explore the drivers and promotions data that may impact low conversion rates in our quarterly Outdoor Power Equipment MarketSignal dashboard.
How are online and in-store sales trending for the Outdoor Power Equipment market?
In Q2 2025, brick-and-mortar stores continued to dominate OPE sales, though online purchases have carved out nearly a third of the market:
- In-store: 69% of purchases
- Online: 31% of purchases
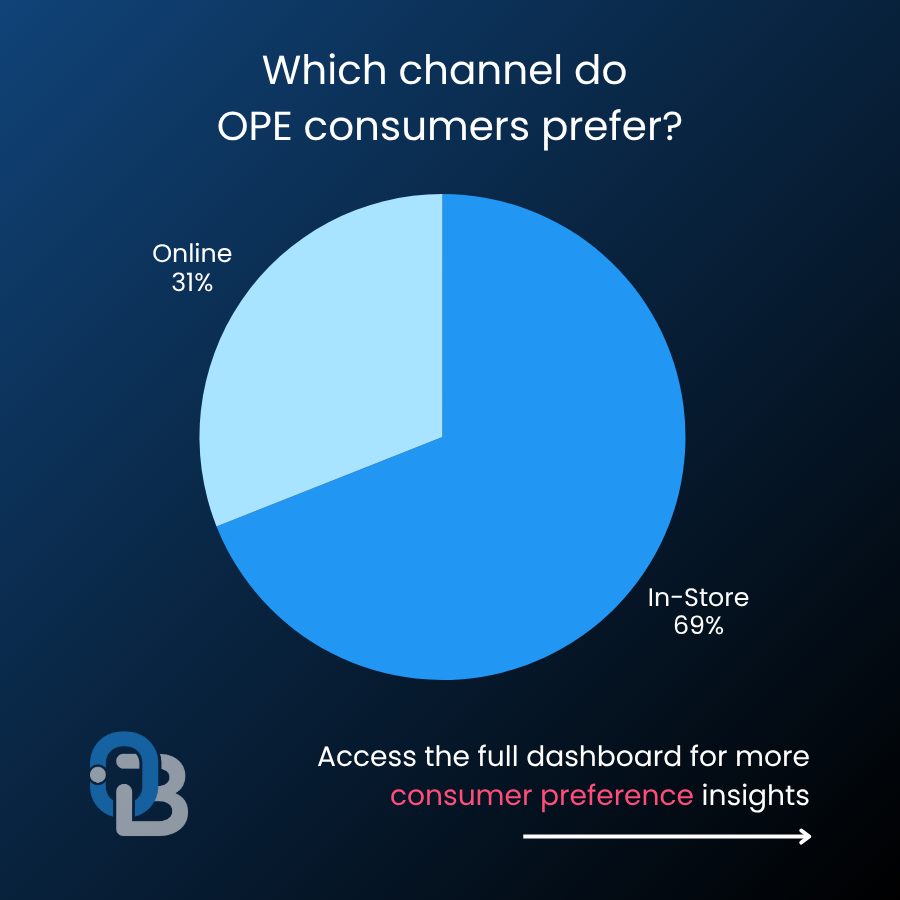
OpenBrand’s OPE Channel Trend Insights
Online Can’t Be Ignored: In-store remains the dominant channel for Outdoor Power Equipment sales, capturing 69% of purchases. However, the 31% of sales happening online signals a major behavioral shift. Amazon’s growing influence in this space is driving much of that movement, reshaping expectations for pricing visibility, delivery speed, and post-purchase support. Brands that align their omnichannel strategy — maintaining consistent pricing, strong digital merchandising, and seamless BOPIS integration — are best positioned to capture the next wave of online-driven growth.
Outdoor Power Equipment Consumer Demographics
OpenBrand’s long-standing consumer tracking survey delivers census-balanced market insights that highlight the typical Outdoor Power Equipment buyer.
As of Q2 2025, Outdoor Power Equipment consumers showed the following traits:
- 76% of purchasers are homeowners, 21% rent
- 56% of purchasers are married
- 69% of purchases were made with males only in the buying process; 31% were made with female only
- 30% of purchases were made by Millennials, coming in just above Gen X buyers (29%)
OpenBrand’s OPE Consumer Trend Insights
OPE buying remains male-dominated, but opportunity exists: Nearly seven in ten OPE purchases involve men as the sole decision-makers. However, a significant 31% are driven by women. As female homeownership and DIY participation grow, expanding product messaging and retail experiences to resonate beyond traditional male audiences could unlock incremental growth.
Homeowners remain the engine of OPE sales: With 76% of purchasers owning their homes, OPE demand continues to be rooted in property maintenance and improvement, signaling that replacement and seasonal upkeep remain key purchase triggers. As rental rates rise nationally, the category’s dependence on homeownership underscores the importance of targeting stable, higher-income households.
OPE Purchase Drivers
Why do consumers select a specific retailer for purchase? The most mentioned reasons for purchasing Outdoor Power Equipment at a specific retailer were:
Why consumers select a specific retailer
- Competitive price — 52%
- Good selection of products — 31%
- Convenient location — 25%
- Previous experience with store — 21%
OpenBrand’s Trend Insights
Value wins in Outdoor Power Equipment retail: More than half of OPE shoppers (52%) cite competitive pricing as their top reason for choosing a retailer, reinforcing the importance of affordability in this category. This price-first mindset aligns with Ryobi’s leadership at Home Depot, where the brand’s dominance in sub-$499 products fuels both shopper traffic and unit share. In a market where cost-conscious homeowners dominate, accessible pricing remains a decisive edge.
OPE Industry Outlook and Emerging Trends
What’s next for the US Outdoor Power Equipment market in 2025?
Looking beyond Q1 2025, several factors are shaping the Outdoor Power Equipment market:
- Sustainability and compliance reshape product strategy: The future means cleaner OPE. Battery-powered equipment continues to gain ground as states tighten emissions rules and phase out gas engines. Brands with mature battery ecosystems are best positioned to meet new standards and capture eco-conscious demand.
- Robotics and automation move from novelty to necessity: Advancements in robotic mowers and connected “smart” tools are redefining the category. As labor costs rise, both homeowners and pros are turning to automation for efficiency and convenience. We can expect to see more higher-capacity battery packs, faster charging, with an emphasis on durability and premium features like bluetooth and smart app compatibility.
- Omnichannel execution grows in importance: In-store still dominates, but online sales continue to climb, with Amazon’s equal close rate to Home Depot shows its potential to gain share. Consistent pricing, strong digital merchandising, and BOPIS integration will separate winners from followers.
- Margin pressure accelerates brand consolidation: Electrification, software integration, and compliance costs are raising barriers to entry. Expect more focus on platform ecosystems, fewer redundant SKUs, and tighter alignment between brands and retail partners to protect profitability.
Get more insight into Outdoor Power Equipment market trends
The market insights don’t stop here.
For more retail sales data, market share, and insights on the Outdoor Power Equipment industry, access the Outdoor Power Equipment MarketSignal dashboard now.

To see insights for other industries or find out how we can help power growth for your business, contact us today.
OpenBrand Expands MarketSignal to Outdoor Power Equipment: Free Quarterly OPE Data
OpenBrand is excited to share the expansion of MarketSignal into the Outdoor Power Equipment (OPE) industry, delivering quarterly data to the market at no-cost.
Building on the success of the Major Appliance launch earlier this year, MarketSignal is a public-facing dashboard designed to put critical market trends into every team’s hands. The dashboard is updated quarterly for ongoing visibility.

Bringing Clarity to the OPE Market
In 2025, the Outdoor Power Equipment market is defined by shifting demand, electrification trends, and increasingly competitive retail dynamics. To help stay ahead of these trends, benchmark KPIs, and back strategy, MarketSignal gives the OPE industry a single, no-cost view of share leaders, pricing and promotion patterns, and consumer behavior.
“After the strong response to OpenBrand’s MarketSignal debut in Major Appliances, expanding to OPE was a natural next step,” said Greg Munves, CEO at OpenBrand. “It’s another way we’re endeavoring to bring transparency to the market – extending availability of high-quality market intelligence to everyone, not just those with enterprise subscriptions.”
What You’ll Find Inside
The dashboard offers a category view of market share leaders, pricing and promotional dynamics, and consumer behavior, giving users a fast way to benchmark the market and a clear path to unlock deeper current time period insights in the full OpenBrand platform.
With any an email to unlock the dashboard, the market can explore:
- Market share leaders across brands and top retailers
- Pricing and promotions trends
- Consumer buying behavior drivers
- And more, updated quarterly
Q2 2025 Outdoor Power Insights from MarketSignal
- Retail leadership: Home Depot leads the Outdoor Power Equipment market with 42% of shoppers drawn to its stores and a 68% close rate, matching Amazon’s conversion efficiency. Lowe’s follows closely, drawing 36% of shoppers but closing at a lower 56%. Walmart ranks third in consideration (19%) but trails in overall share.
- Brand performance: Ryobi holds the clear lead with 22% unit share — double that of Craftsman (10%) and Ego (9%) — despite selling exclusively through Home Depot.
- Online vs. in-store: In-store remains dominant at 69% of purchases, but online sales now represent 31%, a fast-growing segment led by Amazon’s strong close rates.
Consumer demographics: Millennials (30%) and Gen X (29%) account for the majority of OPE buyers, with homeowners (76%) and married households (56%) driving the category. - Purchase drivers: Price remains the defining factor for retailer choice, cited by 52% of OPE shoppers, followed by product selection (31%) and location (25%).
Inside the dashboard, an “Unlock Full Access” call-to-action guides users to subscribe for current-quarter performance, greater granularity (brand/retailer/sub-category), item-level price & promo analytics, exports, and more.
With today’s launch, the MarketSignal dashboard is available for Major Appliances and Outdoor Power Equipment. Plans to increase coverage to more groups of categories over time are already underway, with Consumer Electronics up next.

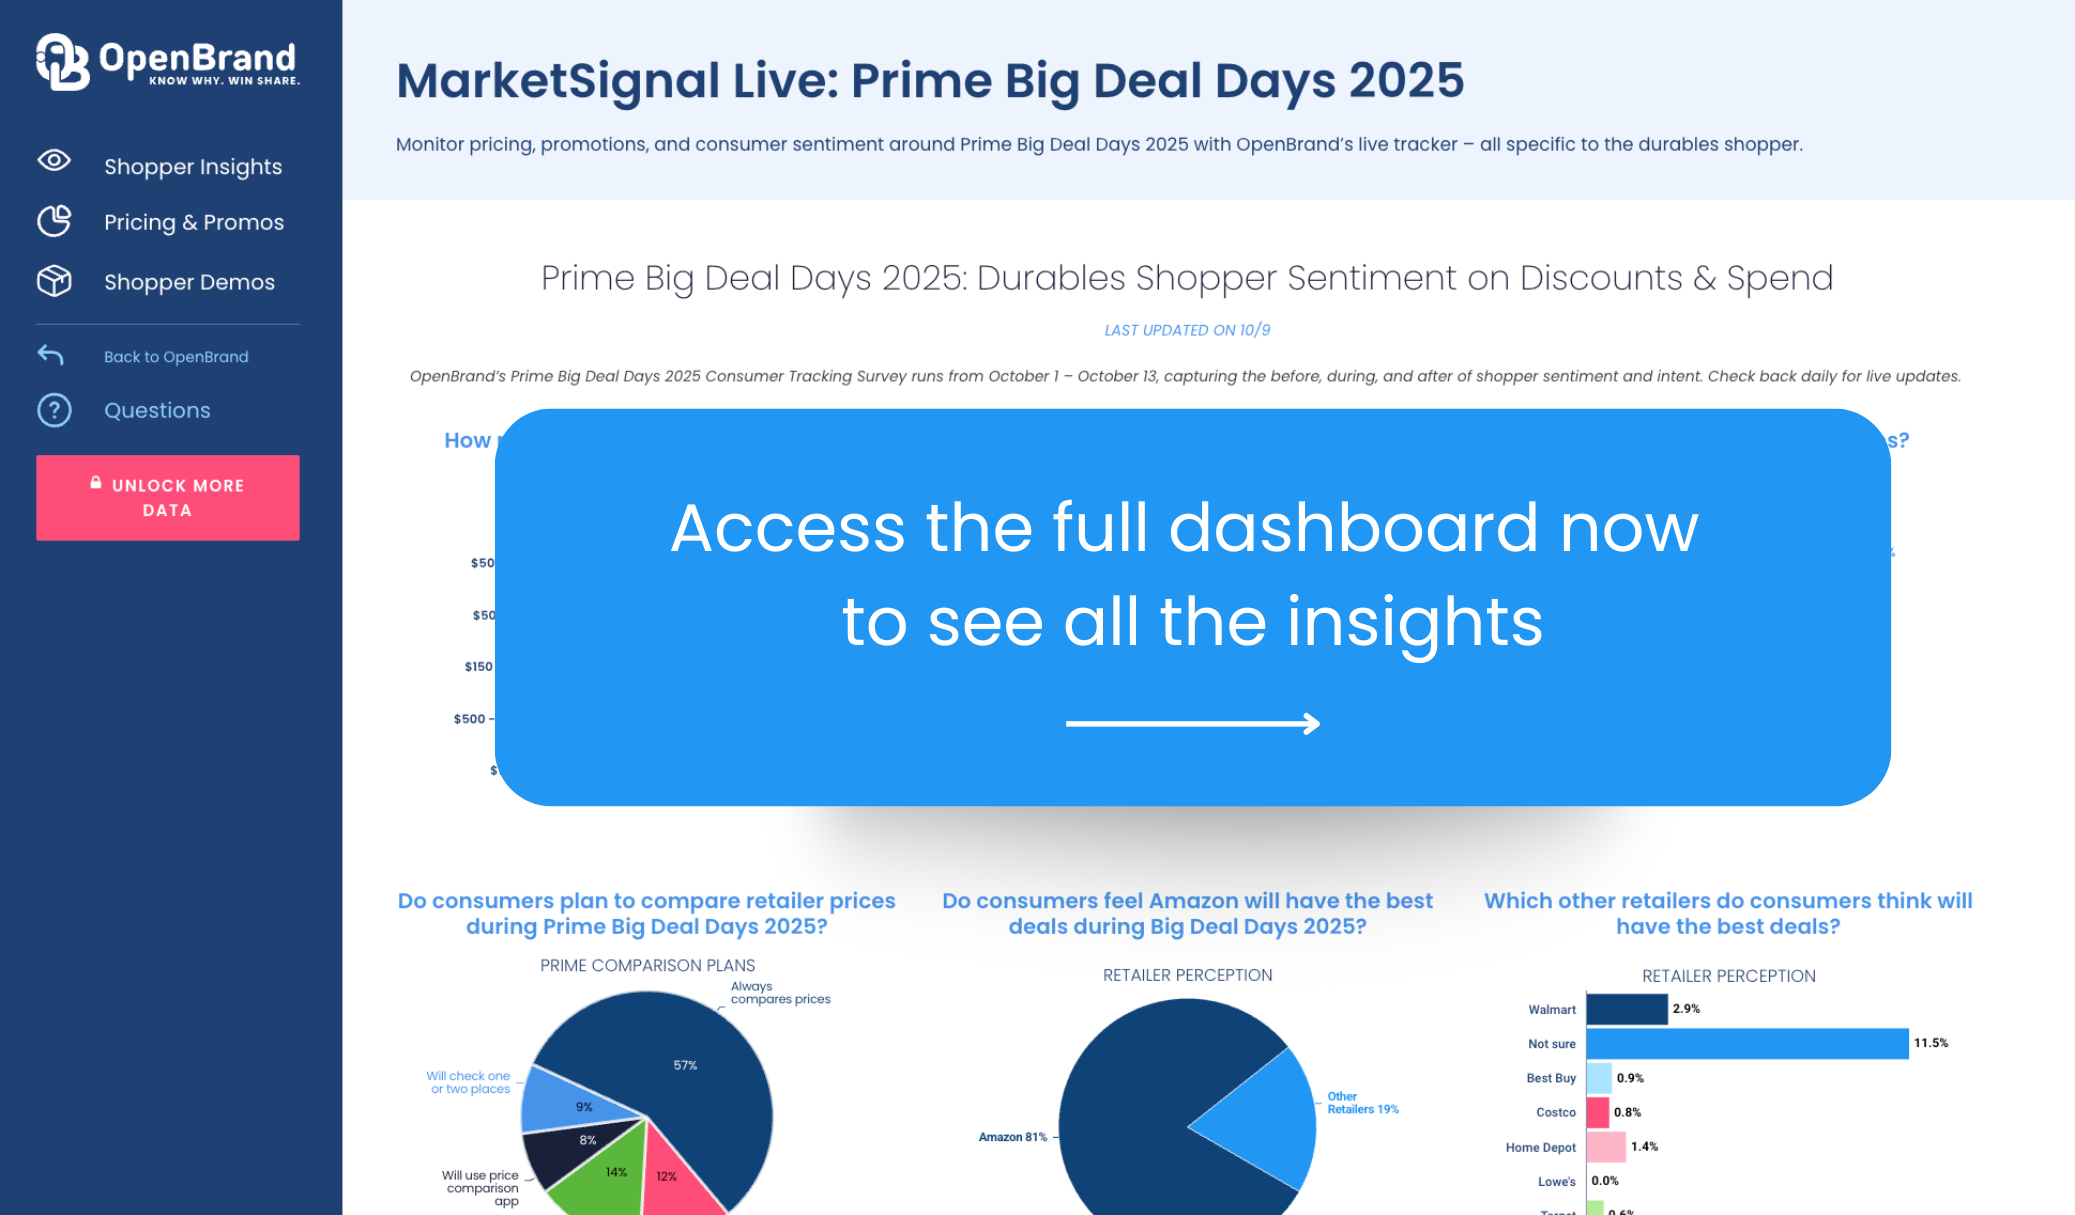
Prime Big Deal Days Trends 2025: Durables Shopper Intent & Promotions
From Prime Day in July to Prime Big Deal Days in the Fall and Amazon’s sales during Black Friday and Cyber Week, each new Prime sales Event reshapes how consumers shop, how brands promote, and how the broader market responds.
With continuously record-breaking participation across Amazon and its major retailer competitors, this latest Prime Event revealed meaningful shifts in spend, shopper intent, and promotional behavior across the durables market.
OpenBrand’s real-time Prime Day Sales Trends Trackers capture these movements as they happen, offering a category-level view into pricing, promotions, and shopper sentiment across the full event window.
SOURCE: All data insights in this article cover the rolling four quarter period ending Q1 2025 within the OpenBrand Market Measurement suite. This category covers an aggregate of several products including Refrigerator, Clothes Washer, Clothes Dryer, Dishwasher, Freezer, Free-Standing Range, Cooktop, Wall Oven, Compact Refrigerator, and Built-In Range.
Prime Big Deal Days 2025: Key Durables Market Insights
- Consumer intent vs. action diverged. Shoppers planned to buy Home Improvement (43%) and Small Appliances (35%), but actual purchases centered on Consumer Electronics (31%), Home Goods (30%), and Tools (12%)
- Consumer budgets tightened. The share spending under $150 rose from 57% planned to 67% actual, signaling increased price sensitivity or low promotional appeal
- Discounts deepened. Average markdowns ranged 20–25%, led by Recreation (TVs, Headphones) and Communication (Smartphones, Monitors, Wearables)
- Amazon still led (81%), but nearly 1 in 5 shoppers credited other retailers, with Walmart strongest among competitors
- Comparison is routine. 57% of shoppers always compare prices; only 14% buy solely on Amazon
- 9,345 unique promotions were tracked across durables
Durables-First Prime Day Data & Insights
Not all insights are created equal. As Prime events continue to set new records, OpenBrand delivers what others cannot: a complete view of the consumer durables shopper journey.
Most Prime Event recaps blend together consumer-packaged goods (CPG), perishables, and general merchandise. OpenBrand’s analysis focuses only on durable goods—where the products, price movements, and promotional dynamics behave entirely differently. [See what makes durables shoppers unique compared to CPG.]
By concentrating on high-consideration categories, OpenBrand provides clarity where it matters most: understanding how shoppers make complex purchase decisions, how promotions influence conversion, and how price perception shapes outcomes across the durables market.
OpenBrand’s live Prime Event Trackers presents a view of shopper behavior, promotional trends, and pricing effectiveness across durables categories to highlight where durables brands and retailers should focus heading into the next wave of key promotional events.
Check out the tracker now or read on below for a peek into data highlights for Prime Big Deal Days 2025.
Durables Shopper Intent vs. Actual Behavior
OpenBrand’s targeted Prime Consumer Tracker Survey runs before, during, and after the event, capturing intent and sentiment of shoppers specific to the consumer durables market. Respondents are classified based on the types of products they reported shopping for or purchasing, and all data is weighted against the U.S. Census.
Here are a few callouts of the data from OpenBrand’s latest survey on Prime Big Deal Days 2025.
What categories did most consumers purchase on Prime Big Deal Days 2025?
While most consumers entered Prime Big Deal Days planning to buy consumer electronics and home goods, the data below reveals how plans shifted once deals went live.

While these were still the top categories purchases, each saw nearly a 15-point gap between what consumers expected to buy and what they actually purchased.
In fact, every major durables category underperformed against pre-event intent, signaling that shoppers were more cautious and selective once live pricing and promotions appeared.
| Category | Planned Purchases | Actual Purchases | Change |
| Consumer Electronics | 44.9% | 30.7% | -14.2 ppt |
| Home Goods | 44.2% | 30.3% | -13.9 ppt |
| Large Appliances | 12.1% | 9.4% | -2.7 ppt |
| Small Appliances | 35.1% | 19.6% | -15.5 ppt |
| Tools | 22.2% | 12.3% | -9.9 ppt |
Small Appliances saw the steepest drop — from 35% planned to under 20% purchased — suggesting limited perceived value or competing category appeal.
This pattern indicates intent compression, where consumers start the event with broad shopping interest but narrow their spending to the most compelling promotions and visible deals once the event begins.

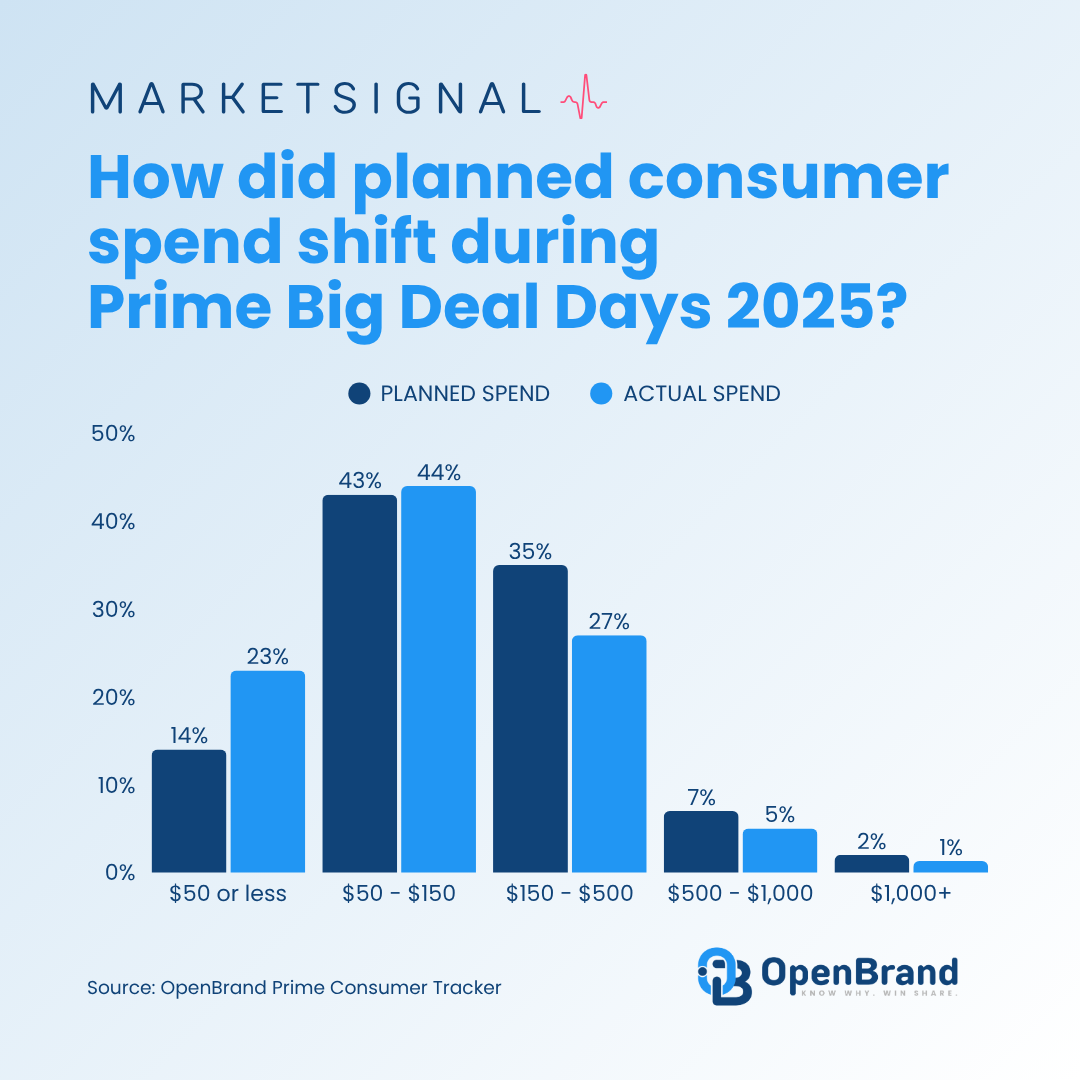
How much did consumers spend during the Prime Big Deal Days Event?
Nearly 60% of shoppers spent less than $150, even though most planned to spend more.
| Price Band | Planned Spend | Actual Spend | Change |
| $50 or less | 14% | 23% | +9 ppt |
| $50 - $150 | 43% | 44% | +1 ppt |
| $150 - $500 | 35% | 27% | -12 ppt |
| $500 - $1,000 | 7% | 5% | -2 ppt |
| $1,000+ | 2% | 1.3% | -0.7 ppt |
OpenBrand’s Insights Repackaged:
- A Return to Cautious Spending? The data points to a return to disciplined spending, even within deal-heavy environments — a shift that could reflect broader inflation fatigue or promotional fatigue in late 2025.
- Spending consolidated in the lower tiers, with the share of shoppers spending under $150 rising from 57% planned to 67% actual.
- The mid-tier ($150–$500) bracket fell by more than 7 points, showing reduced elasticity for higher-ticket items compared to previous events.
- This suggests consumers were more selective and budget-conscious, prioritizing categories with visible value and tangible discounts rather than larger discretionary purchases.
- Compared to July’s Prime Day 2025, this is a shift. Consumers planned to spend less, but ultimately spent more.
Pricing & Promo Performance: Data-Backed Tactics
OpenBrand’s pricing and promotions data was collected in real time during the Prime Big Deal Days sales event. Our optical processing technology interprets unstructured data with human-like understanding, enabling exceptional accuracy and market-scale visibility.
Across the internet, Prime Big Deal Days saw:
- 9,345 unique promotions
- 23% average discount across durables
- Highest discount percent: Vacuums at an average of 27.6% and TVs at an average of 26.9%
- Highest average savings: TVs at $384
While average discounts ranged from ~20% to 25%, the real takeaway lies in how shoppers responded to price-to-value balance by category.
| Category | Average Net Price | Average Savings | Average Discount |
| Recreation (TVs, Headphones) | $457 | $146 | 24.7% |
| Communication (Printers, Monitors, Smartphones, Tablets, Wearables) | $431 | $103 | 24.4% |
| Home Improvement (OPE & Tools) | $250 | $77 | 23.6% |
| Appliances (Large & Small) | $206 | $63 | 20.6% |
OpenBrand’s Key Takeaways
- Recreation and Communication categories (including TVs, headphones, and mobile devices) led the pack with discounts around 25%, generating the highest dollar savings per purchase.
- Home Improvement followed closely, signaling strong value-driven engagement even in mid-tier price ranges.
- Appliances saw more modest discounts (around 20%), suggesting brands maintained tighter control on margin while still leveraging deal visibility.
- Despite similar percentage discounts, higher-ticket categories produced greater perceived value, reinforcing why consumers often shift their actual spending toward them once events begin.
To see the breakdown by product, check out the latest Prime tracker.
Retailer Behavior: How Shoppers Compared Deals and Where They Found the Best Value
What started as a single-platform sales event has evolved into a retail ecosystem moment. Each new Prime Event now sparks participation across the entire marketplace, with major retailers launching competing promotions and consumers using every tool available to compare prices in real time.
For durables shoppers, that means “Prime” no longer begins and ends with Amazon. Now, it defines a multi-retailer, multi-channel buying window where value perception, pricing transparency, and promotional timing determine who wins the sale.
Price Comparison Is Now a Standard Behavior
Durables shoppers are entering each event more analytical than ever. According to OpenBrand’s tracker, 57% of consumers say they always compare prices, while another 9% check one or two other sources before purchasing.
Even in a Prime-branded event, only 14% of shoppers say they buy exclusively on Amazon. Nearly one in five now use dedicated price comparison apps, confirming that deal validation is part of the modern shopping routine.
| Price Comparison Behavior | Share of Shoppers |
| Always compares prices | 57.2% |
| Will check one or two places | 8.9% |
| Will use a price comparison app | 7.7% |
| Only shops Amazon | 14.2% |
| Might compare but no plans | 12.1% |
OpenBrand’s Insights Repackaged: Shoppers are consciously verifying value across platforms before committing to a purchase, even during sales event like Prime Days.
Amazon Still Leads, but Competitors Earn Credibility
Amazon continues to set the benchmark for deal quality, with 81% of shoppers naming it as offering the best discounts. Still, nearly 19% credited other retailers, proving that the competitive halo around Prime Events is real and growing.
| Retailer | Share of Shoppers Naming “Best Deals” |
| Amazon | 81.2% |
| Other Retailers (combined) | 18.8% |
| – Walmart | 2.9% |
| – Best Buy | 0.9% |
| – Costco | 0.8% |
| – Home Depot | 1.4% |
| – Not Sure | 11.5% |
Walmart continues to hold the strongest non-Amazon position, followed by Best Buy, Costco, and Home Depot—all of which benefit from spillover traffic as shoppers cross-check pricing and promotions during the Prime window.
Get all the Prime Big Deal Days insights and prepare for the next big event
If you’re planning for other promotional events, now is the time to rebuild your promotional playbook with data that cuts out the manual work so you can spend more time acting on what’s happening in the market.
Are you tracking the market in real-time? Let’s get you the insights you need — before the next big event hits. Book a 15-minute conversation now to get started.
OpenBrand Brings Modeled Market Share Data to Consumer Electronics
We are excited to announce the expansion of OpenBrand’s unparalleled modeled market share data into the Consumer Electronics category group.
 With this update, our full total market insights suite is now available for Consumer Electronics, delivering the critical combination of market share, consumer insights, and pricing and promotions data all in one place for more in-depth and actionable market understanding.
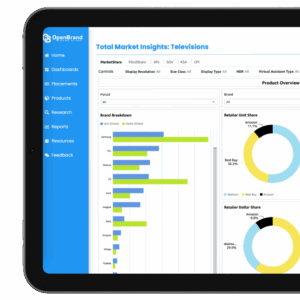
This update brings market share visibility to some of the most competitive and fast-moving Consumer Electronics categories:
- Desktops
- Monitors
- Notebooks
- Smart Thermostats
- TVs
- Wearables
- Tablets & Detachables
- Wireless Routers
This expanded coverage provides the clarity Consumer Electronics brands and retailers need to track performance, anticipate shifts, and make smarter decisions in this dynamic market.
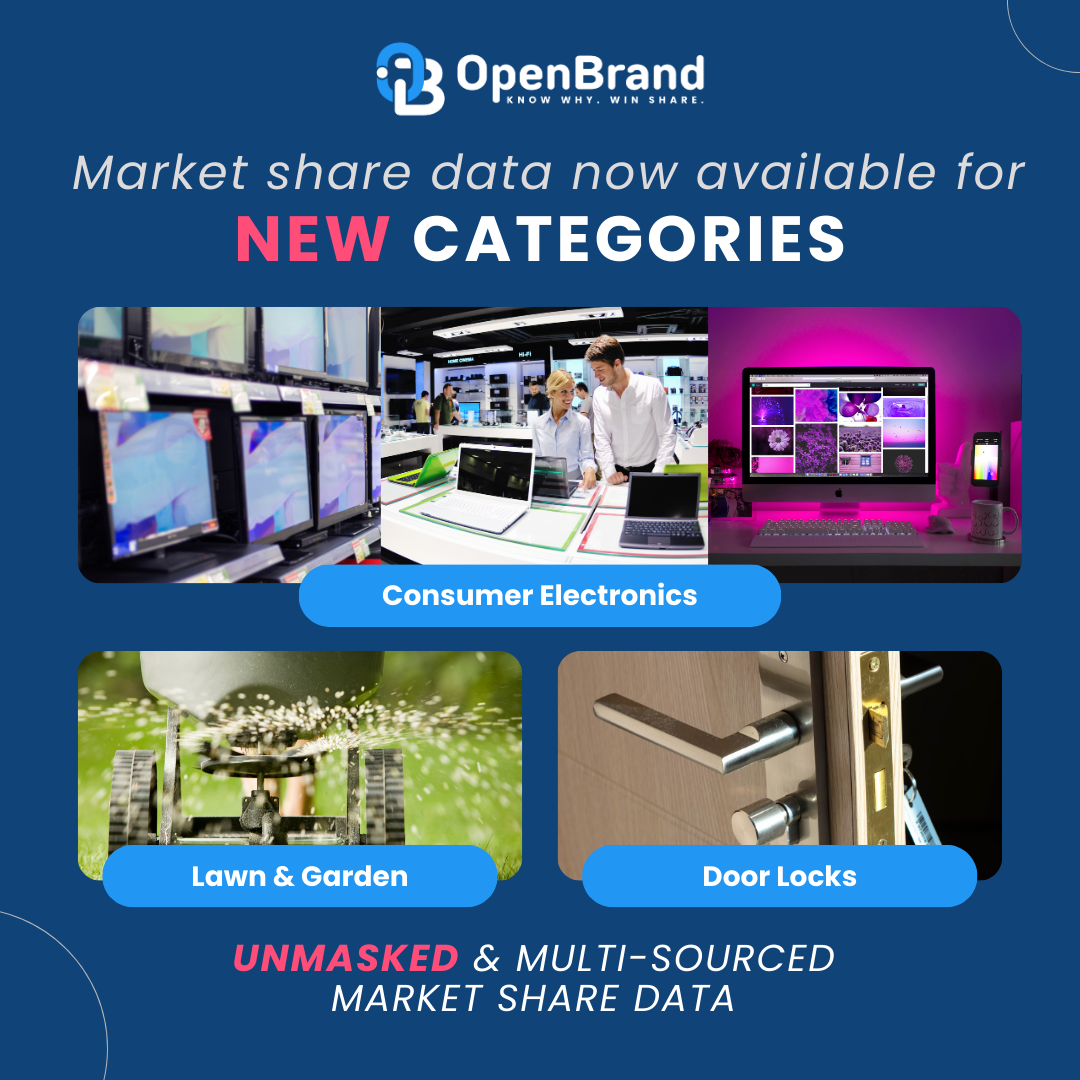
Additionally, with this launch we also bring market share data to the Door Locks and Lawn & Garden categories. These categories join our existing suite, which already includes Major Appliances, Hand Tools, Outdoor Grilling, Outdoor Power Equipment, Power Tools, and Small Appliances. A full list of available categories can be found below.
What This Expansion Delivers
With this release, Consumer Electronics brands and retailers gain access to the only solution that pairs modeled market share with consumer insights and competitive pricing and promotions data to deliver a complete picture of what is happening in the market – and why.
Why our market share is a game changer for Consumer Electronics
Where traditional market share data falls short due to reliance on fragmented inputs and/or narrow samples, OpenBrand overcomes this with a proprietary dynamic data model that integrates multiple sources and delivers unmasked share data. Through our proprietary model, we now deliver the most reliable and holistic view of the Consumer Electronics market, and clarity that empowers stronger, strategic decision-making.
We go deeper than any other provider, with visibility down to the brand, retailer, and SKU level.
| What Other POS Providers Deliver | What OpenBrand Delivers |
| Masked Share Data | Unmasked Share Data |
| Single Source (POS) | Multi-Sourced |
| Retailer-reliant | Retailer-agnostic |
| Category level with uneven SKU depth | Consistent SKU coverage with variant mapping |
| Share without clear drivers | Share with drivers linked to price, promo, and consumer insights |
When paired with consumer insights and pricing and promotions data, this depth unlocks true total market understanding. Know not just who is winning but why – and what to do next.
With OpenBrand total market insight, brands and retailers can:
- Know who’s winning with unit and dollar share leaderboards backed by consumer sentiment.
- Act on gains and losses fast by drilling into brand, retailer, and SKU performance with pricing and promotion context.
- Uncover true growth drivers by seeing which models, features, and configurations are fueling demand.
- Decode competitor moves with visibility into assortment, pricing, and promotional strategies and how shoppers respond.
- Stay ahead of shifts by tracking trends across categories and periods, paired with consumer insight into what’s coming next.
OpenBrand continues to expand our data into new categories, striving to further empower clients through data. Subscribe to our product updates for email notifications when new data is available.
See Total Market Insight for Consumer Electronics
In a category as dynamic and competitive as Consumer Electronics, having this clarity is no longer optional — it’s essential. OpenBrand empowers leaders to not just understand the market, but to stay ahead of it.
Request a demo today to see how OpenBrand’s combined market share and consumer insights reveal the full picture of Consumer Electronics performance — helping your business track shifts, uncover opportunities, and stay ahead of the competition.
Available MarketShare Categories
UPDATED MARCH 2026
CONSUMER ELECTRONICS
Desktops
Notebooks
Monitors
Smart Thermostats
Tablets & Detachables
TVs
Wearables
Wireless Routers
HARDWARE
Door Locks
KITCHEN & BATH
Bathroom Faucet
Bathroom Sink
Bathroom Vanities
Bathtubs
Kitchen Faucets
Kitchen Sink
Shower Doors
Shower Head
Stall & Enclosures
Toilets
LAWN & GARDEN
Garden Hose
Grass Seed
Lawn Fertilizer
Pesticides
Weed Killer
MAJOR APPLIANCES
Air Conditioner
Compact Refrigerator
Cooktops & Wall Ovens
Dishwashers
Freezers
Laundry
OTR Microwaves
Ranges
Range Hood
Refrigerators
OUTDOOR COOKING
BBQ Grills
Griddles
Kamado Grills
Pellet Grills
Pizza Oven
Smokers
OUTDOOR POWER
Chainsaws
Edgers
Generators
Hedge Trimmers
Leaf Blowers
Line Trimmers
Pressure Washers
Riding Mowers
Snow Removal
Walk-Behind Mowers
ZTR Mowers
POWER TOOLS
Air Compressors
Angle Grinders
Belt Sanders
Circular Saw Blades
Impact Drivers
Jig/Sabre Saws
Power Drills
Power Multi-Tools
Nail Guns
Orbital Sanders
Reciprocating Saws
Rotary Tools
Routers
Table Saws
Wet-Dry Vacs
PAINT & STAIN
Paint, Exterior
Paint, Interior
Primers
Spray Paint
Stains, Exterior
Stains, Interior
SMALL APPLIANCES
Blenders
Coffee Makers
Countertop Microwaves
Electric Grills
Mixers
Toaster Ovens
Vacuums
OpenBrand Introduces MarketSignal: Free Dashboard Delivering Quarterly Market Data for Brands & Retailers
Today OpenBrand announced the launch of MarketSignal, a no-cost dashboard, providing a quarterly data snapshot designed to put critical market trends into every team’s hands.
MarketSignal offers a category view of market share leaders, pricing and promotional dynamics, and consumer behavior, giving users a fast way to benchmark the market and a clear path to unlock deeper, current-quarter insights in the full OpenBrand platform.
MarketSignal reflects OpenBrand’s commitment to bring clarity to the market and to empower better decision-making across the industry. For the first time, anyone in the industry can access a client-level view of the market, including retailer rankings, brand share, pricing trends, and consumer behavior — without a subscription.
By opening a streamlined view at the industry level, MarketSignal provides manufacturers, retailers, and analysts with a transparent look at the forces shaping consumer demand.
“MarketSignal democratizes high-quality market intelligence,” said Greg Munves, CEO at OpenBrand. “In minutes, leaders can benchmark where the market is and see exactly how much more is possible with our full platform — real-time visibility, advanced filtering, and the exportable data they need to act.”
With today’s launch, the MarketSignal dashboard is available for Major Appliances. Plans to increase coverage to more groups of categories over time are already underway, with Outdoor Power Equipment up next.
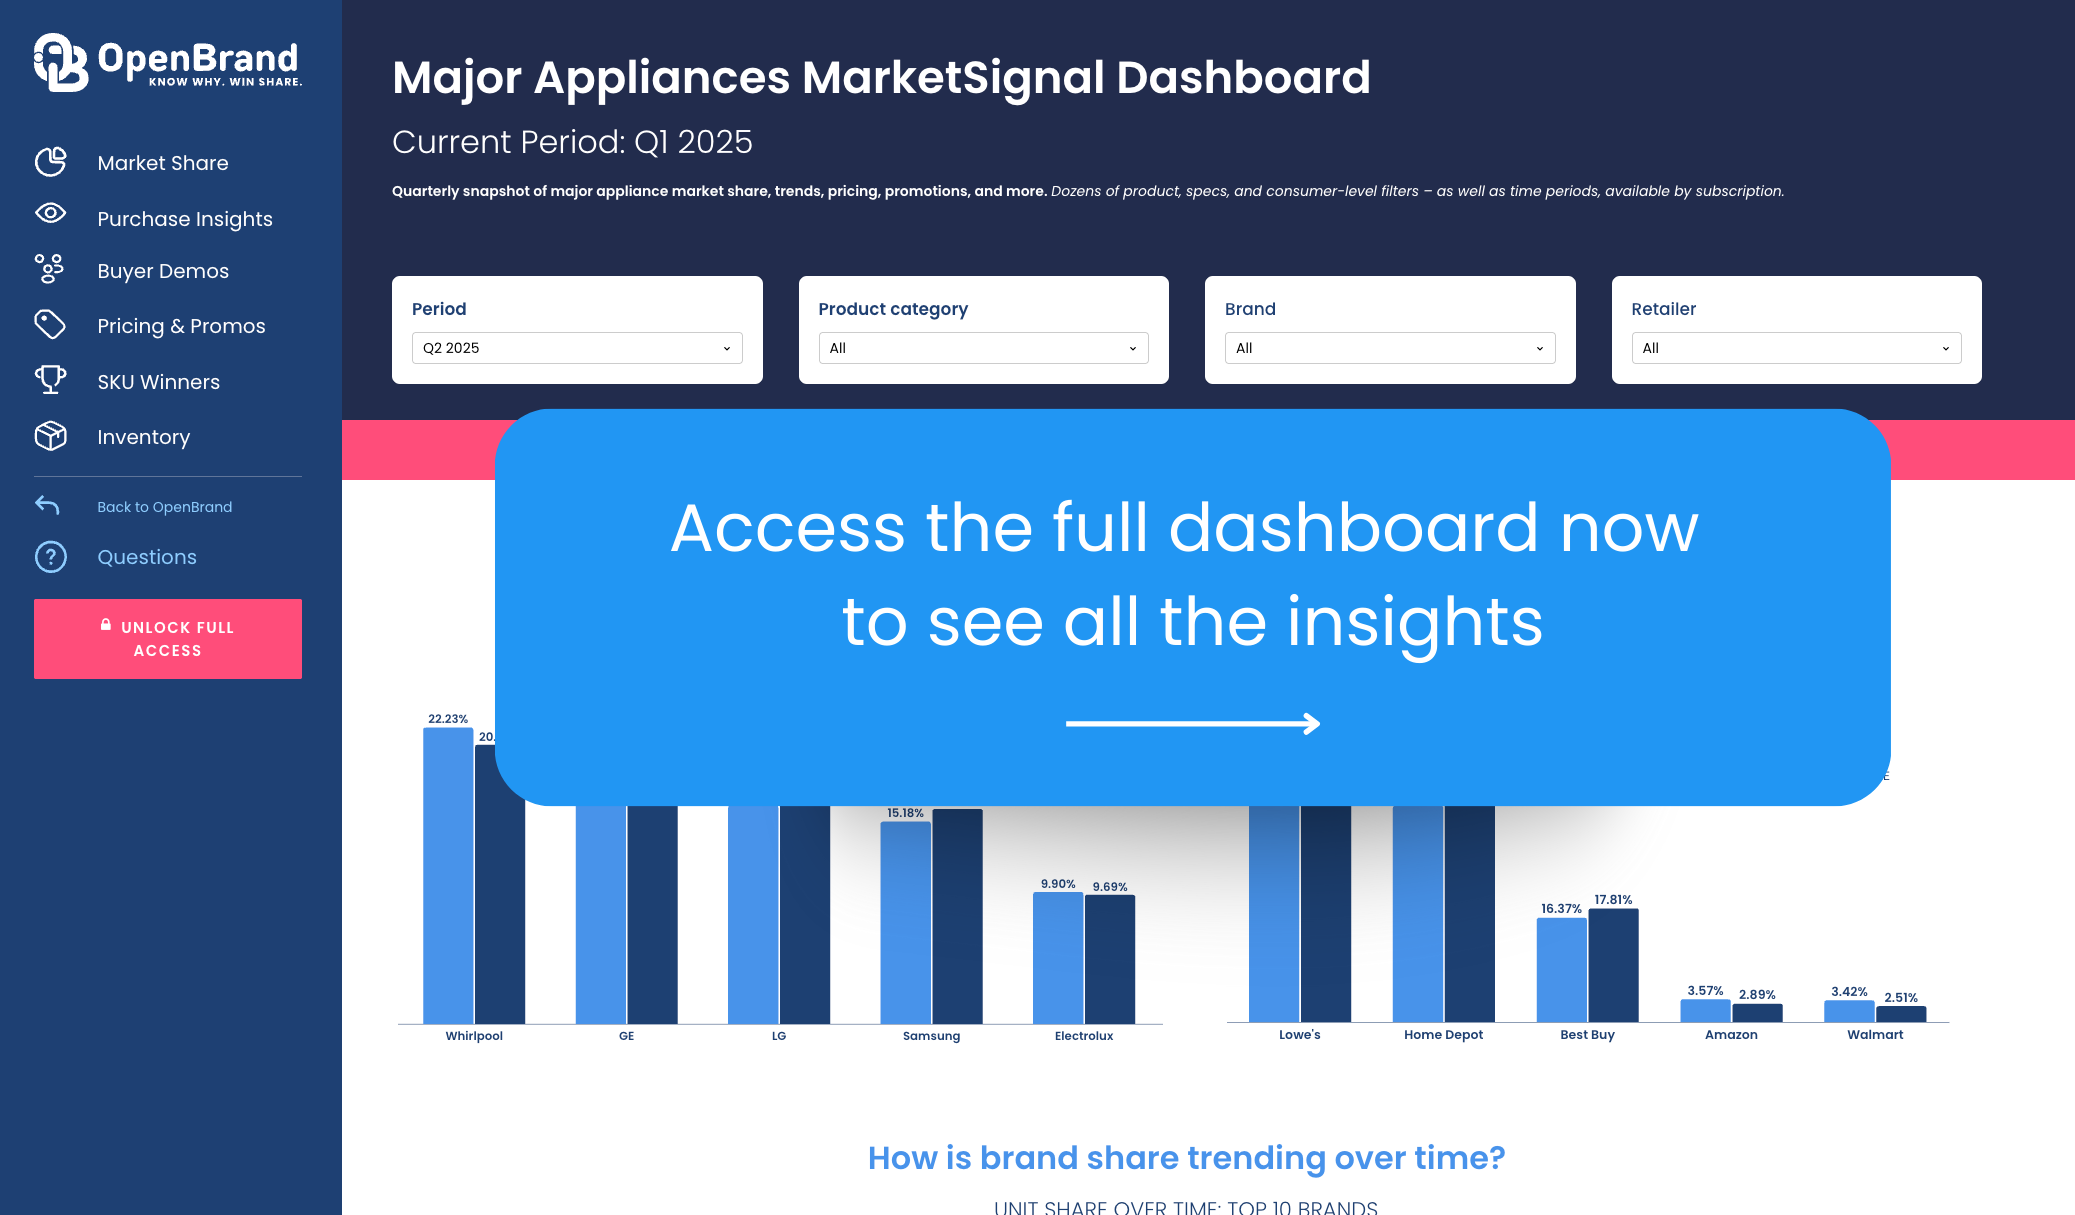
Q1 2025 Major Appliance Insights from MarketSignal
- Retail leadership: Lowe’s leads with 42.7% of unit share and 41.0% of dollar share, outpacing Home Depot and Best Buy. Home Depot, however, is gaining ground in shopper draw rates.
- Brand performance: Whirlpool (22.2% unit share) and GE (21.4%) hold the top spots, while LG and Samsung remain highly considered by nearly one-third of consumers.
- Online vs. in-store: Brick-and-mortar remains dominant, but online now represents 26.1% of purchases — underscoring the importance of omnichannel pricing and digital merchandising.
Consumer demographics: Millennials (31%) and Gen X (29%) now make up the majority of appliance buyers, signaling a shift toward more digitally influenced shopping journeys. - Purchase drivers: Competitive pricing remains the top factor (58%), followed by product selection (32%) and convenient location (29%).
Inside the dashboard, an “Unlock Full Access” call-to-action guides users to subscribe for current-quarter performance, greater granularity (brand/retailer/sub-category), item-level price & promo analytics, exports, and more.

US Major Appliance Market Share: Q1 2025 Trends & Rankings
The first quarter of 2025 confirmed what many in the industry suspected — the major appliance market is evolving faster than ever, with shifts in where consumers buy, which brands they trust, and what drives them to purchase.
From the dominance of big-box retailers to the growing share of online sales, the latest data shows a highly competitive environment where leaders are widening their gap and challengers are working to gain ground.
Our public MarketSignal dashboard brings this story to life, offering a deeper, interactive look at retailer rankings, brand share, pricing trends, and consumer behavior.
Read on for key takeaways from Q1 2025 or access the dashboard to explore the data for yourself.

SOURCE: All data insights in this article cover the rolling four quarter period ending Q1 2025 within the OpenBrand Market Measurement suite. This category covers an aggregate of several products including Refrigerator, Clothes Washer, Clothes Dryer, Dishwasher, Freezer, Free-Standing Range, Cooktop, Wall Oven, Compact Refrigerator, and Built-In Range.
Who are the top major appliances retailers by market share?
The top major appliance retailers in 2025 are Lowe’s and Home Depot, leading in both unit and dollar share.
Major Appliances Retailer Unit Share Winners
| Major Appliance Retailer | Q1 2025 Unit Share |
| Lowe's | 43% |
| Home Depot | 34% |
| Best Buy | 16% |
Major Appliances Retailer Dollar Share Winners
| Major Appliance Retailer | Q1 2025 Dollar Share |
| Lowe's | 41% |
| Home Depot | 37% |
| Best Buy | 18% |
OpenBrand’s Q1 Major Appliance Trend Insights
- Lowe’s leads the pack – by far: Lowe’s outpaces Home Depot by nearly 9 percentage points in unit share and more than 5 points in dollar share, underscoring its continued strength with appliance shoppers. Additionally, when we examine the performance/share by store count, Lowe’s overindexes relative to Home Depot and Best Buy. Simply put: Lowe’s accounts for ~23% more appliance units per location than expected (41% units on 33% of locations), while HD and Best Buy under-index by ~22% and ~21%, respectively.
- Best Buy fills a niche for tech-inclined shoppers: While Best Buy falls in third place for share overall, they keep in line with Home Depot regarding performance per store – suggesting its targeted appliance strategy resonates with tech-oriented buyers.
Major Appliance Retailer Draw Rates
Our top market leaders also continue to lead in outlet draw rate, with:
- Lowe’s drawing in 45.20% of all consumers who bought Major Appliances
- Home Depot drawing in 43.11%
- Best Buy follows as the third most-visited outlet, drawing 17.57% of consumers
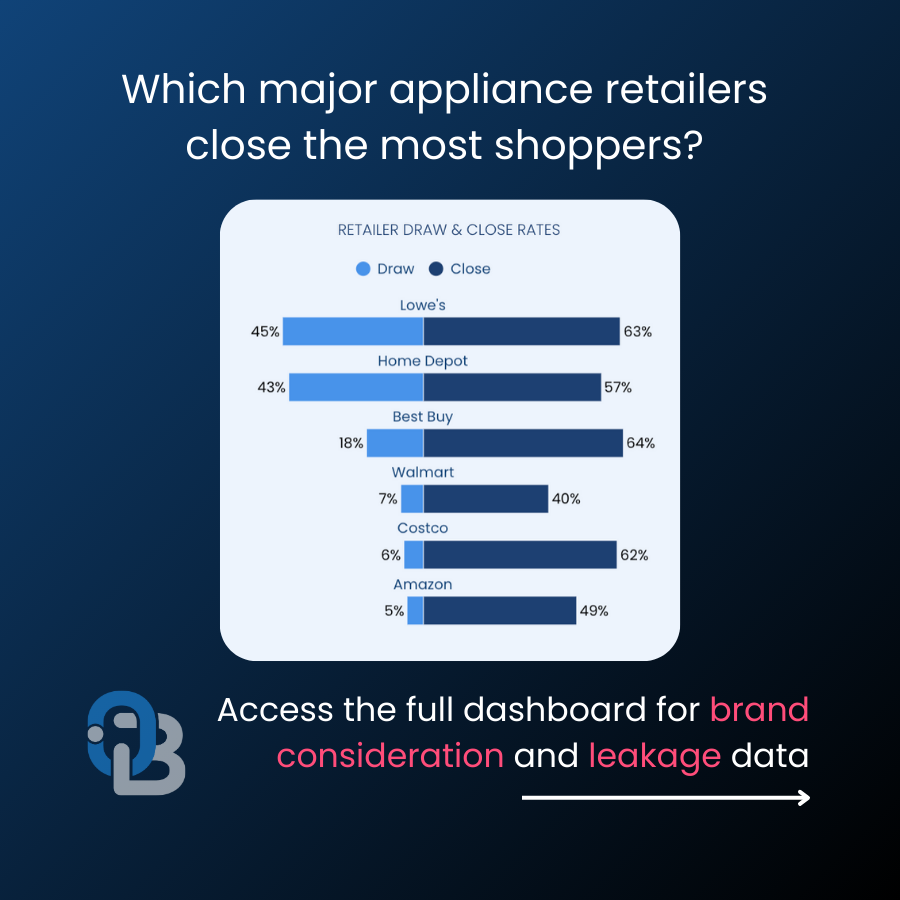
OpenBrand’s Q1 Major Appliance Trend Insights
- Home Depot is closing the gap in draw rate: Compared to prior years, Home Depot is seeing a significant increase in shoppers over the last several quarters compared to Lowe’s. Additionally, Home Depot also saw gains from a significant YOY draw rate decline at Best Buy.
- Lowe’s remains best on the sales floor: Lowe’s still holds a slight advantage in converting browsing customers into buyers.
For more insights on draw rates — and to see how these retailers compare in closing the consumers they brought in — quarterly major appliances MarketSignal dashboard.
Who leads the major home appliances market share by brand?
The top major appliance brands are Whirlpool, GE, LG, and Samsung, all holding double-digit share in both units and dollars.
Major Appliances Brand Unit Share Winners
| Major Appliance Brand | Q1 2025 Unit Share |
| GE | 19% |
| LG | 17% |
| Samsung | 16% |
| Whirlpool | 15% |
Major Appliances Brand Dollar Share Winners
| Major Appliance Brand | Q1 2025 Dollar Share |
| GE | 20% |
| LG | 19% |
| Samsung | 17% |
| Whirlpool | 12% |
OpenBrand’s Q1 Major Appliance Trend Insights
Trust & reliability outweigh innovation: Whirlpool and GE’s continued strength is notable in a market where Korean brands LG and Samsung have aggressively pursued innovation-led growth. This suggests while drivers like price and variety of product offerings influence purchase decisions most, reliability and consumer trust are still powerful brand assets in the appliance category.
Brand Consideration Rates
When purchasing major appliances, almost a third of all consumers consider these top four brands in their purchase.
| Major Appliance Brand | Brand Consideration Rate |
| LG | 31.8% |
| Samsung | 31.79% |
| GE | 27.69% |
| Whirlpool | 27.05% |
Interestingly, while Whirlpool holds 15.76% of the market in unit share, they have a consideration rate that nearly matches LG and GE.
OpenBrand’s Q1 Major Appliance Trend Insights
- LG and Samsung lead all brands in consideration: Each approaches one-third of consumers, while GE and Whirlpool follow close behind at just over a quarter.
- Whirlpool has an opportunity to improve: High consideration rates don’t always translate to market share — Whirlpool in particular over-indexes on consideration relative to sales, signaling potential opportunity if conversion strategies are improved.
Explore the drivers and promotions data that may impact low conversion rates in our quarterly major appliances MarketSignal dashboard.
How are online and in-store sales trending for the Major Appliance market?
In Q1 2025, brick-and-mortar stores continued to dominate, though online purchases have carved out over a quarter of the market:
- In-store: 73.89% of purchases
- Online: 26.11% of purchases
OpenBrand’s Q1 Major Appliance Trend Insights
Online Can’t Be Ignored: While in-store remains the dominant channel, the online segment’s 26% share underscores the need for brands to maintain omnichannel pricing consistency and invest in digital merchandising. Retailers that have streamlined buy-online-pickup-in-store (BOPIS) processes are capturing a disproportionate share of online sales growth.
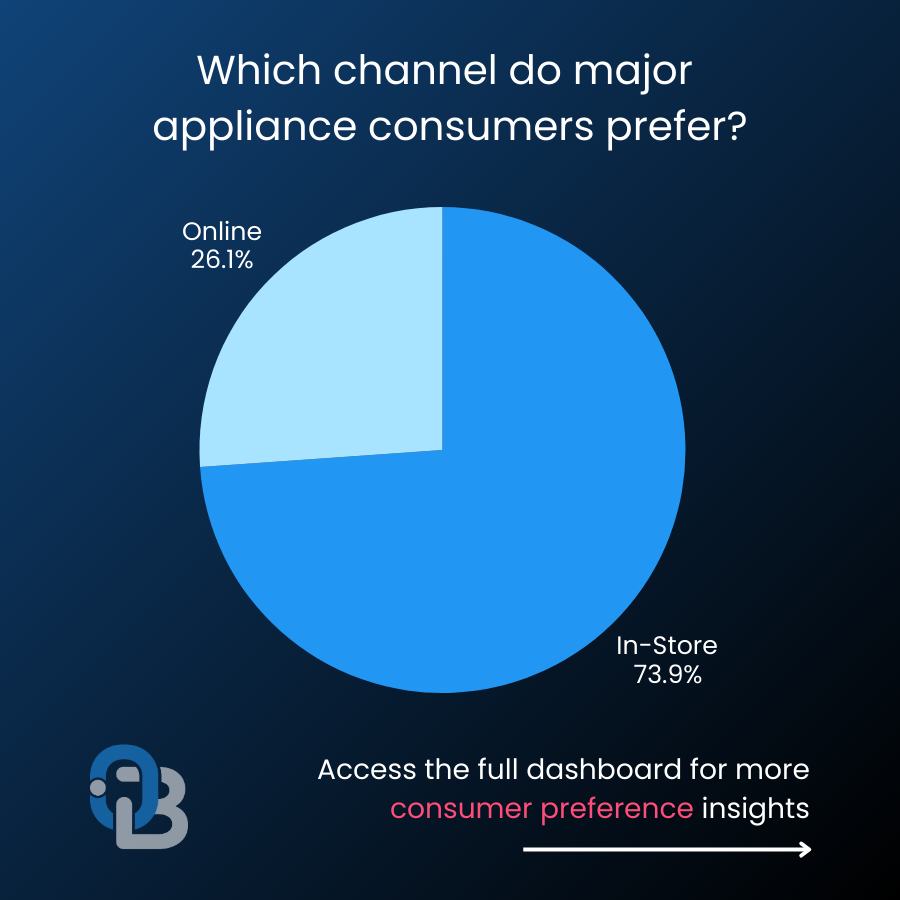
Major Appliance Consumer Demographics
OpenBrand delivers census-balanced market insights that highlight the typical Major Appliance customer.
As of Q1 2025, Major Appliance consumers showed the following traits:
- 75.14% of purchasers are homeowners, 21.94% are renters
- 56.27% of purchasers are married
- 60.21% of purchases were made with males only in the buying process; 39.79% were made with female only
- 60.37% of purchases were made by Millennials or Gen Xers
- 31.03% were Millennials
- 29.34% were Gen X
OpenBrand’s Q1 Major Appliance Trend Insights
Major appliance consumers skew younger: Millennials lead as the largest buying segment for the category with Gen X right behind. Millennials and Gen Z have grown significantly as key purchasers while Boomers and Matures saw significant decline overall.
Millennial preferences drive today’s market: Additionally, the uptick in Millennial purchasers signals a shift toward more digitally influenced buying journeys as well as an increasing interest in smart or energy-efficient features.
Major Appliance Purchase Drivers
Why do consumers select a specific retailer for purchase? The most mentioned reasons for purchasing major appliances at a specific retailer were:
Why consumers select a specific retailer
- Competitive price — 57.85%
- Good selection of products — 31.69%
- Convenient location — 29.33%
- Previous experience with store — 26.57%
OpenBrand’s Q1 Major Appliance Trend Insights
The importance of sales floor variety: Price remains the top driver, but “good selection” is gaining as an important differentiator. This suggests assortment planning and inventory visibility are becoming competitive levers, especially as consumers increasingly compare options online before visiting a store. With millennials making up the largest demographic buyer segment, the endless aisle is more important than ever, providing increased options.
Appliance Industry Outlook and Emerging Trends
What’s next for the US Major Appliance market in 2025?
Looking beyond Q1 2025, several factors are shaping the major appliance market:
Tariff impacts add risk: Potential changes to trade policy and tariffs on imported appliances add risk to pricing strategies, supply chains, and promotional planning. Review our breakdown of the latest tariff impacts on Consumer Durables.
Seasonal discounting holds steady: Black Friday and holiday promotions are expected to remain stable in 2025, reinforcing the importance of discount-driven buying events as volume drivers.
Economic sensitivity impacts customer demand: With inflationary pressures moderating but still present, consumers remain price-conscious. Expect promotional activity to stay elevated through 2025.
Housing market connection: Appliance demand continues to track closely with housing activity — a rebound in new home starts or existing home sales could quickly lift volumes.
Energy efficiency demand increases: Regulatory changes and rising energy costs are pushing more brands to highlight efficiency features, which could sway both consideration and purchase decisions.
Digital disruption favors online sales: The steady growth of online sales and BOPIS means retailers with superior digital experiences will likely gain share in the next 12 months.
Get more insight into Major Appliance market trends
The market insights don’t stop here.
For more retail sales data, market share, and insights on the major appliance industry, access our public major appliances MarketSignal quarterly dashboard now – no paid subscription required.
To see insights for other industries or find out how we can help power growth for your business, contact us today.