


2025 U.S. Tire Market Share & Retail Sales Trends | Top Brands & Retailers
The tire market is shifting. Between record-high U.S. tire shipments projected for 2025 and the return of steep tariffs on Chinese-made tires, supply chains are being tested and pricing pressures are mounting. Total U.S. shipments expected to top 340 million units this year and new import tariffs are already driving up prices for many consumer-favorite models.
Both brands and retailers are feeling the impact. In this post, we analyzed the latest U.S. tire market data to uncover who is winning, the factors driving change, the consumers behind the dollars spent, and how the market is evolving across channels.
For a complete breakdown be sure to download our complimentary 2025 Tire Market Infographic.
Source: OpenBrand MindShare, Tires: Total Auto/Truck per Ticket, 4Q ending Q1 2025 | OpenBrand Pricing & Promotions, Total Market Overview – Tires (US), Q2 2025. For the most recent insights or further dives into the data, please contact us.

Tire Market Snapshot & Summary
Before diving into the full results, here’s an overview of what the data reveals. These top-line stats and trends capture where the market stands and where it’s shifting as of early 2025.
| Metric | 2025 Insight | YoY Change |
| Top Brand by Dollar Share | Goodyear | –1.4 ppt ↓ |
| Biggest Brand Gainer (Units) | Continental | +0.3 ppt ↑ |
| Top Retailer by Unit Share | Walmart | +0.8 ppt ↑ |
| Retailer with Highest Close Rate | Discount Tire | 83% (flat) |
| % of Shoppers Who Start Online | 31% | +1 ppt ↑ |
| % Who Actually Buy Online | 13% | +1 ppt ↑ |
| Share of Buyers Who Forget Brand (Units) | 20.5% | – |
| Avg Tire Discount (Q2 2025) | 14% | – |
| Avg Net Price Paid (Q2 2025) | $192 | – |
Tire Brand Performance
Which brands lead in tire market share?
Goodyear remains the leading tire brand in early 2025, holding the top spot by both unit and dollar share. While its unit share declined slightly to 14.6%, it still edges out all competitors for total volume sold. Goodyear also maintains the #1 rank in dollar share at 13.9%, though that figure is down 1.4 percentage points year over year, indicating some erosion in pricing strength or product mix.
Tire Market Share by Brand
| Rank | Brand | Dollar Share (%) |
| 1️⃣ | Goodyear | 13.9% |
| 2️⃣ | Michelin | 11.7% |
| 3️⃣ | Bridgestone | 9.2% |
| 4️⃣ | Firestone | 6.5% |
| 5️⃣ | BF Goodrich | 6.3% |
Other key insights from the top-performing brands:
- Michelin follows in second place by dollar share (11.7%) but lost unit share year over year.
- Bridgestone is climbing, gaining the most dollar share among top brands (+1.3 ppt).
- Firestone has warning signs. While the company holds the third-highest unit share (7.6%), it has dropped notably in dollar share (–1.5 ppt).
- BF Goodrich remains consistent and rounds out the top five, holding steady across both unit and dollar metrics.
While Goodyear retains category leadership they did see significant loss. Meanwhile, Bridgestone saw significant gain, emerging as a key challenger and showing momentum in both shelf presence and promotional volume.
Download the full tires playbook to see the unit share percentage breakdown by tire brand.

Tire Retailer Share: Largest Retailers, Dollar Share, & Other Trends
What are the largest tire retailers in the US?
As of Q1 2025, Walmart is the top tire retailer by unit share, accounting for 15% of units sold, while Discount Tire leads in dollar share at 16%. These two retailers continue to dominate the U.S. tire market — each holding the #1 spot in one of the two most critical performance metrics.
| Rank | Tire Retailer | Unit Share (%) | Dollar Share (%) |
| 1️⃣ | Walmart | 15% | 12% |
| 2️⃣ | Discount Tire | 14% | 16% |
| 3️⃣ | Tire Store | 12% | 10% |
Other notable retailer insights include:
- Walmart saw the largest YoY gain in unit share (+0.8 ppt), while Discount Tire held steady in units but added +0.2 ppt in dollars.
- Walmart also ranks second in dollar share at 11.8%, up significantly from last year (+0.7 ppt).
- Other top players: Costco, Firestone, and Goodyear round out the top five retailers by both unit and dollar share.
- Firestone is declining: The company is the only major retailer to lose dollar share year over year (–0.4 ppt) and also declined in online market share
While Discount Tire retains its title as the highest-dollar tire outlet, Walmart’s unit growth and digital expansion position it as a volume leader in 2025.
Shopper Demographics & Channel Preference
Online vs. in-store sales trends for the U.S. tire market?
Despite the rise of e-commerce across many consumer categories, the tire market remains firmly grounded in brick-and-mortar retail. According to OpenBrand’s 2025 data, in-store remains the dominant channel, though the digital path to purchase continues to expand.
Channel Breakdown: Where Tire Sales Happen
- 77% of tire purchases are made in-store, confirming the category’s offline strength
- 13% of purchases happen online, up 1 percentage point year over year
- The remaining 10% come from other channels, such as catalogs or third-party fulfillment

Pricing Trends & Promotional Activity
What is the average price paid in the U.S. tire market?
In 2025, the industry average price paid (APP) for tires was $192.
In a category as price-sensitive as tires, understanding the relationship between shelf presence, discount depth, and net pricing is critical for both brands and retailers. As of Q2 2025, here’s how the landscape looks:
Average price paid by retailer – tire market insights
- Average net price (APP): $192
- Average discount across the category: 14%
This reflects a market still heavily reliant on promotions to move volume, especially in light of inflation concerns and tariff-induced cost pressures.
Shelf Share and Promo Strategy: Who’s Most Visible?
Michelin was the brand with the highest share of shelf at 16%, signaling broad retailer support and availability. However, shelf space alone doesn’t guarantee growth:
- Michelin and Bridgestone are tied as the top promoted brands, each responsible for 10% of total promotional activity.
Despite heavy promotion and shelf presence, Michelin lost both unit and dollar share, while Bridgestone gained dollar share (+1.3 ppt)
Tire Market: Outlet Draw-Close Rates
Walmart drew in 20.1% of tire shoppers, while Discount Tire drew 17% — the highest draw rates among all major retailers.
But when it comes to closing the deal:
- Discount Tire leads with an 83% close rate, converting nearly all of its in-store traffic.
- Walmart’s close rate trails slightly at 76%, but its high volume still drives massive total sales.
- Fewer, but loyal shoppers: Costco sees fewer shoppers overall (8% draw rate) but retains 65% of them.
- Firestone and Goodyear trail behind in traffic, but drive similar conversion rates.
High draw + high close = high sales volume. That’s why Discount Tire and Walmart continue to outpace competitors, despite their differing pricing and service strategies
Other key US tire market insights
Tire Shopper Demographics
OpenBrand’s census-balanced data paints a clear picture of the average U.S. tire buyer:
- 71% are homeowners
- 59% are married
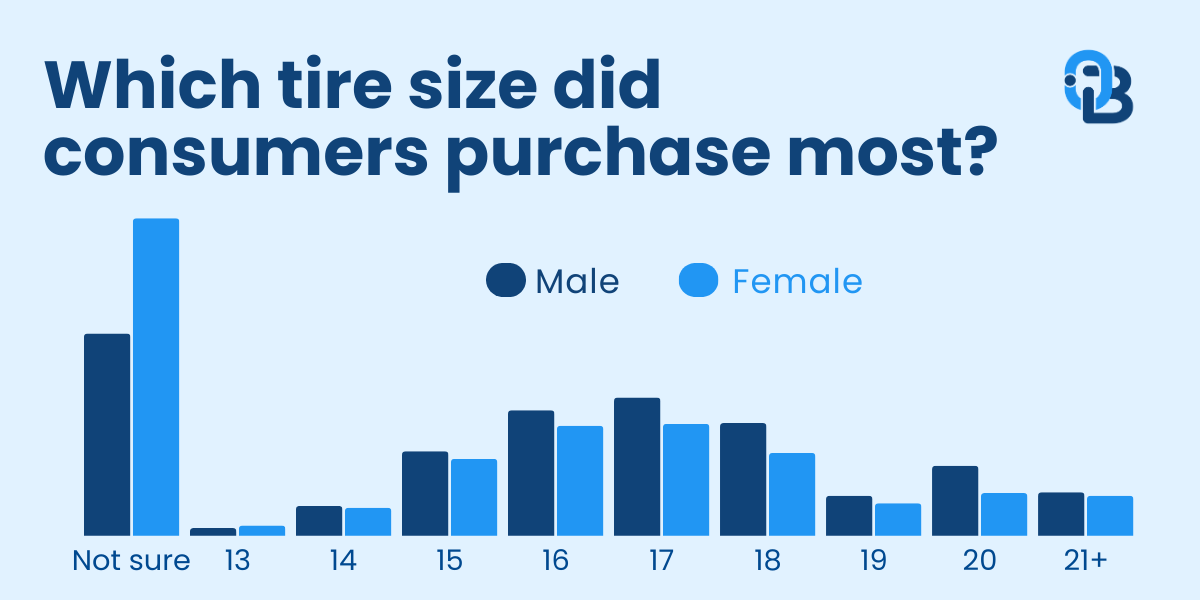
- 63% of buyers are male, while women represent a meaningful 37% share of tire purchasers
- 66% of shoppers are over age 45, with Baby Boomers and Gen X dominating the market
- 24% of buyers are retired, a key insight for marketing targeting based on life stage
OpenBrand’s Tire Takeaway
Don’t overlook female buyers: more than 1 in 3 tire purchases involve women, yet many retail environments still default to male-oriented messaging.
Top Selling Tire Sizes
OpenBrand’s data shows that tire size—not type—is a key factor in buyer behavior. The Playbook identifies the most commonly purchased rim diameters in the U.S. market:
- 17-inch tires are the most purchased size, followed by 16″, 18″, and 15″
- 18”+ tire sizes are gaining share, driven in part by the rise of larger vehicles like SUVs and EVs
- Buyers of 19” and 20”+ tires are more likely to skew younger, with a higher incidence of Gen Z and Millennial buyers selecting larger rims
- Conversely, older consumers over-index in 15” and 16” tire purchases, indicating more traditional vehicle preferences
OpenBrand’s Tire Takeaway
Retailers and brands can use rim diameter data to align inventory with local buyer profiles — especially in regions with age – skewed populations or heavy SUV/EV adoption.
Tire Purchase Drivers
The “why” behind the buy remains consistent year over year, withprice and quality leading the decision.
- 52% of consumers say “competitive price” is the top reason for choosing a brand
- 53% say it’s the top reason for selecting a retailer
- Product quality ranks second among brand drivers (29%)
- Previous ownership and size availability round out the top purchase influences
Pricing may dominate the purchase decision, but tire size availability is a subtle yet powerful lever for conversion—especially in-store where immediacy matters.
Download the Tires Market Playbook
This is just the start. The full 2025 Tire Market Playbook delivers an even richer view into how brands, retailers, and buyers are shaping the road ahead—from market share shifts to shopper behavior, pricing patterns, and promotional strategy.
Download the exclusive playbook below to access the complete dataset and uncover opportunities to grow your share in a competitive, price-sensitive market.

Looking for insights in another category—or ready to explore how OpenBrand can help your business win at retail? Let’s talk. We’ll show you what’s happening in your space, and what to do next.

Home Depot vs. Lowe’s Earnings Call Reviews: Q4 2024 Market Intelligence
Earnings reports provide a valuable snapshot of a retailer’s financial performance, offering insight into revenue, sales trends, and overall business health.
However, they often don’t drill down into specific category drivers that contribute to that performance. That’s where OpenBrand comes in. Our market intelligence data plays a part in understanding how key consumer durables categories help drive financial results, enabling the analysis of share shifts by category, product-level contributing factors, pricing strategies, and more.
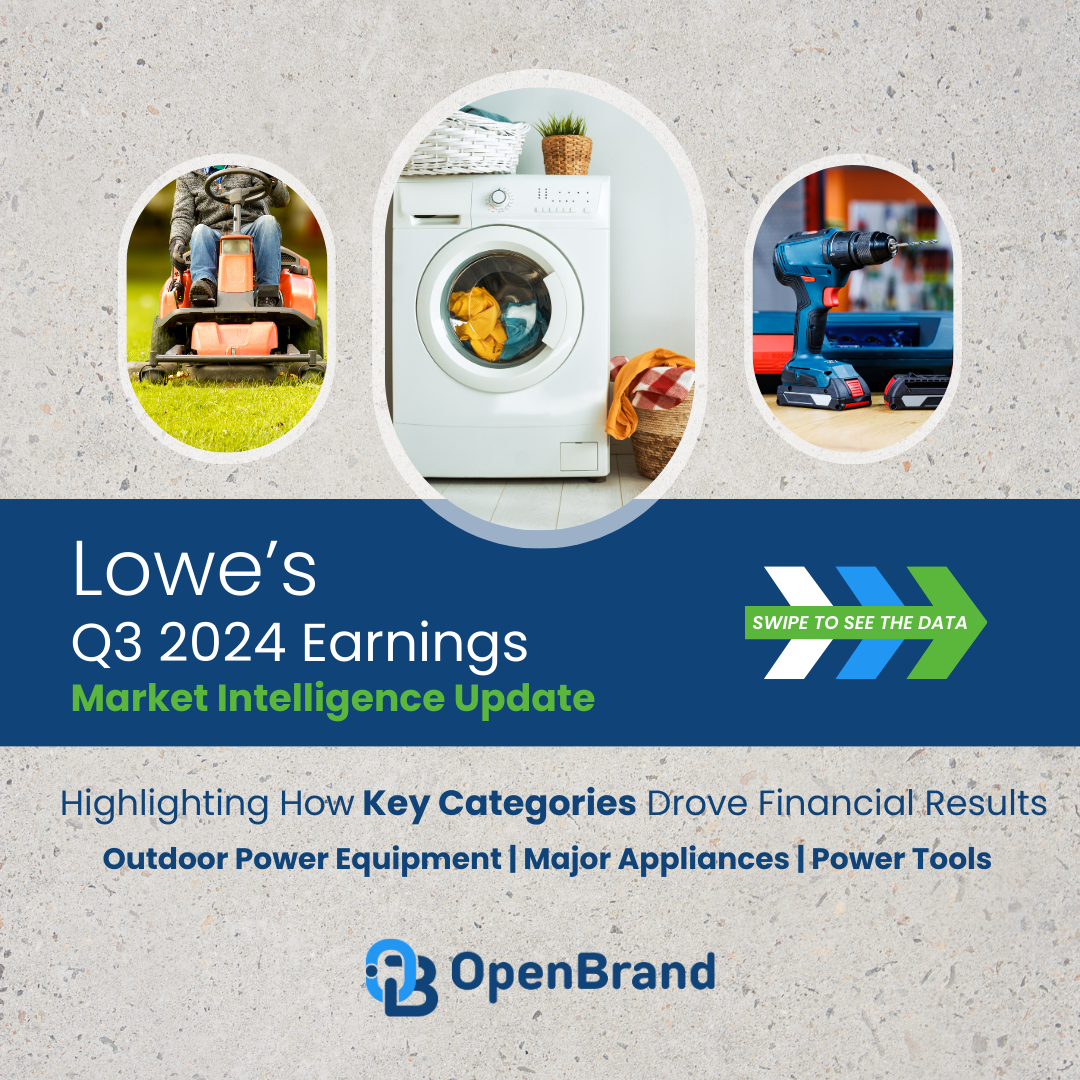
To that end, as a follow-up to Home Depot and Lowe’s Q4 2024 earnings calls, we took a look at market share shifts, competitive trends, and consumer behavior insights across three categories — major appliances, outdoor power equipment, and power tools — providing a deeper look at how the durables industry is driving results for these retailers.
JUMP TO: Home Depot Q4 Market Report
JUMP TO: Lowe’s Q4 Market Report
Key Takeaways: Home Depot vs. Lowe’s Q4 Earnings
- Home Depot reported: $39.7 billion in revenue and a 14.1% sales increase
- Lowe’s reported: $18.6 billion in revenue and a 0.26% sales decrease
- Category trends: Home Depot leads in outdoor power equipment sales and power tool sales. Lowe’s leads in major appliances. Meanwhile, Amazon is becoming a notable player in the power tools space, with only 1 ppt less share than Lowe’s.
Read on for a look at how Home Depot and Lowe’s performed in Q4 2024, and explore the full market intelligence reports available on this page.
Home Depot Earnings Call
Q4 2024 Performance & Home Depot Market Share Trends
SWIPE TO SEE FULL REPORT, CLICK TO EXPAND SLIDES


Home Depot Earnings Call Overview
Home Depot closed out Q4 2024 with strong financial performance, reporting $39.7 billion in revenue and a 14.1% sales increase. Despite a competitive retail landscape, the company saw modest comp growth of 0.8%, driven in part by key durables categories. We’ll dive deeper into select durables category breakdowns below.
- Revenue: $39.7 billion
- Sales Growth: +14.1%
- Comps: +0.8%
- Diluted EPS: $3.02
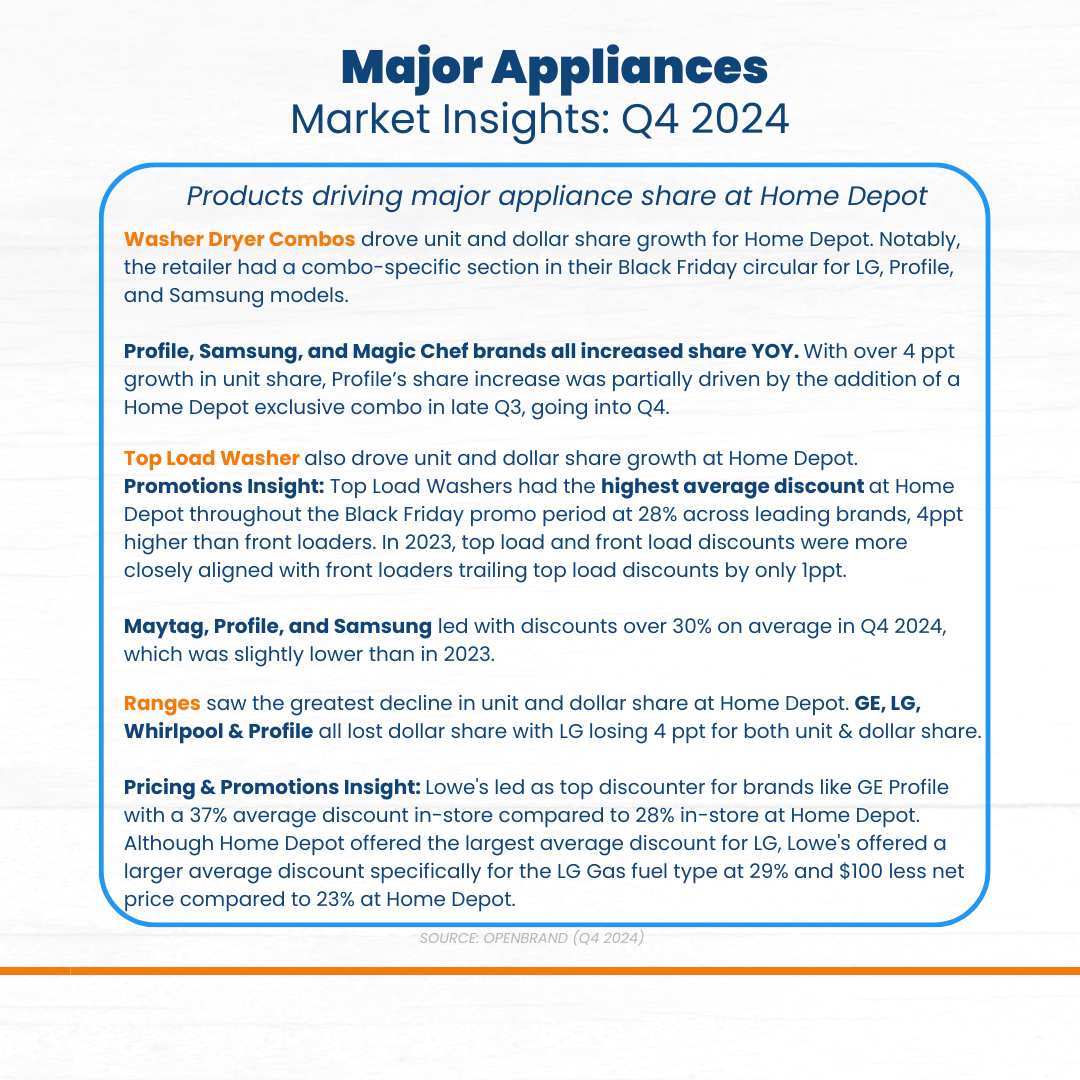
Major Appliance Insights
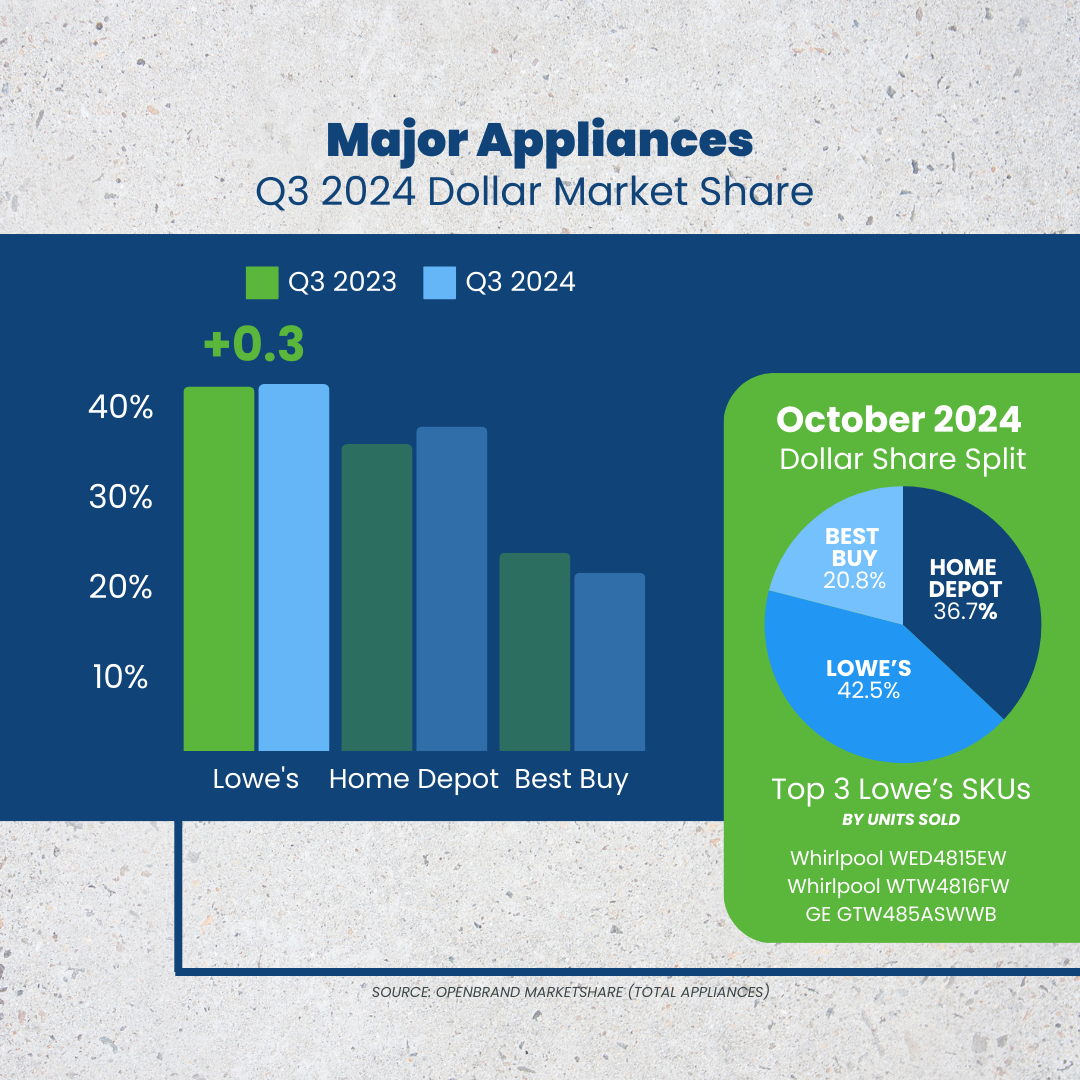
Market Share: Home Depot holds 36.2% of the major appliances market, coming in behind Lowe’s, who leads the major appliance market with 40.2%.
Key Product Categories Driving Growth:
- Top load washers and washer dryer combos drove unit and dollar share growth for Home Depot. Washer dryer combo sales at Home Depot were driven in part by the retailer’s combo-specific section in their Black Friday circular for LG, Profile, and Samsung models. The leading SKU at Home Depot for January 2025 across all appliance categories was Hotpoint’s HTW265ASWWW top load washer.
- Ranges, however, saw the greatest decline in unit and dollar share at Home Depot. This was partially driven by competitive category discounting by Lowe’s, who was the top discounter for brands like GE Profile, with a 37% average discount in-store (compared to Home Depot’s 28%).
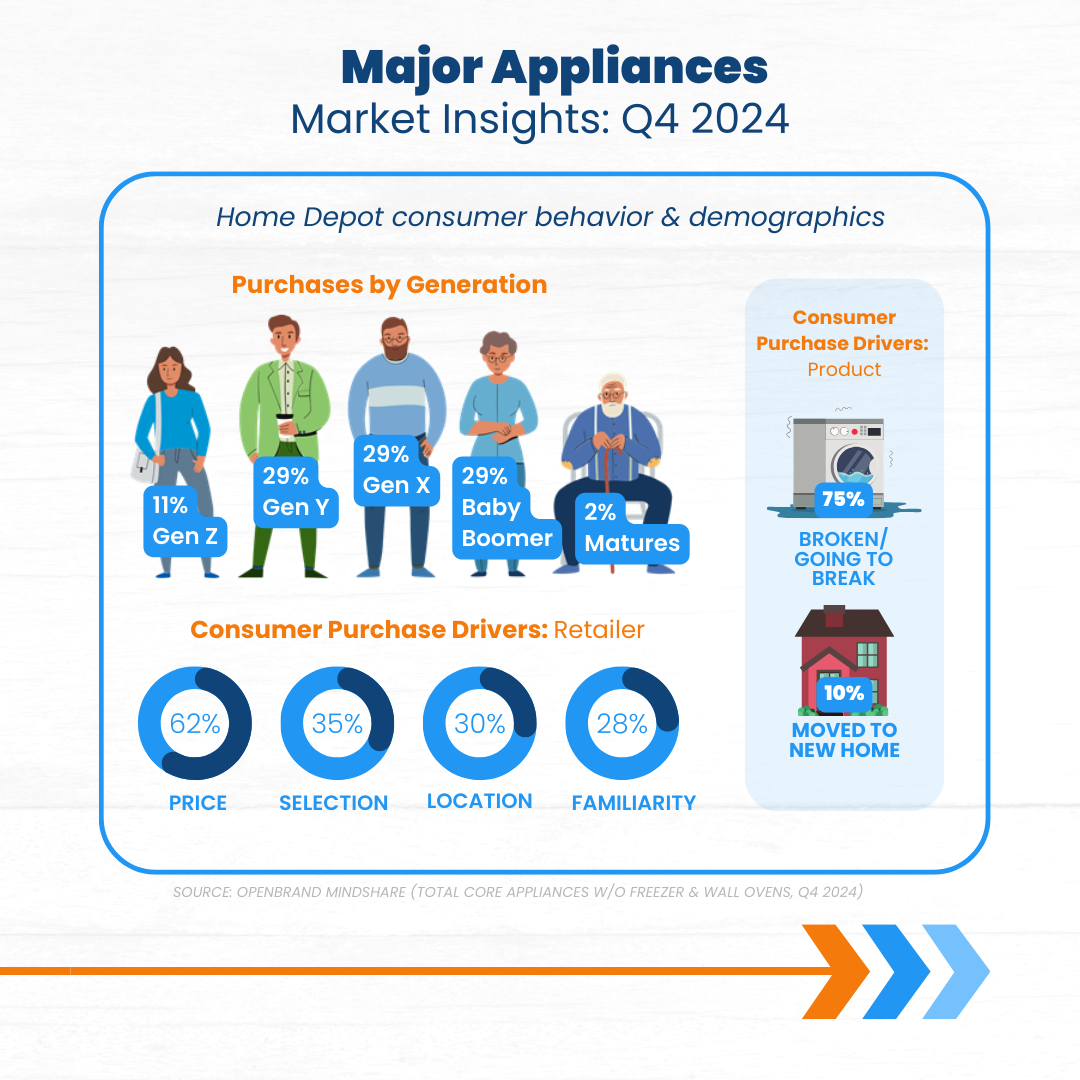
Consumer Insights:
When looking at the makeup of Home Depot consumers in Q4 2024, Gen Y, Gen X, and Baby Boomers made up an equal part (29%) of the major appliance buyer split.
Purchase Drivers: Why did consumers buy major appliances at Home Depot?
- 75% replaced a broken appliance, 10% moved to a new home.
- Price, selection, and location remain key factors in retailer choice.
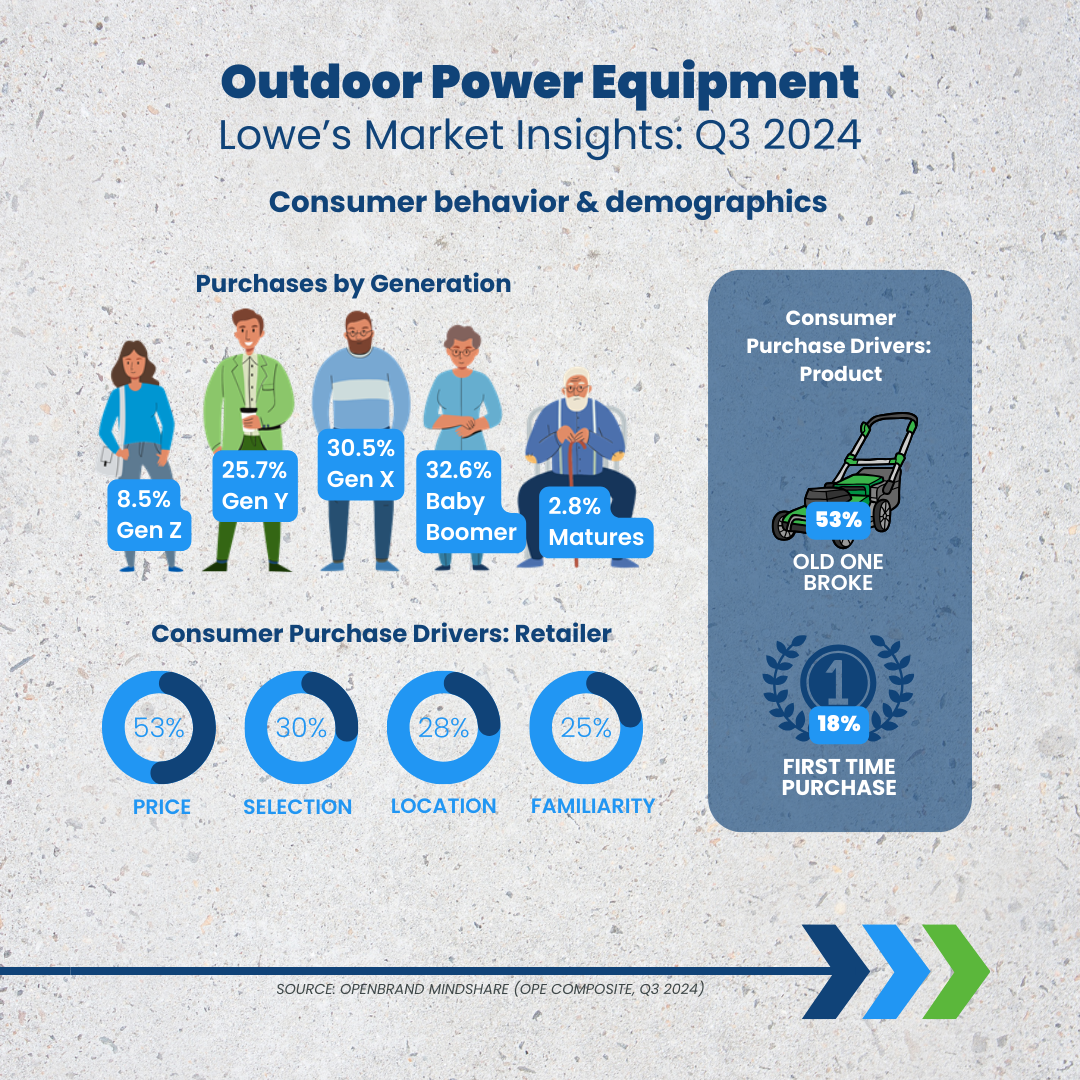
Outdoor Power Equipment (OPE) Insights
Market Share: Home Depot leads with 46.2%, coming in above all other retailers, including Lowe’s who won 37.3% dollar share. Notably, Walmart and Amazon are making a name for themselves in this space at 7.9% and 7.7% respectively.
Key Product Categories Driving Growth:
- Pressure washers was the only OPE category to see YOY growth at Home Depot in both unit and dollar share.
- Ryobi, exclusive to Home Depot, led unit and dollar share for pressure washers. All top 10 pressure washer SKUs in Q4 2024 were from the Ryobi brand. Additionally, the top SKU at Home Depot in January 2025 across all OPE products was the Ryobi RY120350 pressure washer.
Consumer Insights:
When looking at the makeup of Home Depot OPE consumers in Q4 2024, Gen Y and Gen X took the lead, both making up 31% of OPE buyers.
Purchase Drivers: Why did consumers buy OPE products at Home Depot?
- 36% replaced a broken unit, 21% were first-time buyers.
- Key retailer drivers: price, selection, familiarity, and location.
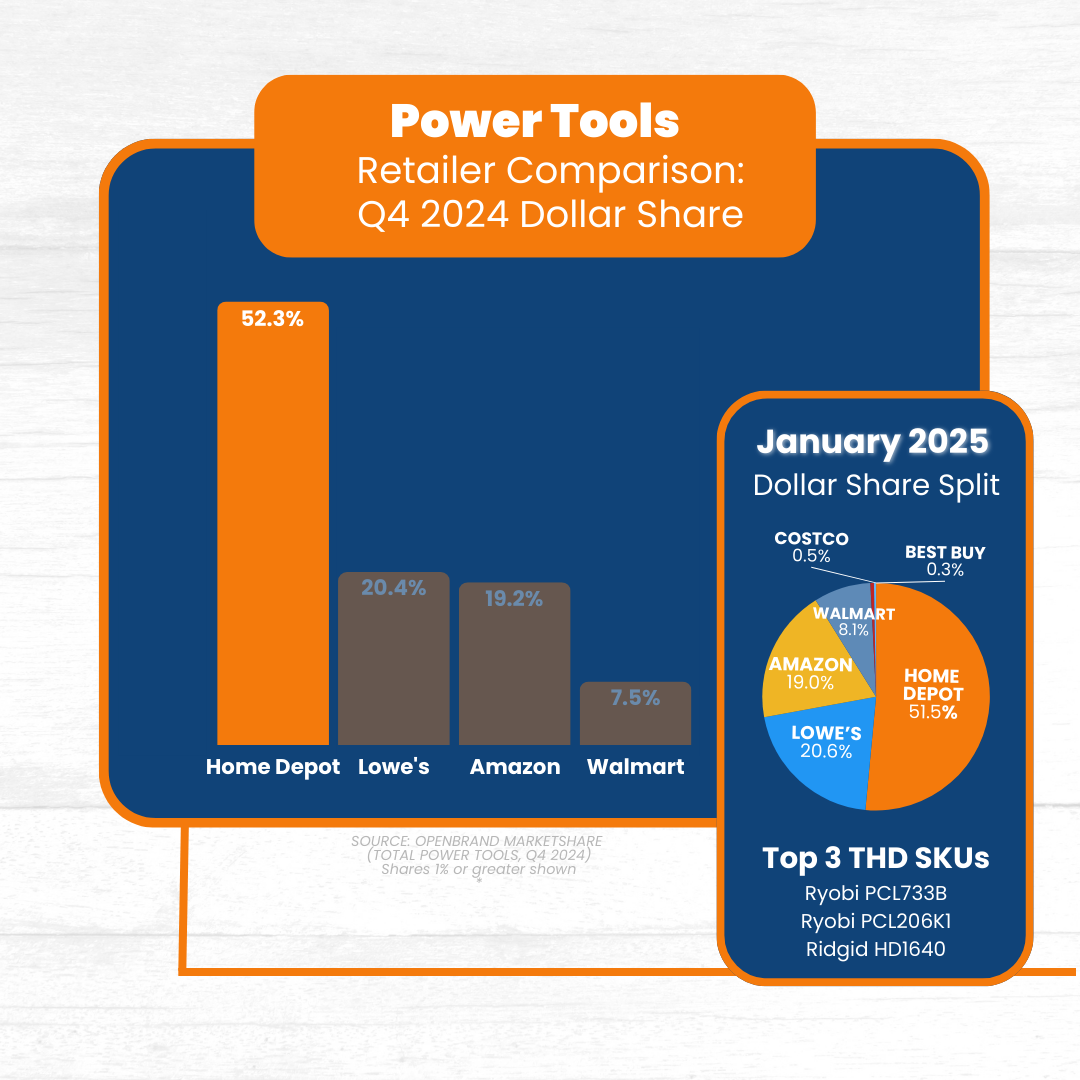
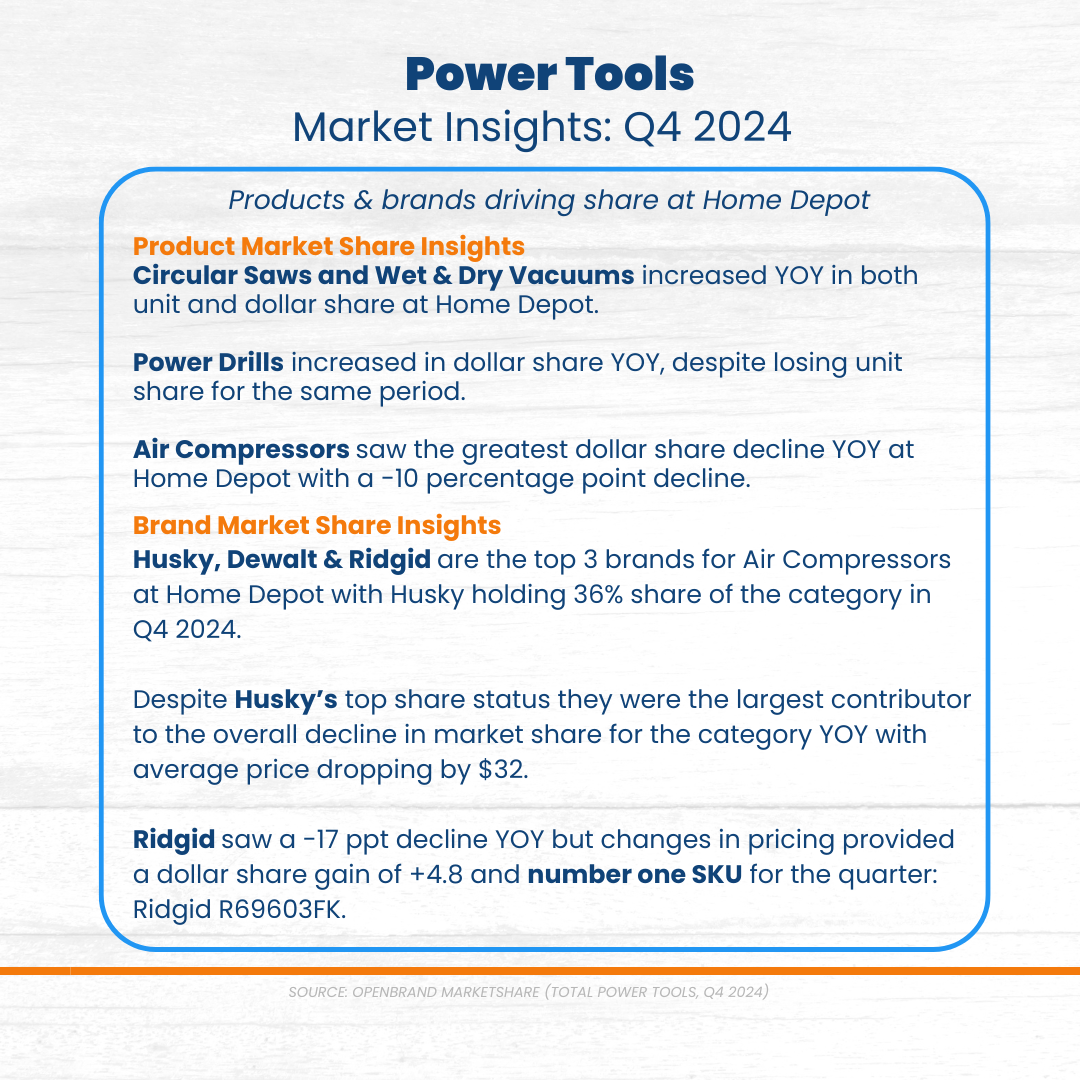
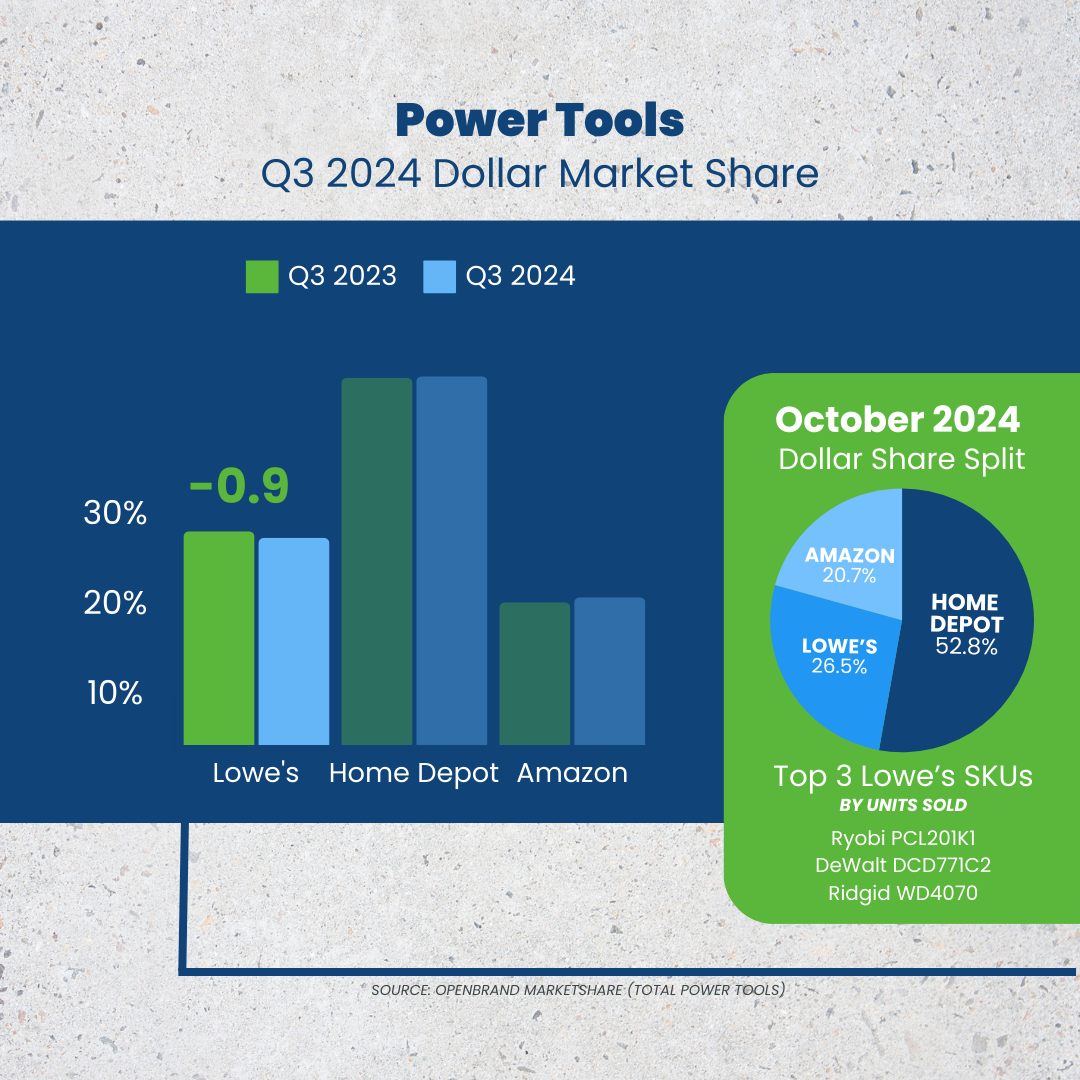
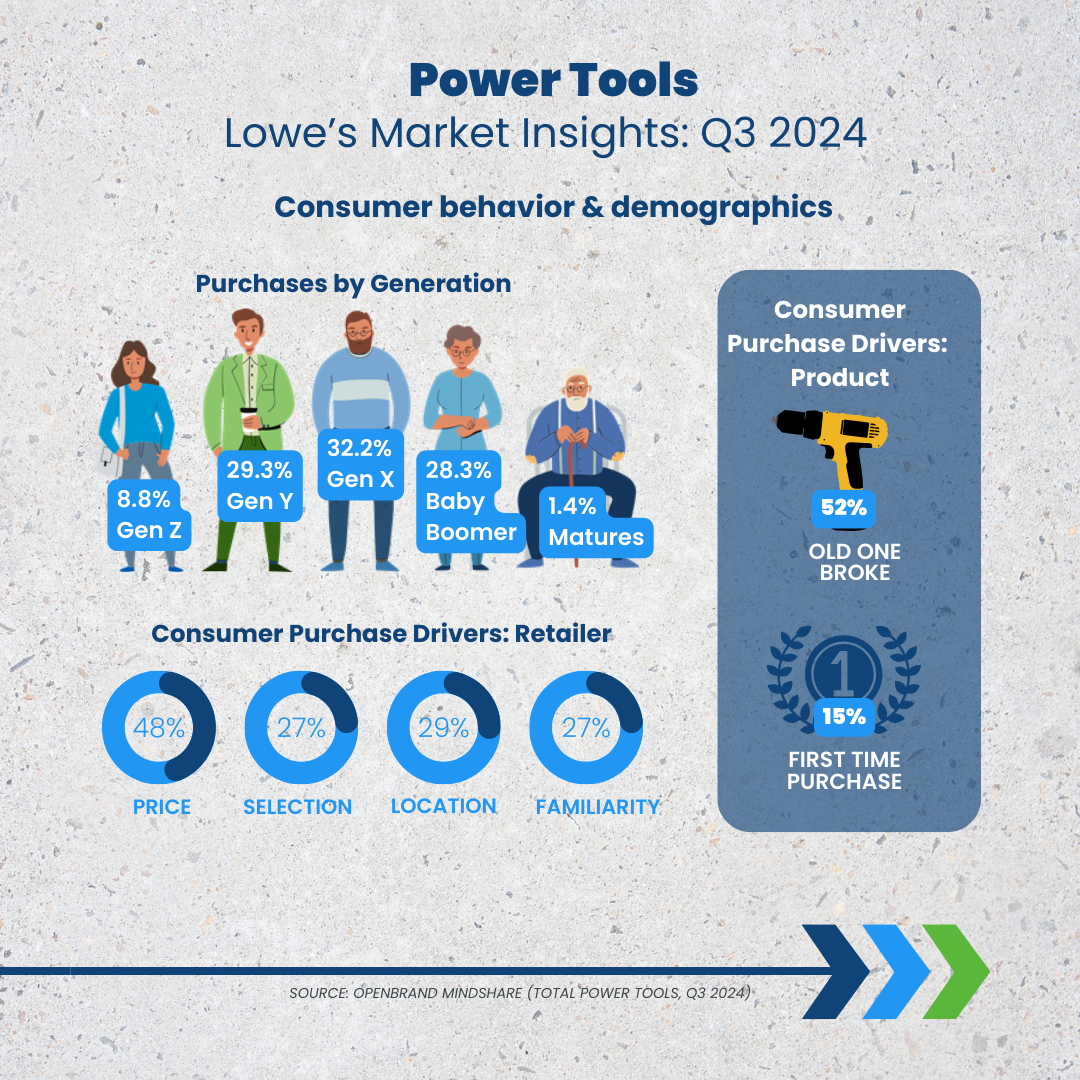
Power Tools Insights
Market Share: Home Depot dominates with 52.3% (Lowe’s: 20.4%, Amazon: 19.2%, Walmart: 7.5%).
Key Product Categories Driving Growth:
- Circular saws and wet & dry vacuums increased YOY in both unit and dollar share.
- Power drills saw a dollar share increase despite losing unit share.
- Air compressors had the largest decline (-10 ppt), driven partially by Husky’s price drop (-$32 on average). Husky holds 36% of all air compressor share at Home Depot.
- Ryobi once again claimed the top SKU across all Home Depot power tools, with their PCL733B wet & dry vac.
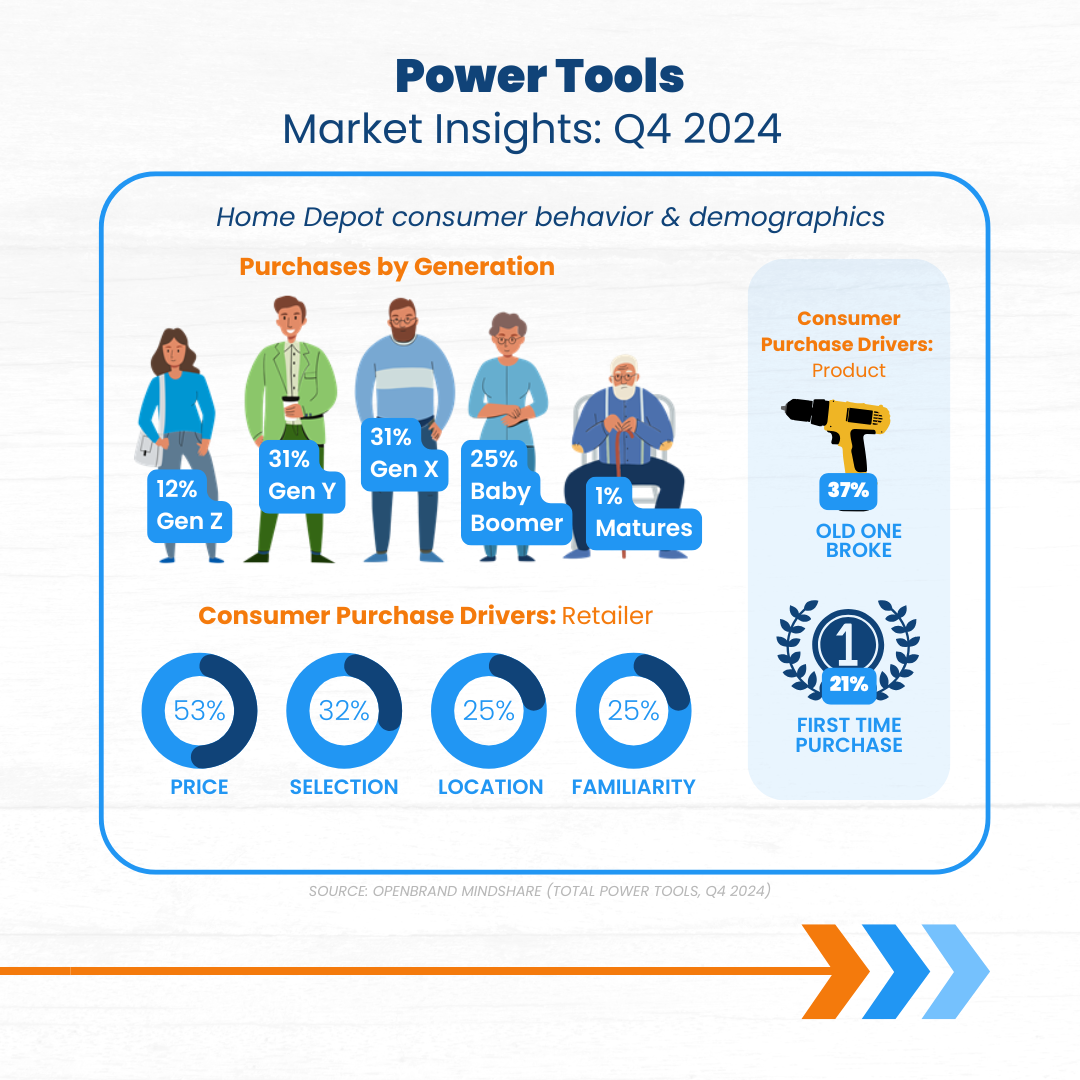
Consumer Insights: When looking at the makeup of Home Depot power tools consumers in Q4 2024 same as OPE, Gen Y and Gen X took the lead, both making up 31% of power tools buyers.
Purchase Drivers: Why did consumers buy power tools at Home Depot?
- 37% replaced a broken tool, 21% were first-time buyers.
- Price, selection, location, and familiarity continue to drive retailer choice.
Lowe's Earnings Call
Q4 2024 Performance & Lowe's Market Share Trends
SWIPE TO SEE FULL REPORT, CLICK TO EXPAND SLIDES


Lowe’s Earnings Call Overview
Lowe’s closed out Q4 2024 reporting $18.6 billion in revenue and a decrease of 0.26% in sales. Despite this decrease, the retailer did see a comp growth of 0.2%.
- Revenue: $18.6 billion
- Sales Growth: -0.26%
- Comps: +0.2%
- Diluted EPS: $1.99
We break down how select durables categories factor into Lowe’s Q4 2024 performance below – including Lowe’s leadership in the major appliance category.
Major Appliance Insights
Market Share: Lowe’s leads the major appliances market with 40.2% share, staying ahead of Home Depot, which holds 36.2%.
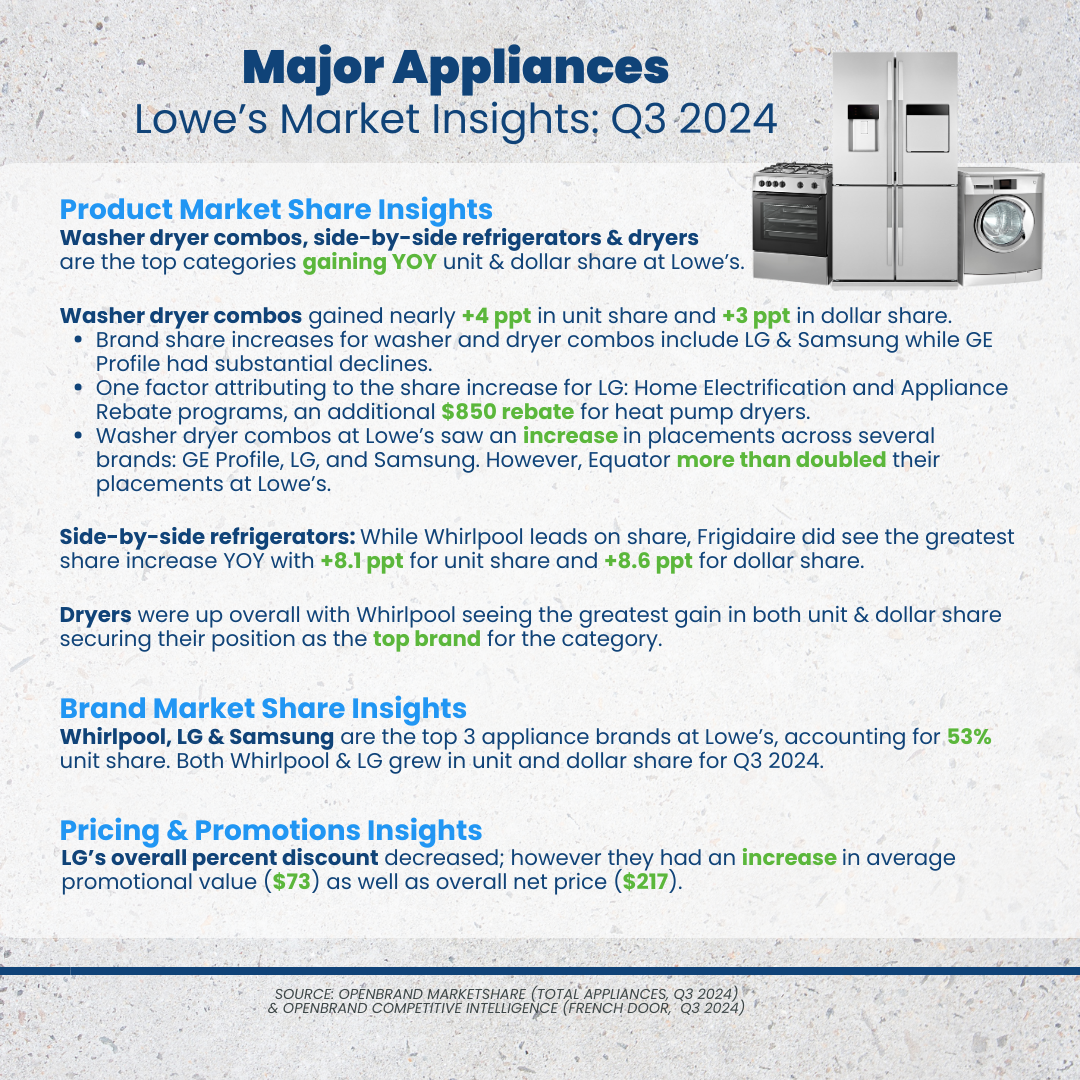
Key Product Categories Driving Share
- Front Load Unitized: Lowe’s saw increases in both units and dollars for FL Unitized by 3.7ppt for each. Lowe’s share growth likely stems from its expanding portfolio, having exclusively offered LG models in Q4 2023.
- Top Load Washers saw a decrease in unit and dollar share. Maytag led overall share and was the top SKU for Top Load Washers.
- Dryers decreased in both unit and dollar share at Lowe’s. Lowe’s saw a notable YoY increase in average price for its dryer assortment in Q4 2024, increasing by around $30 on average.
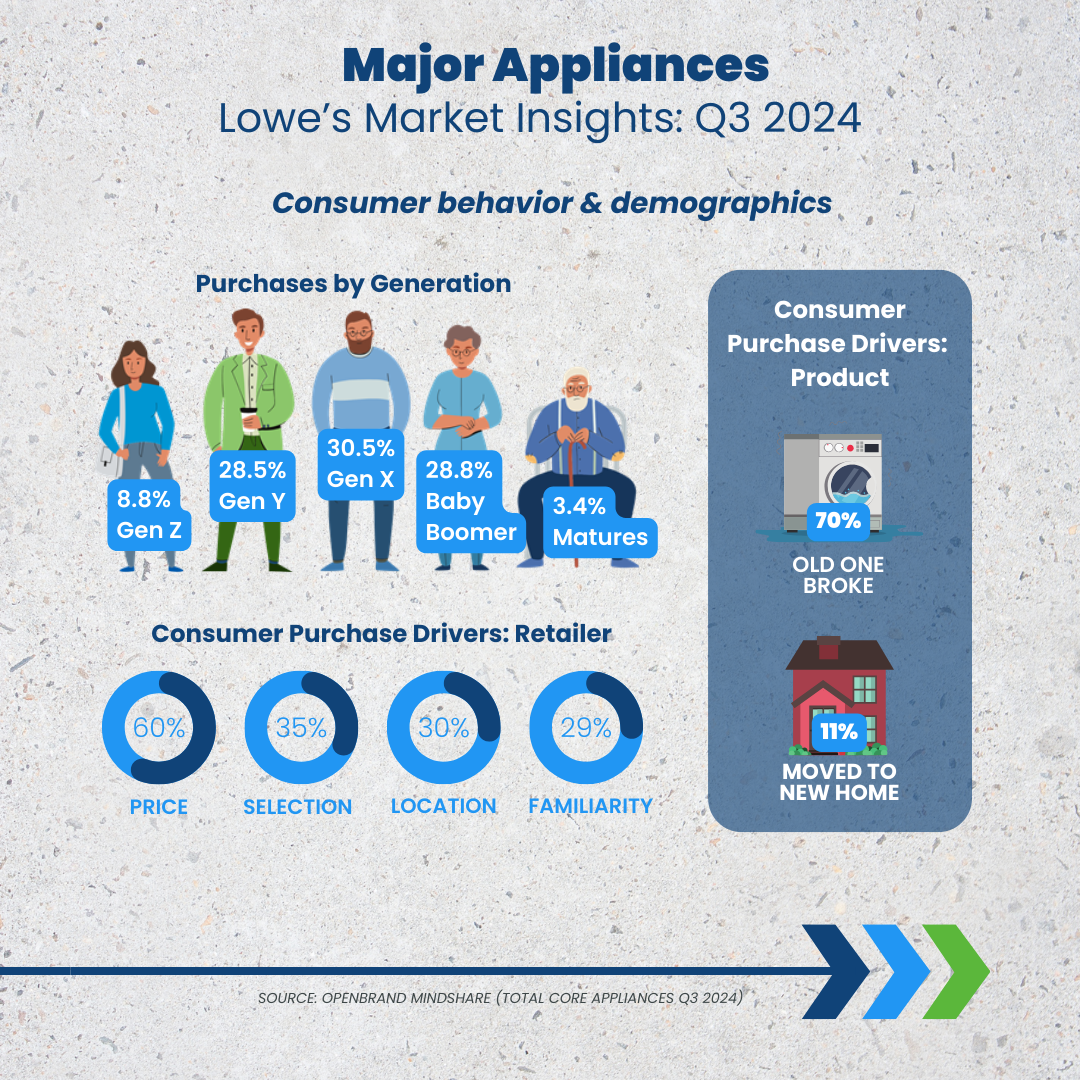
Consumer Insights: When looking at the makeup of Lowe’s major appliance consumers in Q4 2024, Gen X led the split at 32%, with Gen Y and Baby Boomers coming in at 29%. Notably, more Gen X make their purchases at Lowe’s than Home Depot.
Purchase Drivers: Why did consumers buy major appliances at Lowe’s?
- 68% replaced a broken appliance, 11% moved to a new home.
- Price, selection, and location remain key factors in retailer choice.
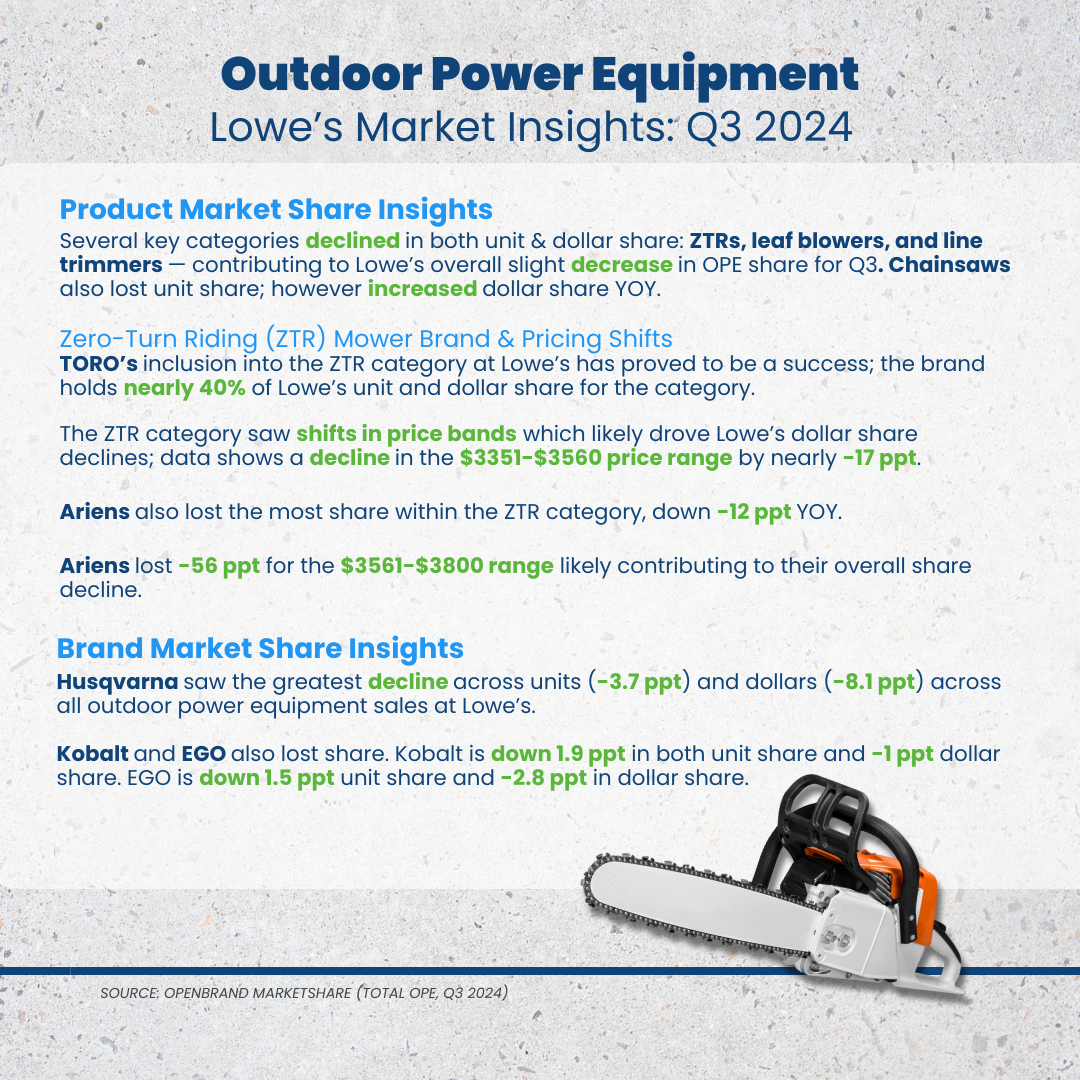
Outdoor Power Equipment (OPE) Insights
Market share: Lowe’s experienced a notable decline in OPE market share in Q4 2024, driven in part by losses in chainsaws and snow removal equipment. Chainsaw unit share dropped 14.5ppts YoY to 30.6%, with dollar share falling 6ppts to 30.5%. Snow removal unit share also fell significantly, declining to 23.5% from 36% YoY.
Key Product Categories Driving Share:
- Chainsaws: EGO gained 7.7ppts in unit share (17% vs. 9.3% YoY), securing the #1 SKU with its 56V 16-inch battery model ($249).
- Snow Removal: EGO increased to 49.5% unit share, while Toro rose to 15.4%. Ariens and Craftsman lost 8.2ppts and 10.3ppts, respectively.
- Gas vs. Electric: Battery-powered chainsaws now 71% of unit share (up from 57% YoY), while corded models dropped to 7% (from 26%).
Consumer Insights: When looking at the makeup of Lowe’s OPE consumers in Q4 2024, Gen X also led the split for this category at 33.9%.
Power Tools Insights
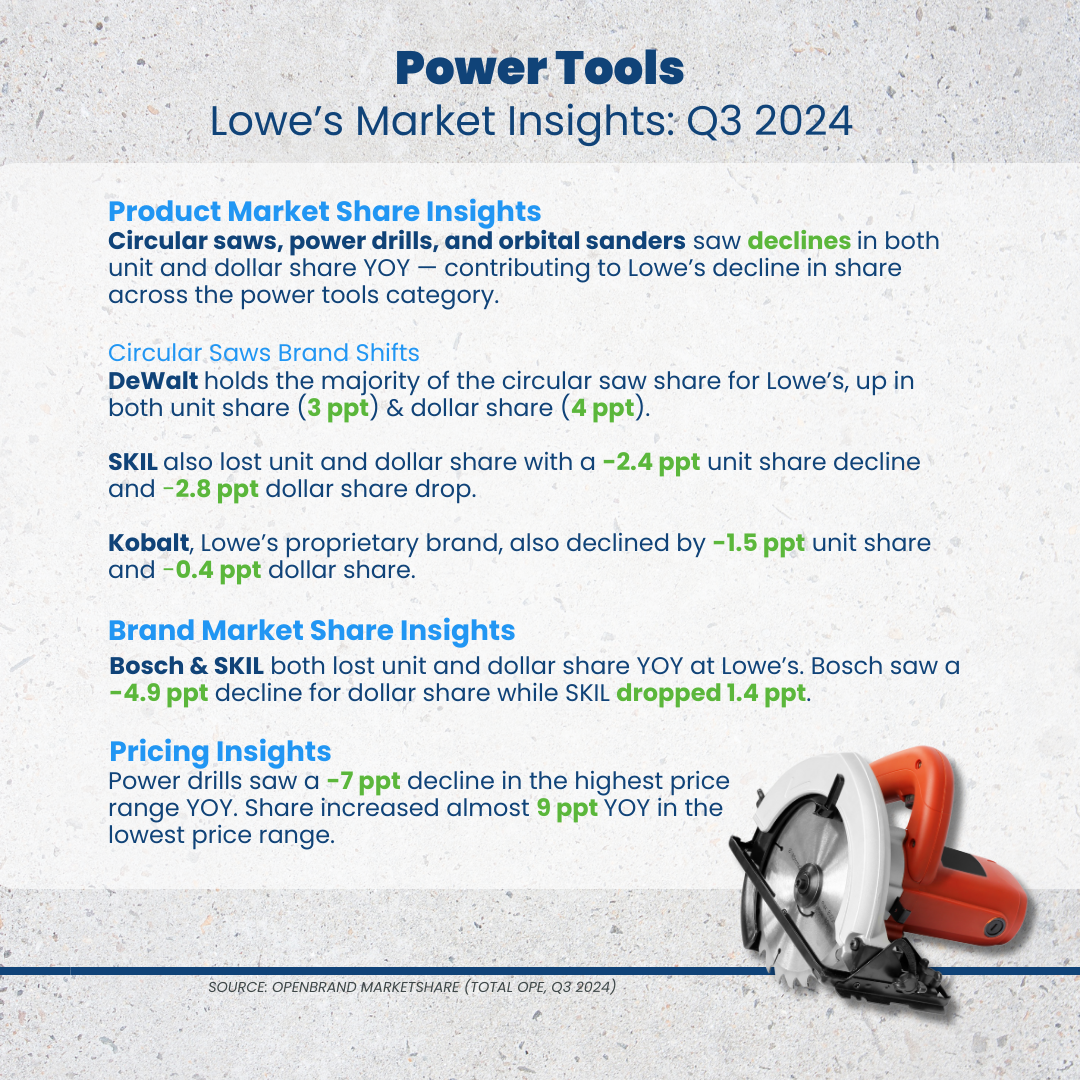
Market Share: Lowe’s comes in as the second leading retailer for power tools dollar share in Q4 2024 at 20.4%. Lowe’s saw an overall decrease in the power tools category, with Orbital Sanders (-23ppts dollar share) and Rotary Tools (-13ppts unit & dollar share) seeing the largest declines.
Key Product Categories Driving Share
- Orbital Sanders: Bosch & Craftsman lost share in both units and dollars. Dewalt gained 11ppts in dollar share, despite a drop in units. Dewalt’s average price for orbital sanders dropped 24% YoY ($145 to $111), signaling a pricing shift.
- Rotary Tools: Dremel remains the unit leader but lost 24ppts in unit share, 28ppts in dollar share. Dewalt leads in dollar share and holds the top selling SKU across the category.
Consumer Insights: When looking at the makeup of Lowe’s power tools consumers in Q4 2024, Gen X once again led the split for this category at 33% — 3ppt higher than the next generation (Millennials at 30%).
Home Depot vs. Lowe’s: Competitive Landscape
Lowe’s and Home Depot continue to battle for dominance in key durables categories, with their Q4 2024 performance highlighting different strengths and vulnerabilities.
Lowe’s maintains its leadership in major appliances, leveraging aggressive discounting to maintain its edge. Home Depot, though trailing in share, drove volume through strategic placements like its Black Friday washer-dryer combo push.
In outdoor power equipment, Home Depot remains dominant, while Lowe’s struggled with sharp declines in chainsaws and snow removal. The rise of battery-powered tools benefited Lowe’s, but not enough to offset broader losses. Home Depot’s exclusive Ryobi lineup kept it ahead, while Lowe’s saw some gains with Toro in snow removal but lost share in key brands like Craftsman and Ariens.
Power tools remain a stronghold for Home Depot, as Lowe’s faces losses across products like orbital sanders and rotary tools. Dewalt’s pricing adjustments at Lowe’s helped boost dollar share, but Home Depot’s exclusive brands and stronger premium positioning kept it in control. Notably, both retailers need to pay attention to Amazon, who holds 19.2% dollar share — putting them only 1.2% behind Lowe’s in retailer dollar share split.
The Q4 results reinforce the distinct strategies of each retailer. Lowe’s continues to rely on pricing and promotions to attract customers, sustaining its appliance leadership but losing ground elsewhere. Home Depot’s focus on exclusive brands and strategic product placements reinforces its advantage in outdoor power equipment and power tools. As battery-powered equipment grows and pricing strategies shift, both retailers will need to refine their competitive playbook.
Get Unmatched Market Intelligence for YOUR Business
Lowe’s and Home Depot’s earnings calls offer a big-picture view of their performance, but the real story lies in how specific product categories, pricing strategies, and consumer behaviors drive those results. Our market intelligence goes beyond the numbers to provide actionable market measurement and competitive intelligence insights that help businesses win.
Want to see the insights available for your brand?
Have a specific data request you’re interested in diving into with our team?
Connect with our team below

US Fitness Equipment: Brand & Retailer Market Share & Trends
The Fitness Equipment market is poised for growth with brands like Tesla gearing up to enter the field, and consumer preferences shifting toward working out at home instead of at the gym.
With that in mind, let’s look at the current state of the Fitness Equipment market, including who’s buying, where they’re buying it, and what drives their purchase decisions. Download our free US Fitness Equipment market infographic to see all the insights as of September 2023 or read on to discover current trends in the industry, including the top brands, retailers, and more.
Source: All data in this article was pulled from the OpenBrand MindShare platform using the rolling 4Q ending Q3 2023, Exercise Total category. The OpenBrand Exercise Equipment - Total category is an aggregate of several products. For 4Q ending September 2023 this category consists of the following products: Stationary Bike, Weight Bench, Multi-purpose Gym, Rowing machine, Elliptical Machine, Stair Climber/Stepper, Treadmill, and Other Exercise Equipment. For the most recent insights or further dives into the data, please contact us.

Who are the top retailers by share in the US Fitness Equipment market?
As of September 2023, the top retailer for US Fitness Equipment was Amazon in both unit and dollar share.
In unit share, Amazon saw an increase of 5 percentage points from the same time prior year. The major online retailer continues to lead all other outlets with a share of 34%.
Dick’s enjoyed the next highest retailer unit share (6.8%). Peloton saw the largest unit share decline year-over-year (YOY), with a drop of nearly 2 points, putting them just behind Dick’s at 6.6% share.
Amazon took the lead over Peloton as industry dollar share leader, gaining 6 percentage points YOY for a total of 23.5%. In contrast, Peloton lost a dramatic 6 percentage points compared to prior year, bringing their dollar share down to 18.3%.
Outlet Draw/Close Rates
Amazon and Walmart lead all other outlets for highest draw rate, attracting the most consumers shopping for Fitness Equipment. The draw rate for Amazon is up significantly, reaching 41% in September 2023. Walmart’s draw rate was mostly flat compared to the prior year, holding steady at 19%.
As for close rates, Peloton and Amazon saw the greatest success. Though drawing in only 7% of consumers, Peloton continues with the highest outlet close rate of 89%. Amazon, leader in market share for Fitness Equipment, saw its close rate significantly increase from last year, reaching 83%.
Notably, with increases in both Amazon’s draw and close rates for Fitness Equipment, this means the online retailer is drawing in more shoppers looking to buy Fitness Equipment and closing more sales with them.
Who is winning the most Fitness Equipment manufacturer market share?
As of September 2023, the most popular Fitness Equipment manufacturer continued to be Peloton, in both unit (11%) and dollar (25%) share.
However, as seen with outlet share, Peloton saw decreases in brand share. In dollars sold, Peloton saw the largest decrease in share across all Fitness Equipment brands, with a loss of 4 points YOY; in dollar share, Peloton lost 1 point.
NordicTrack holds the second place in unit and dollar share, with 5% unit share and 10% dollar share (though decreasing 1 percentage point YOY in both). Bowflex came in as the third top brand in share, with just under 5% unit share and 6% dollar share.
Brand Consideration Rates
Peloton continues to lead as the most considered brand with 15% brand consideration rate. However, once more, the brand saw a decrease YOY.
While Peloton was down in brand consideration, the brand’s close rate did increase significantly, reaching 73%. This shows that while less people are considering Peloton when shopping for Fitness Equipment, those that do consider the brand are more likely to buy than consumers in past years.
Like our list of brand share leaders, the next most considered brands were NordicTrack (8%) and Bowflex (7%).
[Download the infographic to see the share percentage breakdown by all top Fitness Equipment brands.]
How much do consumers spend on Fitness Equipment?
As of September 2023, the industry average price paid for Fitness Equipment was $536, which is down from $606 YOY.
The average amount spent at specific retailers varies. Here are a few examples of the variance consumers can see when shopping for Fitness Equipment.
Average Price Paid for Fitness Equipment by Retailer
-
- Consumers buying Fitness Equipment at Peloton have an average price paid of $1,525.
-
- This average price paid is nearly three times higher than the industry average but is also down from last year’s $1,774 average price.
- Given the brand’s dramatic drop in dollar share, it is no surprise that Peloton’s average price saw a consistent decline over the past three years.
-
- Buyers shopping at top outlets Amazon and Walmart saw average Fitness Equipment prices significantly lower than the $536 industry average, at $364 and $296 respectively.
- Consumers buying Fitness Equipment at Peloton have an average price paid of $1,525.
How are online vs. in-store sales trending for the Fitness Equipment market?
With Amazon as the market share leader for Fitness Equipment purchases, it’s no surprise that Fitness Equipment is most often purchased online — with 66% of purchases made using an online sales channel. Only 26% of purchases are made in a retail store.
Here are some additional trends that TraQline uncovered:
-
- Historically, consumers pay a slightly higher average price when purchasing online.
-
- As of September 2023, consumers purchasing Fitness Equipment online paid an average price of $567.
- While this is down compared to the prior year, it was still higher than the current industry average of $536.
- Furthermore, the online average price paid for Fitness Equipment is higher than the average price paid by consumers making in-store purchases, which was only $483.
-
- Regardless of purchase channel (online or retail store), 85% of consumers shopped online before making a purchase.
- Additionally[AJ1] [SH2] , 71% of online purchasers shopped at only one store, while 65% of retail store purchasers shopped at only one store.
- Historically, consumers pay a slightly higher average price when purchasing online.
Other key US Fitness Equipment market insights
Which demographics are buying US Fitness Equipment?
Let’s look at the primary demographics for Fitness Equipment purchases using the census-balanced survey data from TraQline Durable IQTM.
-
- 69% of Fitness Equipment purchasers are homeowners; with purchases by homeowners significantly down by 1.4 points from this time last year
- 28% of purchasers are renters
- 53% of purchasers are married
- 45% of purchases are made with males only involved in the purchase decision
- 34% of purchases are made with females only involved in the purchase decision
- 36% of Fitness Equipment purchasers are Millennials and 28% are Gen X generations
-
- However, purchases by Gen Z (17%) continue an upward trend, as seen in the past few years, gaining ground on Millennials and Gen X
- Gen Z purchases of Fitness Equipment increased significantly by 3.8 points compared to prior year
-
Fitness Equipment Purchase Drivers
As seen in previous years, “first time purchase” was the most mentioned reason for Fitness Equipment purchases as of September 2023.
The top three reasons cited by consumers for purchasing Fitness Equipment were:
-
- “First time purchase” (46%)
- “Replacement of broken” (13%)
- “Gift for someone” (10%)
The most mentioned reasons for purchasing Fitness Equipment at a specific retailer were:
-
- “Competitive price” (59%)
- “Good selection of products” (33%)
- “Previous experience with store” (16%)
- “Convenient location” (14%)
The most mentioned reasons for purchasing a specific brand of Fitness Equipment were:
-
- “Competitive price” (46%)
- “Features desired” (39%)
- “Quality product” (31%)
- “Good brand name” (20%)
Outlets & Brands Shopped
Across all purchase channels (online, retail store, and others), 70% shopped at only one store and 77% shopped for only one brand.
Get more insight into Fitness Equipment trends and market share
The market insights don’t stop here. For more retail sales data, market share, and insights on the Fitness Equipment market, download the OpenBrand-exclusive infographic below. To see insights for other industries or find out how we can help power growth for your business, contact us today.

Home Improvement Market: 2024 Mid-Year Review
OpenBrand conducted a data analysis of the 2024 Home Improvement market, highlighting insights including:
- Brand & retailer share winners by industry
- Online vs. in-store purchase shifts
- Consumer demographic insights
- Average price paid trends
- …and more!
Download now to discover the state of the Home Improvement industry
Summary
Our 2024 mid-year review delivers a look at the state of the home improvement (HI) industry at the mid-year mark. The goal of this report is to provide a high-level snapshot of the state of the Home Improvement (HI) industry as we approach the end of 2024. To access all the insights and data available for the Home Improvement industry contact our team at OpenBrand.
Source
Our primary data source for this report is our quarterly consumer tracking survey (MindShare, previously Durable IQ), which measures market share across 100% of the market through consumer awareness. We also tap into SKU-level market share insights (MarketShare, previously Hybrid POS) as well as our pricing, promotions, product, and placement data.
For the purposes of this report, we reviewed the Home Improvement market through the lens of an aggregate of all the Consumer Durables categories relevant to Home Improvement businesses. For more details on what categories comprise the Home Improvement product aggregate, see pages 6 and 31 of the report.

2023 & 2024 Paint Market Share Insights: Top Brands & Retailers
The Paint market is experiencing a variety of breakthroughs and shifts in areas including improved safety, sustainability, and more. With these changes in mind, let's look into Paint market data over the past year to see how the industry is shifting too — including top brands and retailers, consumer preferences, and key consumer purchase drivers.
Download the full Paint market infographic below to get even more insights.
Source: All data in this article was pulled from the OpenBrand MindShare platform using the rolling 4Q ending Q1 2024, Total Paint - Per Ticket category. The Total Paint product category is an aggregate of coating types: Interior paint (58%), Exterior paint (28%), and Primer (14%). The summary that follows is based on data from “per ticket” sales, meaning multiple products/brands could be in a single transaction. For the most recent insights or further dives into the data, please contact us.

Which retailers have the highest market share for Paint?
As of March 2024, Home Depot is the leading retailer for Paint purchases.
Let’s look at how market share splits out among the top three Paint retailers by units sold and dollar share.
Top Paint Retailers by Unit Share
- Home Depot — 36% unit share
- Lowe’s — 23% unit share
- Sherman Williams — 13% unit share
Winning 36% of the total Paint market, Home Depot leads all other outlets based on units sold, up 0.2 points from the same time last year.

Lowe’s has the next highest unit share at 23%, but is down significantly 0.8 points year-over-year (YOY).
In third place is Sherwin Williams, winning 13% of the market and gaining 0.5 points YOY — continuing an upward trend seen over the last three years. Sherwin Williams outlets are the only major retailer with a significant increase compared to prior year.
Top Paint Retailers by Dollar Share
- Home Depot — 31% dollar share
- Sherman Williams — 25% dollar share
- Lowe’s — 20% dollar share
Home Depot also leads all other outlets for dollar share, owning 31% of the Paint market. However, the retailer is down 0.5 points compared to prior year.
Sherwin Williams comes in second for dollar share with 25%, once again continuing an upward trend, as seen in unit share, with a 1.2 point rise from prior year.
Lowe’s holds on to third place with 20% dollar share, which is down 0.5 points from this time last year.
Retailer Draw Rates
Draw rate looks at the number of consumers a retailer brought in, regardless of where the consumer ultimately purchased their product.
In the Paint market, Home Depot has the highest draw rate across all outlets with 46%. Lowe’s had the second highest draw rate at 34%, with a decline YOY of 0.8 percentage points. In third place, Sherwin Williams saw a draw rate of 15%, gaining 0.3 percentage points YOY.
For more market share data by retailer, download our Total Paint infographic.
What are the top Paint brands?
As of March 2024, the leading Paint brands were Behr and Sherwin Williams. See share breakdowns by units sold and dollars earned below.
Top Paint Brands by Unit Share
- Behr — 30% unit share
- Sherwin Williams — 19% unit share
- Valspar — 8% unit share
- Glidden — 6% unit share
- Benjamin Moore — 5% unit share
The most popular brand based on unit share was Behr, winning 30% of the market. Behr is up 0.8 points from this time last year.
Sherwin Williams, the second most popular Paint brand, continues an upward trend seen over the past three years, gaining 0.7 percentage points since 2023.
Valspar holds on to third place, however the brand is down significantly YOY with a 1.3 point loss.
Top Paint Brands by Dollar Share
- Sherwin Williams — 31% unit share
- Behr — 27% unit share
Sherwin Williams comes in as the top brand with 31% dollar share, with a slight increase of 0.1 point YOY — continuing an upward trend seen over the past three years. In second place for dollar share, Behr (27%) is up 0.8 points from last year.
Brand Consideration Rates
Similar to draw rate, brand consideration looks at the number of consumers who considered buying a brand during their shopping process.
In the Paint market, the most considered brand is Behr at 36%. Behr is followed by Sherwin Williams (24%) and Valspar (11%). Brand considerations for Behr and Sherwin Williams increased 1.0 point and 0.7 points, respectively, from last year.
The rise in Behr and Sherwin Williams’ brand consideration rates continues an upward trend seen over the last several years.
To see further Paint brand share data, download our infographic.
How much do consumers spend on Paint?
As of March 2024, the total industry average price paid (APP) per ticket in the Paint Market was $76. In 2023, the APP was $74. Let’s see how the average price breaks down depending on where the paint is purchased, as well as what brand is selected.
Average Price by Retailer
Among the top Paint market retailers, Sherwin Williams has the highest average price spent of $139 per ticket — and is the only top retailer with an average spend that is higher than the industry average. The higher average price per ticket at Sherwin Williams retailers is due in part to the quantity purchased. That is, consumers purchasing at Sherwin Williams are more likely to purchase for a larger project (e.g. multiple gallons).
Home Depot and Lowe’s (the largest outlets for unit share) have an average spending price of $65 and $66 per purchase ticket, respectively, coming in at $10 under the average price.
Average Price by Brand
Of the major brands in the Paint market, the Sherwin Williams brand also has the highest average price per ticket of $126, followed by Benjamin Moore ($102) and Valspar ($68).
Online vs. in-store sales trends in the Paint market

As of March 2024, in-store overwhelmingly remains the top sales channel for Paint purchases, accounting for 95% of all sales. Only 4% of Paint purchases were made online.
Historically, Paint purchases have been almost exclusively made within a physical in-store location. While that remains the case, purchases from retail outlets have trended down slightly over time; particularly during the pandemic, where retail outlet sales decreased about 3 points. Current retail sales have not returned to pre-pandemic levels.
Other notable online vs. in-store insights include:
- Of the small percentage of purchases online, 29% have the product shipped to the store for pick up
- Of those purchasing brick and mortar, only 10% shopped online
Other Paint market insights
Paint Market Buyer Demographics
Understanding who is buying your products — the makeup of your market, the characteristics of your consumers — can help better inform everything from your business strategy, to your product development, marketing, and more.
With that in mind, let’s take a look at who the typical consumer is within the Paint market.
- 85% of Paint purchasers are homeowners; 13% of purchasers are renters
- 65% of homeowners purchasing Paint have been in their residence 5+ years
- 64% of Paint purchasers are married
- 39% of Paint purchases were made with females only involved in the purchase decision; 22% have male only involved in the decision
- Baby Boomers make up 44% of all Paint purchases, followed by Gen X (29%)
- 20% of purchases are by Millennials
- Gen Z and Matures generations each make up 4% of Total Paint purchases
- Gen X and Millennials are the only generations with increases in share of purchases from this time last year, +1.1 points and +1.0 point, respectively
Purchase Drivers
As seen in previous years, the most mentioned reason consumers purchase Paint products is “Routine maintenance or minor repair,” which has increased 3.5 points from this time last year.
The top three reasons for purchasing Paint products are:
- “Routine maintenance or minor repair” (47%)
- “Redecorated” (29%)
- “Part of a remodeling project” (17%)
The most mentioned reasons for purchasing at a specific retailer are:
- “Previous experience with store” (39%)
- “Good selection of products” (39%)
- “Convenient location” (38%)
- “Competitive price” (34%)
The most mentioned reasons for purchasing a specific Paint brand are:
- “Quality product” (49%)
- “Good brand name” (36%)
- “Previously owned brand” (33%)
- “Competitive price” (33%).
Outlets & Brands Shopped
When shopping for Paint products, 72% of purchasers shopped at only one store before making a purchase, and 78% shopped only one brand.
Paint Home Improvement Project Insights
How were Paint purchases used in home improvement projects? As of March 2024, here are some key insights related to projects consumers complete with their purchased paint:
- 66% of Paint purchases were for touch up or smaller projects (1 gallon or less), which is up 1.4 points from this time last year, continuing an upward trend seen over the past four years
- Most coating purchases (88%) were applied by the purchaser, household member, or friend
- Smaller projects (1 gallon or less) are more likely completed by someone in the household or a friend
- Consumers purchasing at a paint or specialty store (e.g. Sherwin Williams, Benjamin Moore, etc.) were more likely to have larger projects and are therefore more likely to have a person outside the home perform the task
Download our Paint market
infographic for all the insights
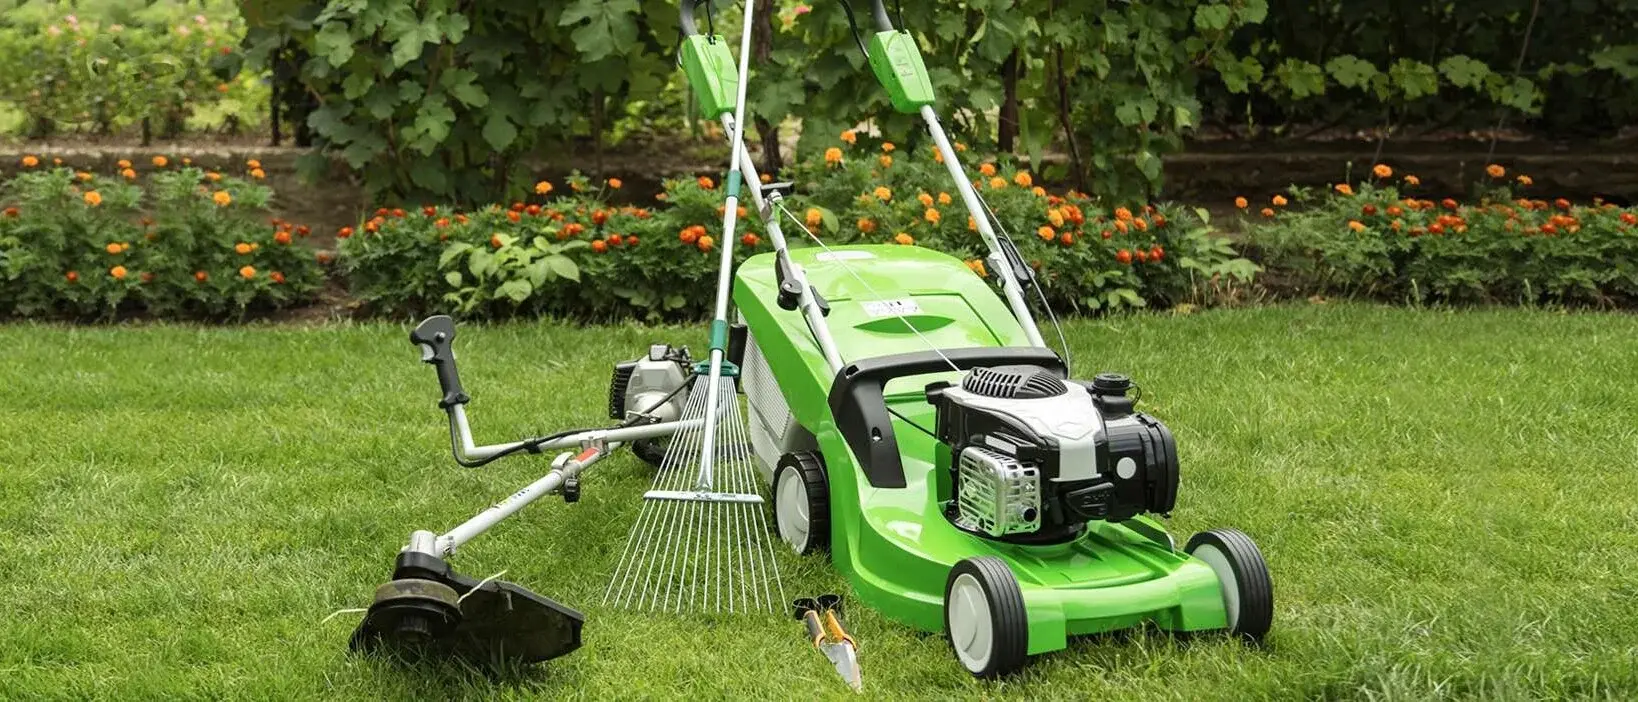
Lawn & Garden Industry: 2024 Market Share Trends & Rankings
According to research by the Home Improvement Research Institute, consumer spending in the Lawn & Garden market decreased in 2023, trending down since 2022. However, they predicted to see a rise in spending in 2024 and beyond. With that in mind. some of the key data insights from our free US Lawn & Garden market rankings infographic (download now!).
SOURCE: All data insights in this article cover the rolling four quarter period ending March 2024 within the OpenBrand MindShare US Lawn & Garden product category. Contact us to get the latest data. The US Lawn & Garden product category is an aggregate consisting of a wide array of various lawn and garden supplies such as lawn equipment (mowers, blowers, trimmers), garden tools, plant supplies, etc.

Who are the top retailers in the Lawn & Garden market?
The top retailers in the Lawn & Garden market are Home Depot and Lowe’s. While winning the market in both dollar and unit share, let us look at how the share precent breaks down for these top retailers and more.
Lawn & Garden Retailers: Unit Share Winners
By unit share, Home Depot continues to lead all other outlets in Lawn & Garden sales at 24%, despite a small loss of 0.2 points from the same time last year. In second place at 20% share is Lowe’s, also down 0.6 points from last year.
Third and fourth place were won by Walmart (14% share) and Amazon (10% share) — both up slightly year-over-year, gaining 0.3 points and 0.1 points respectively.
Lawn & Garden Retailers: Dollar Share Winners
In outlet dollar share, Home Depot leads all other outlets with 23% share, with Lowe’s following closely behind at 22%.
In terms of major retailers, Walmart holds third place in dollar share as well with 7% — which has slowly increased over the past four years, increasing 0.1 point or 0.2 points every year. In fourth place, Amazon dollar share is 6%, which is down 0.1 point from the prior year.
Lawn & Garden Retailers: Draw-Close Rates
Retailer draw rate looks at the percent of all consumers who shopped at a particular retailer, regardless of where they made their final purchase.
Here are the draw rates for the top Lawn & Garden retailers:
- Home Depot – 36%
- Lowe’s – 33%
- Walmart – 21%
- Amazon – 14%
Year-over-year, Home Depot and Walmart experienced mostly flat draw rates, while Lowe’s saw a decline of about one point.
Of the consumers they brought into the store, how many did these retailers close? While Home Depot saw a close rate of 66%, Amazon had the highest close rate of the top four Lawn & Garden retailers, with 74% of all consumers shopping Amazon buying from there as well.

Lawn & Garden Retailers: Other Stores Shopped
When purchasing a new Lawn & Garden product, 64% of purchasers shopped at only one retailer before making their purchase. Jump to Retailer Purchase Drivers to see why a specific retailer was selected.
What are the top brands in the Lawn & Garden market?
Due to the TraQline Lawn & Garden category being a large aggregate of various outdoor products, the brand winners for this overarching category are strongly led by the Outdoor Power Equipment sub-category. However, with that in mind, let’s look at the leading brands!
Lawn & Garden Brands: Unit Share Winners
In units sold, the most popular brand across the Lawn & Garden aggregate is Ryobi, with 4.3% market share. Craftsman is the next highest brand with 3.6% share. Both brands are down slightly (0.1 point) from this time last year.
Lawn & Garden Brands: Dollar Share Winners
In brand dollar share, John Deere claims the brand leader spot with 11% share, with Craftsman coming in second at 5% share. Craftsman stayed mostly flat year-over-year — with a modest gain of 0.1 point. Ryobi is the next highest in dollar share at 4%, down 0.3 points from last year.
More Than Market Share: Other Notable Lawn & Garden Market Insights
Average Price Paid: How much do consumers spend in the US Lawn & Garden Market?
For 4Q ending March 2024, the total industry average price paid for the US Lawn & Garden aggregate is $187, which is similar to the $180 average price the year before.
While Lowe’s has the second highest outlet unit share (behind Home Depot), Lowe’s $206 average price paid is significantly higher than all other major outlets. Lowe’s is the only major outlet with an average price spent for Lawn & Garden products that is higher than the industry average.
Ace Hardware has the next highest average price spent of $182, followed by Home Depot’s average price of $174.
Online Vs. Brick & Mortar Sales Trends

As of March 2024, in-store sales remain the most common sales channel for Lawn & Garden purchases, with 72% of purchases made in a retail store. This aligns with the historical trend data for Lawn & Garden purchase channel.
Let’s look a bit deeper at online vs. in-store sales within the Lawn & Garden industry:
- While in-store purchases remain the most popular channel type, the percentage of in-store Lawn & Garden purchases is down 1.1 points year-over-year, and online purchases are up 0.6 points.
- Among consumers purchasing online, 17% have the product shipped to store for pick up.
- Overall, 44% of all purchasers shopped online, regardless of purchase channel, which is up 1.7 points from this time last year.
- Among consumers who bought from brick and mortar stores, 26% shopped online prior to purchase, which is up 1.4 points from last year.
Demographics: Who buys the most US Lawn & Garden product?
Just who buys Lawn & Garden? Looking at TraQline’s census-balanced respondent pool, as of March 2024, the typical Lawn & Garden consumers share the following demographics:
- 80% are homeowners; 18% of purchasers are renters
- 62% are married
- 49% of purchases are made with male only involvement in the shopping process, 33% of purchases are made with female only, 19% have both involved
- 64% of purchasers are in the generations Baby Boomers (36%) or Gen X (28%)
Want to know more about how these demographics breakdown by sub-category or product? Download the full infographic and we’ll be in touch or contact us to ask!
Purchase Drivers: Why are consumers making Lawn & Garden purchases?
As seen in previous years, the top four mentioned reasons for purchasing new Lawn & Garden products include:
- “Old one was broken/required service” (37%)
- “First time purchase” (15%)
- “Moved to a new home” (8%)
- “Other reason” (8%).
The most mentioned reasons for purchasing at a specific retailer are:
- “Competitive price” (52%)
- “Good selection of products” (30%)
- “Convenient location” (27%)
- “Previous experience with store” (23%)
- “Already in store buying other items” (21%)
Download our Lawn & Garden
market infographic for all the insights

Assortment Planning Analytics: Strategies, FAQs, & Best Practices
Staying ahead of the curve in today's fast-paced retail landscape is no small feat.
There is hope, however.
With assortment planning analytics, businesses can uncover valuable, actionable data hidden in vast swaths of information, rapidly identify market trends, defend against competitive threats, and plan for dynamic consumer demands. This powerful tool offers a comprehensive, high-level view of assortment strategies, empowering companies to make informed decisions and drive revenue growth.
What are Assortment Planning Analytics?
While Google currently defines assortment analysis as a way for manufacturers to monitor their product segments and protect their brands, assortment planning analytics take this concept to new heights. It provides a holistic, analytical approach to understanding and optimizing your product assortment strategy in relation to your competitors.
Rather than simply tracking your own products, assortment planning analytics gives you a bird's eye view of the entire market, allowing you to compare your assortment planning strategies against other retailers and manufacturers and better prepare for key business practices such as product line reviews.
This invaluable insight enables you to identify gaps, capitalize on opportunities, and stay ahead of the competition.
The 5 Primary KPIs for Assortment Planning Optimization
To truly harness the power of assortment planning analytics, businesses should focus on five critical key performance indicators (KPIs):
- Revenue and profit growth: This fundamental metric tracks the overall financial performance of your assortment strategy. By monitoring revenue and profit growth, you can gauge the effectiveness of your product mix and identify opportunities to increase sales and margins.
- Market share and penetration within relevant categories, sub-categories, and price bands: Keeping a close eye on your market share and penetration across different product categories, sub-categories, and price points allows you to pinpoint areas where you excel and areas that need improvement. This information is crucial for making strategic decisions about where to focus your efforts and resources.
- Customer loyalty and retention: A loyal customer base is essential for long-term success. Assortment planning analytics can help you understand customer preferences, identify products that drive repeat purchases, and develop strategies to foster lasting relationships with your customers.
- Product availability and turnover: Ensuring that your products are readily available and moving off the shelves at an optimal rate is crucial for maximizing sales and minimizing inventory costs. Assortment planning analytics can help you identify slow-moving items, optimize stock levels, and make data-driven decisions about product replenishment.
- Customer feedback analysis: Understanding customer sentiment and gathering insights from feedback is invaluable for refining your assortment strategy. Assortment planning analytics can help you analyze customer reviews, survey responses, and other feedback data to identify areas for improvement and tailor your product offerings to better meet customer needs.
By closely monitoring these KPIs, companies can gain a comprehensive understanding of their assortment performance, identify areas for improvement, and make data-driven decisions to drive growth.
Key Factors of a Successful Assortment Strategy
Effective assortment planning analytics incorporates several key factors to ensure a successful assortment strategy:
- Competitor Analysis: Monitoring your competitors' assortment planning strategies is essential to defend against threats and seize opportunities in the market. By understanding their moves, you can stay one step ahead.
- Historical Data: Leveraging past sales data and consumer behavior patterns can provide valuable insights into future trends, enabling you to anticipate demand and adjust your assortment accordingly.
- Balanced Assortment: Striking the right balance between staple products and trendy items is crucial. Assortment planning analytics helps you identify the ideal product mix to meet customer needs and maximize revenue.
- Cross-Merchandising: By analyzing customer preferences and purchase patterns, you can identify complementary products to cross-merchandise, enhancing the shopping experience and increasing sales.
Assortment Planning Analytics: Best Practices
To fully leverage the power of assortment planning analytics, it's essential to follow best practices:
- Invest in Robust Tools: Utilize advanced analytics tools that can process vast amounts of data, providing actionable insights and visualizations to inform your decisions.
- Harness Historical Data: Take advantage of your organization's legacy data to identify patterns, trends, and opportunities that might otherwise go unnoticed.
- Adopt a Data-Driven, Customer-Centric Approach: Prioritize data-driven decision-making that puts the customer experience at the forefront, ensuring your assortment meets their evolving needs and preferences.
- Continuous Monitoring and Optimization: Assortment planning is an ongoing process. Regularly monitor your performance, gather customer feedback, and adjust your strategy as needed.
Examples of Effective Retail Assortment Analytics Tools
While there are numerous assortment analytics tools available in the market, it's essential to choose solutions that align with your business needs and objectives. Some examples of effective tools include:
- POS Data Guy / krunchbox: Trusted provider in retail data management, helping clients harness the power of POS data, delivering analytics from your own POS data and helping find the golden nugget insights.
Learn more about what Doug Murless, the POS Data Guy,
and krunchbox can offer in our recent podcast episode.
- Retail Pro: This comprehensive retail management software offers assortment planning capabilities, allowing you to analyze sales data, optimize stock levels, and make informed merchandising decisions.
- Oracle Retail Assortment Planning: Part of Oracle's retail suite, this tool helps retailers plan and optimize their product assortments based on consumer demand, competitive landscape, and business objectives.
- SAS Assortment Optimization: Leveraging advanced analytics and machine learning, this solution helps retailers optimize their assortments, maximize profitability, and enhance customer satisfaction.
In addition to tools like the ones listed above, TraQline delivers unmatched market data that can help improve your assortment planning.
TraQline: Helping Businesses Improve Customer Data Analytics

At TraQline, we understand the vital role that customer data analytics plays in driving successful assortment planning strategies. Our cutting-edge solutions — including Hybrid POS™ and SKU Metrix™ —empower businesses to unlock the full potential of their data, delivering actionable insights, and facilitating consumer-driven data-based decisions.
Whether you're looking to streamline your assortment planning processes, gain a competitive edge, or enhance customer experiences, TraQline is your trusted partner for all your customer data analytics needs. Contact us today to learn more about the product data we deliver for your market.
About the Author
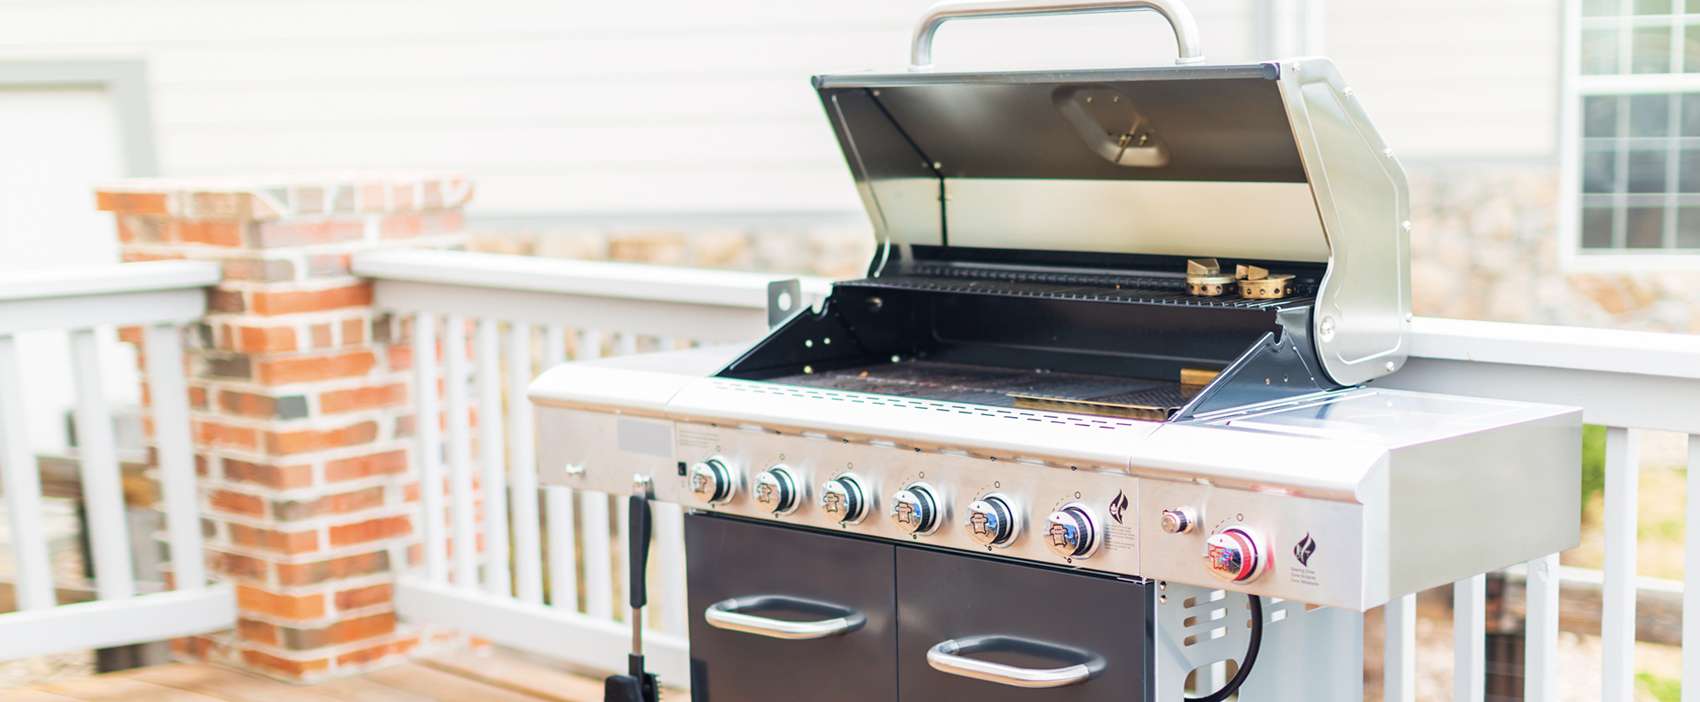
US Barbecue Grills: 2024 Market Share Trends & Rankings
<<The latest outdoor cooking data and infographic can be found here.>>
With grilling season upon us, let’s look back on how consumers prepared for the warmer months over the last year, diving into the details on Barbecue Grill market data and purchase insights — including the who, what, where, when, how, and why.
Read on to discover some of the key data insights from our free US Barbecue Grills market rankings infographic (download now!).
SOURCE: All data insights in this article cover the rolling four quarter period ending March 2024 within the OpenBrand MindShare Total US Total Barbecue Grill product category. Contact us to get the latest data. The Total Barbecue Grill product category is an aggregate of grill types consisting of: Grills (65%), Griddle Grills (27%), and Smokers (7%).

Who are the top Barbecue Grill retailers by market share?
As of March 2024, the top five retailers for Barbeque Grills are Walmart, Home Depot, Lowe’s, Amazon, and Ace Hardware.
The leading retailer shifts when looking at either unit or dollar share. Let’s look at the top three for each — and download the infographic to see more.
Barbeque Grill Retailers: Unit Share Winners
Walmart leads all other Barbeque Grill outlets in units sold with 26% share, and no significant change compared to last year.
Home Depot has the next highest unit share at 19%, also with no significant year-over-year change. In third place is Lowe’s with 17% — down nearly 1 point from last year, continuing a three-year downward trend.
Does a 1% shift in share seem small? Look at it in context. The Barbeque Grill market was valued at more than $5 billion in 2023. Meaning a 1% drop in share denotes a $50 million loss.
Barbeque Grills Retailers: Dollar Share Winners
In dollar share, Home Depot won the greatest share of the Barbeque Grill market with 22%. Lowe’s comes in at a close second with 20% share. Walmart’s dollar share is 15%. For all three retailers, share remained mostly unchanged over the past two years.
Outlet Draw Rates
Looking at our top three retailers, how well did they draw in consumers shopping for Grills?
Walmart saw the highest draw rate, with 35% of all consumers who purchased a Barbeque Grill in the last year shopping at Walmart before final purchase. Notably, Walmart closed with 73% of those shoppers, claiming the highest closing rate of all the top Barbeque Grill retailers. Meanwhile, Home Depot drew in 34% of Grill shoppers and Lowe’s drew in 32%.
Download the infographic to see draw and close rates for all top five retailers.
Who leads the Major Home Appliances market share by brand?
As of March 2024, the top five brands for Barbeque Grills were Weber, Blackstone, Traeger, Char-Broil, and PitBoss. Let’s look at how the top three brands shift based on unit and dollar share.
Barbeque Grill Brands: Unit Share Winners By units sold, the most popular US Barbeque Grill brand was Weber with 19% share, followed by Blackstone (12%), and Char-Broil (8%).
Are Barbeque Grills brands seeing a trending decline in popularity?
While top Barbeque Grill brands like Weber and Char-Broil have historically led brand share, the same leaders have experienced a steady decline over the past four years. More specifically, Weber lost 2.4 points and Char-Broil 1.4 points versus a year ago. Additionally, both are down compared to 4QE March 2020. Weber is directionally down from 2020, with a 32% change. Char-Broil is directionally down from 2020 as well, with a 60% change.
Meanwhile, more recent market additions such as Blackstone have significantly increased in the past four years. As of March 2024, Blackstone is up 3.4-unit share points year-over-year, overtaking Char-Broil for the second most popular brand.
Barbeque Grills Brands: Dollar Share Winners
In dollar share, Weber remains the Barbeque Grill brand leader with 21% share. However, Weber saw a continued downward trend for the past year, losing 3% share since March 2023.

As seen with unit share, Blackstone gained share this year, coming in as the second most popular Barbeque Grill brand with 13%. This put Blackstone ahead of Traeger (10%) and Char-Broil (6%) — who both saw a loss of 1 percentage point compared to the same time last year.
Blackstone’s rise in share is likely attributed to the growth of griddles, a space in which Blackstone is the predominant brand.
Brand Consideration Rates
What percent of consumers considered the top brands before making their purchase?
-
- Weber — 25% brand consideration rate
- Blackstone — 15% brand consideration rate
- Char-Broil — 10% brand consideration rate
- Traeger — 8% brand consideration rate
- PitBoss — 5% brand consideration rate
Unsurprisingly, given their rise in share wins, brand consideration for Blackstone increased 4.1 points since March 2023, while brand consideration for Weber and Char-Broil decreased, down 3.4 points and 1.7 points respectively.
More Than Market Share: Other Notable Barbeque Grill Market Insights
Online vs. In-Store: How are sales trending by channel in the Barbeque Grills market?
As of March 2024, Barbeque Grills are most often purchased in a retail store, accounting for 70% of all sales.
Historically, Barbeque Grill purchases are much more likely to be made in-store, however the percentage has trended down in the past few years — declining 1.1 points from this time last year.
Other insights around online vs. in-store Barbeque Grill purchases include:
-
- Of consumers purchasing online, 21% have the product shipped to the store for pick-up.
- Across all purchases, made both online and in-store, 55% of consumers shopped online for grills before buying; with 39% of consumers shopping online before making a purchase in-store.
Average Price Paid: How much do consumers spend on Barbeque Grills?
As of March 2024, the average price paid across the Barbeque Grill market was $316. The average price for grills saw little change year-over-year, rising only $1 since March 2023
When looking by retailer, the average price paid shifts slightly.
Home Depot ($358) and Lowe’s ($356) have the highest average prices paid for Barbeque Grills, when compared to other top outlets. Both retailers saw a slight increase in the average prices paid for girlls this time last year.
Notably, the leading outlet by units sold, Walmart saw a much lower average price paid of only $189. Due to this lower price, the retailer only comes in third for dollar share.
Consumer Demographics: Who is the typical Barbeque Grill shopper?
Just who buys Barbeque Grills? In March 2024, the typical consumer for Barbeque Grills included the following characteristics:
-
- 70% of purchasers are homeowners; 28% of purchasers are renters
- 61% of purchasers are married
- 44% of purchases are made with male only involved in the shopping process; 30% of purchases are made with female only; 26% of purchases have male and female involved
- 63% of Barbeque Grill purchasers are in the generations Millennials (31%) or Gen X (32%)
- Purchases by Baby Boomers (25%) saw a decrease of 3.3 points
- Millennials (31%) and Gen Z (11%) increase in share of purchases from last year, up 1.8 points and 2.2 points, respectively
Features: What Barbeque Grill qualities most attract consumers?
The most common Barbeque Grill features found in purchased units include:
-
- Warming rack (34%)
- Cast iron grates (34%)
- Exterior folding side table/shelf (26%)
- Adjustable fire grate (25%)
- Enclosed cabinet (20%)

What fuel type is most popular with Barbeque Grill purchasers? Gas (43%) and charcoal (33%) are the most popular fuel types seen in Barbeque Grill purchases. However, the gas is down 1.3 points and charcoal decreases 0.9 points from last year — with electric grills rising in popularity, up 1.5 points year-over-year.
Most Barbecue Grill purchases are full-size models, accounting for 86% of gas grill purchases and 62% of electric grill purchases.
Purchase Drivers: Why are consumers making Barbeque Grill purchases?
As seen in previous years, the most mentioned reason for purchase of a new Barbeque Grill is “Old one was broken/required service.”
The top four reasons for purchasing a Barbeque Grill are:
-
- Old one was broken/required service (37%)
- First time purchase (20%)
- Moved to a new home (13%)
- Wanted a new one (12%)
Interestingly, “Wanted a new one” increased by 2.9 points from this time last year.
Retailer Purchase Drivers
The most mentioned reasons for purchasing Barbeque Grills at a specific store include:
-
- Competitive price (56%)
- Good selection of products (27%)
- Convenient location (23%)
- Previous experience with store (18%)
- Saw display in store (17%).
While not top ranked outlets, Amazon and Menards over-index for “competitive price” as the top purchase driver.
Brand Purchase Drivers
The most mentioned reasons for purchasing a specific brand of Barbeque Grill are “Competitive price” (43%), “Features desired” (31%), and “Quality product” (31%).
Outlets & Brands Shopped: Where/what else are Barbeque Grill consumers shopping?
When purchasing a Barbeque Grill, 57% of consumers shopped at only one
store before deciding, and 73% shopped for only one brand.
Download our Barbeque Grills
market infographic for all the insights

Pros & Cons of Consumer Data Collection Types
Consumer data is a critical tool for understanding your market and improving your business strategy. It provides insight into purchasing behavior, preferences, and trends. This data helps optimize product placement, inventory management, and marketing strategies — ultimately enhancing customer satisfaction and driving sales growth.
In this blog post, we will look at the advantages and disadvantages across different types of consumer data collection. Read to discover key principles to look for when evaluating how to collect consumer data and reasons to use one option versus another.
Consumer data collection types
Though not fully comprehensive, here is a list of the primary types of data collection that we will examine in this article.
-
- Credit Cards
- Receipt Panels
- Government (Census, Voter History)
- Surveys (Door-to-Door, Mall Intercept, Telephone, Mail, Online)
CREDIT CARD DATA
Due to heavy market usage (with an estimated 191 million Americans owning at least one credit card), credit cards are a prominent source of consumer data and a valuable metric for analyzing retail performance.
ADVANTAGES OF CREDIT CARD DATA
-
- Data is robust and easily obtainable
- Factual, transaction-specific information — no room for subjectivity
- Delivers insight into buying behaviors and spending patterns at specific retailers
- Good for wholistic retailer metrics
- Tracks transactions across online and in-store purchases
- Data can be updated very frequently
DISADVANTAGES OF CREDIT CARD DATA
- Often lacks specificity; lacks a breakdown of spending by line item or category
- Lacks the granularity to explain why consumers make specific purchases or emotional responses to products
- Quantitative data only
-
-
GOVERNMENT DATA
Government data, such as the US Census, is a good source of consumer demographic information.
ADVANTAGES OF GOVERNMENT DATA
- Rich demographics data
- Direct from consumer
- Publicly accessible, available to anyone
- High-quality
-
-
DISADVANTAGES OF GOVERNMENT DATA
- Timeliness; may be very lagged – such as the US census is only fully collected once every 10 years
- Can be complex to extract insights from; needs a level of expertise to understand
- Typically quantitative data only
RECEIPT PANEL DATA
Receipt panel data typically involves consumer-submitted receipt images from either a photographed paper receipt or emailed digital receipt.
ADVANTAGES OF RECEIPT DATA
- Detailed purchase insights; SKU-level information, basket purchases, etc.
- Typically includes online and in-store data
- Authenticity, as it does not rely on consumer recall
-
-
DISADVANTAGES OF RECEIPT DATA
- Cannot calculate market share
- Representation will be limited due to panel base and low incident items
- Low data quality and gaps in data due to variance in submitted receipts
- Retail variation in product numbers (SKUs) and features create discrepancy
- Privacy concerns limit the ability to collect without consumer submission
- Quantitative data only
- Sample representation may be biased towards those willing to use a smartphone to take photos
- Requires “product information master” to decode items on the receipt into an actual product
-
-
SURVEYS & INTERVIEW DATA
Alongside the advancement of technology, survey and interview methodologies evolved over the past few decades — taking us from heavily limited door-to-door questionnaires to the more modern and highly accessible online survey.
While all these methods are still a valid method of gathering information, this list will highlight the evolution of surveys and the disadvantages of each.
ONLINE SURVEYS
Today, the most popular and efficient method of survey data collection are online surveys, which use the internet to distribute questionnaires through a technological device.
ADVANTAGES OF ONLINE SURVEYS
- Can accommodate high response numbers, allowing for a better market representation
- Extremely wide reach, not limited to geographical area
- Cost-effective
- Panel profiling allows for better targeting and therefore less expensive
- Automated data collection decreases turnaround time
- Easy integration with data analysis tools
- Can result in both quantitative and qualitative data
- Reporting may be made in real-time and changes can be made to sampling or surveys “on the fly”
-
-
DISADVANTAGES OF ONLINE SURVEYS
- Consumer recall bias
- Low engagement of respondents (survey fatigue)
- Can be lengthy and boring for consumers
- Representation — some demographics are under-represented (low income, unacculturated Hispanics for example)
- Privacy concerns
- Data quality issues between fraud and validity of responses — requires a backend system that can mitigate data quality risks
-
-
TELEPHONE SURVEYS
This method of data collection involves interviewers using phone calls to reach respondents. Today, these surveys often use automated voice systems to conduct the interviews.
ADVANTAGES OF TELEPHONE SURVEYS
-
- Can reach a wide range of consumers — not limited by geographical area
- Cost-effective compared to in-person interview methods like door-to-door
- Efficient, allows for quick turnaround of data especially when using automated response recording technologies
- Reduced response bias — delivers sense of anonymity compared to face-to-face interviews
- Can result in both quantitative and qualitative data
DISADVANTAGES OF TELEPHONE SURVEYS
- Response rates are declining, hang-ups are more frequent
- Technological limitations — poor connection, speaker clarity, etc.
- Data quality issues
- Expensive
-
-
MAIL SURVEYS
Still used prevalently throughout the world, mail surveys are standardized questionnaires that are sent to someone’s physical address to be filled out and mailed back.
ADVANTAGES OF MAIL SURVEYS
-
- Wide reach, not limited to geographical location, online, or telephone access
- Not limited by technology
- No interview bias
- Can result in both quantitative and qualitative data
DISADVANTAGES OF MAIL SURVEYS
- Low response rate
- Can be costly with prepping, mailing, receiving, processing
- Slow — delayed consumer response rate
- Limited data and low depth to insights gathered
-
-
DOOR-TO-DOOR
While used less frequently today in the US, door-to-door questionnaires were once a prevalent method of gathering consumer data. As indicated by the name, door-to-door involves visiting individual homes to conduct a survey or in-person interview.
ADVANTAGES OF DOOR-TO-DOOR
-
- Personal interaction/verify speaking with real human (allows for sight-screening)
- Geo-targeting typically allows for socio-economic targeting
- High response rate
- Detailed data collection as interviewer can follow-up on information provided
- Can result in both quantitative and qualitative data
- Can be highly representative by including harder to reach audiences
DISADVANTAGES OF DOOR-TO-DOOR
- Can be costly
- Very time-consuming
- Limited by local area/geographical restraints (e.g harder to collect representative data in remote areas)
- Data can be biased as consumers may look to provide socially desirable answers due to the face-to-face nature of the interview (acquiescence bias)
-
-
MALL INTERCEPT INTERVIEWS
This method involves approaching potential respondents in a mall or similar retail setting to conduct surveys or interviews. Often used to gather consumer opinions on products or services relevant to the location where the interview is held.
ADVANTAGES OF MALL INTERCEPT
- Targeted sampling / sight-screening; allows interviews to target specific demographics to create a better representation within collected data
- Detailed data collection, opportunity for follow-up
- Immediate feedback / product interaction
- High volume of respondents in a single location
- Can result in both quantitative and qualitative data
-
-
DISADVANTAGES OF MALL INTERCEPT
- Biased responses can be an issue as consumer could be hurried or looking to provide socially acceptable answers due to the face-to-face nature of the interview
- Consumer representation restricted to those who shop at that location
- Not always permissible
- Data input and analysis can be time costly
-
-
Which method is best for data collection?
The key here is no one type reigns over the rest. Each of these methods has imperfections — and no single source does it all. The effectiveness of any data collection method largely depends on what questions you are trying to answer and the goals of your business.
There is value in categories like credit card and receipt data, in the very narrow granular level of insights businesses can gather from these sources. There is also value in understanding consumer perceptions, which require a survey or interview methodology. However, the greatest value for a business will come at the intersection of those two — the quantitative and the qualitative. The what, how much, and when mixed with the why.
In other words, to fully understand consumer behavior, businesses need to recognize the advantages and limitations of each approach and seek out both the factual sales-level data and the subjective insights from consumer perceptions.
OpenBrand delivers more than one methodology
From survey data to SKU-level receipt insights, our suite of insights solutions delivers the synergy of methodologies that businesses need for comprehensive market understanding. Learn more at Why OpenBrand.

Beyond the Tape: Why Brands Need More Than Receipt Data
Human behavior is undeniably complex. As explained by psychology, our actions and choices are immensely dynamic, influenced by both internal and external factors.
The decisions consumers make while shopping are no exception; understanding the intricacies behind consumer purchases involves more than reviewing sales data, numbers, and receipts.
In fact, relying solely on sales-oriented outputs to understand consumer behavior can result in making business decisions that ignore key consumer insights — namely, the why behind those metrics, who is shopping, and more.
In this article, we dive into the limitations retailers and manufacturers face when approaching market understanding through a receipt-only lens, and the significant benefits achieved by integrating additional consumer data sources such as survey data, demographic information, and SKU-level data at individual retailers, among others.
Diverse Data Sources in Retail
The key thing to understand about why retailers and manufacturers must look to more than receipt data is that the available data options are vast, and each presents a different perspective and insight into the market. From consumer surveys to receipt data let’s look at a selection of the options available, and the understanding they deliver.
| Data Type | Definition | High-Level Benefits / Understanding Delivered |
|---|---|---|
| Receipt Data | Data from photographed / emailed receipts | Enrich sales tracking and inventory management, understand the top-selling products in the market |
| POS Data | Direct-from-retailer transaction records | Highly representative but only for participating retailers |
| Survey / Panel Data | Consumer questionnaire responses | 100% representative of entire market; understand market perceptions, opinions, and trends through direct-from-consumer insights and feedback |
| Clickstream Data | User web behavior tracking | Online shopping behavior, gain better understanding of customer path to purchase |
| Credit Card Data | Aggregated transactions by location | High-volume of transactions, share by store |
Limitations of Receipt Data Alone
As illustrated in the chart above, relying on receipt data alone for market understanding greatly limits the market insights business can gain.
While inarguably a valuable component of market understanding, receipt data delivers a sales-only view, providing limited understanding of insights into consumer buying decisions, total share of market, demographics, and more.
Other limitations of receipt data include:
- Biased data. Due to the nature of consumer-submitted photographs and web receipts, a bias will exist in the consumers and brands represented. For example, app-based panels are typically more biased towards younger consumers and female panelists.
- Small sample size, poor market representation. While Cheetos and toothpaste are frequently purchased product categories, consumer durable categories result in poor consumer submissions. These low incidence items make it hard to get a large sample, as well as expect consistency, which can interfere with representation.
- Not self-sustaining for processing data. To process individual receipts, a library must support it to connect/translate individual items across retailers. Without this library, it’s just a bunch of numbers and letters on a piece of paper.
- Cannot calculate market share. Without receipts from all the retailers, it’s not possible to calculate share the way a random sample from a panel or survey does — as surveys can deliver 100% market coverage for brands and retailers.
This is where other sources of data, such as survey data, become so critical.
Limitations of Other Data Types
Receipt data is a hot button topic for manufacturers and retailers, which is why we have focused on the limitations of using that source alone. However, each source of data has its own limitations — simply by nature of what these unique data types are, how they’re gathered, etc.
| Data Type | Limitation(s) |
|---|---|
| Receipt Data | Bias in representation with consumers and stores tracked; requires use of product master to decode receipt information; small sample size; cannot be used for market share |
| POS Data | Requires retailer participation to gather data. Retailers can opt out at any time. Narrow market coverage. Not representative of market or share. Data typically masked or aggregated to not reveal specific store POS details or models/brands unique to that store |
| Survey / Panel Data | Consumer recall contains margin of error, must be balanced to census, difficult to calculate sales volume |
| Clickstream Data | Data is online only, cannot give market share, no foot traffic details |
| Credit Card Data | Cannot see individual purchase details or receipt information, just total spend, no consumer details |
The Key to Market Understanding: Data Fusion in Durables
Due to all the aforementioned limitations of individual data sources, it goes without saying that no single source is ideal for understanding the market.
The key to comprehensive understanding in durables is data fusion — that is, the blending of data sources to achieve the clearest picture of your consumers, products, competitors, and industry.
Let’s look at the types of data output accessible through these sources, the benefits of having access to each output, and how to obtain each.
| Data Output | Definition | High-Level Benefits / Understanding Delivered | Source Info |
|---|---|---|---|
| Market Share | Company sales percentages | Measure competitive performance and growth, Assess competitive market status, industry position, and market dynamics | Survey Data |
| Product Sales | Model-level performance data | Track how specific SKUs perform in the market, optimize product assortment and inventory management | Receipt DataPOS DataClickstream |
| Demographics | Buyer characteristics | Know who your typical consumer groups are, improve targeting and messaging to align with specific segmentations (best customers) | Survey DataSome Receipt Data (from specific providers) |
| Behavioral / Attitudinal | Consumer actions and habits; feelings and opinions | Discover the “why” behind the buy; base decisions on consumer behavior, improve personalization and engagement, and inform product positioning and marketing strategies | Survey DataSome Receipt Data (from specific providers) |
| Channel | Sales / distribution route details | Optimize effective distribution effectiveness, sales channels, and channel strategies with online vs. in-store (and beyond) performance data | Survey Data POS + Clickstream Receipt Data |
TraQline: the Leading Single Source of Truth for Durable Goods
Are you ready to get the most complete picture of your market? TraQline delivers total market insight for durable goods retailers and manufacturers, providing data from consumer to SKU. Our team uses receipts, surveys, clickstream and more to help our clients understand their consumers and the market for durable goods. To learn more about our suite of insights solutions, contact us below.