




In Q2 2026, outdoor power equipment market share shifted sharply at retail: Lowe’s moved within 1.2 percentage points of Home Depot in dollars, while Walmart nearly caught Amazon in units.
According to OpenBrand’s Q2 2026 MarketShare data, these competitive shifts took place within a retailer panel where unit sales declined 16.9% year over year and dollar sales fell 17.5%. Gaining share and growing sales are different outcomes in this market.
This is just one way we’re seeing the OPE market shift in 2026. Read on for a deeper look into the market for Q2 2026 or view our public quarterly dashboard now.

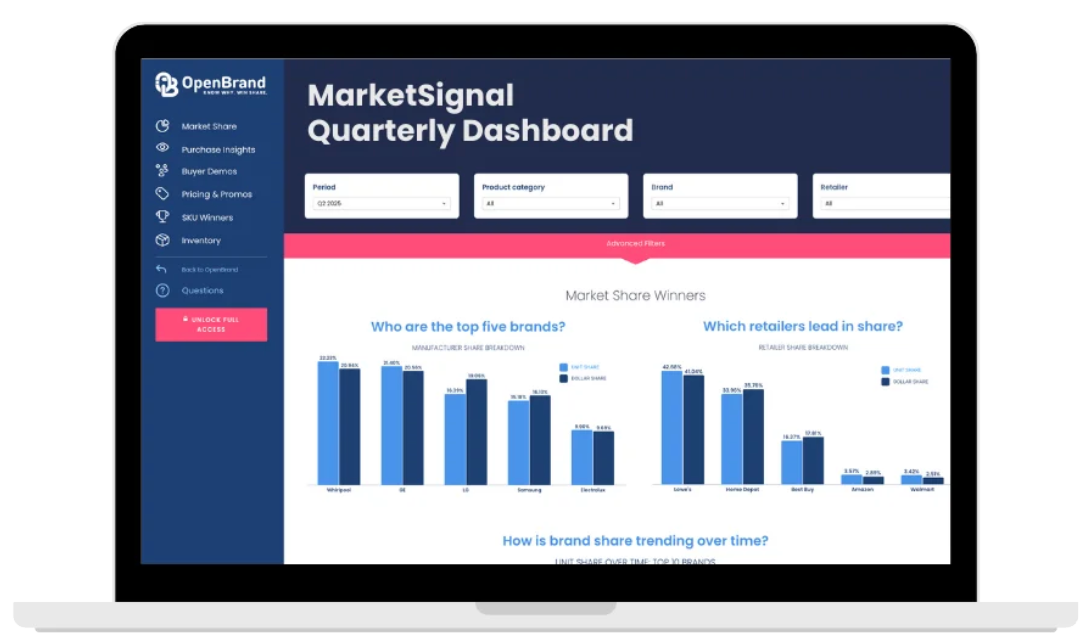
The public OPE MarketSignal dashboard brings together the share, shopper and pricing measures behind these findings. Use the sections below to distinguish who won relative position from where purchasing behavior changed.
SOURCE: OpenBrand Q2 2026 MarketSignal data, including MarketShare, MindShare and Competitive Intelligence. OPE covers mowers, handhelds, snow throwers and pressure washers. Retailer shares and sales totals are limited to the specified retailer panel. Percentages, currency measures and point changes are displayed to one decimal, calculated before display rounding.
Key Takeaways
OpenBrand’s Q2 2026 outdoor power equipment data highlights five changes for brands and retail buyers:
- Lowe’s challenged Home Depot on dollars, not volume: Lowe’s reached 33.8% dollar share, just 1.2 points behind Home Depot, despite a 10.5-point unit-share gap.
- Craftsman led the tracked brands in unit-share gains: Its 2.1-point increase to 10.8% outpaced Ryobi’s 1.6-point gain to 22.7%.
- Walmart nearly caught Amazon: Walmart gained 1.3 points of unit share to 14.1%, while Amazon lost 2.3 points to 14.5%.
- The retailer panel contracted on both measures: Units fell 16.9% and dollars fell 17.5% year over year; implied average selling price eased 0.7% to $306.1.
- Discount depth increased late in the reporting window: Average discounts rose from 19.1% in week 15 to 23.3% in week 27, peaking at 23.6% in week 26.
Who are the top Outdoor Power Equipment retailers by market share?
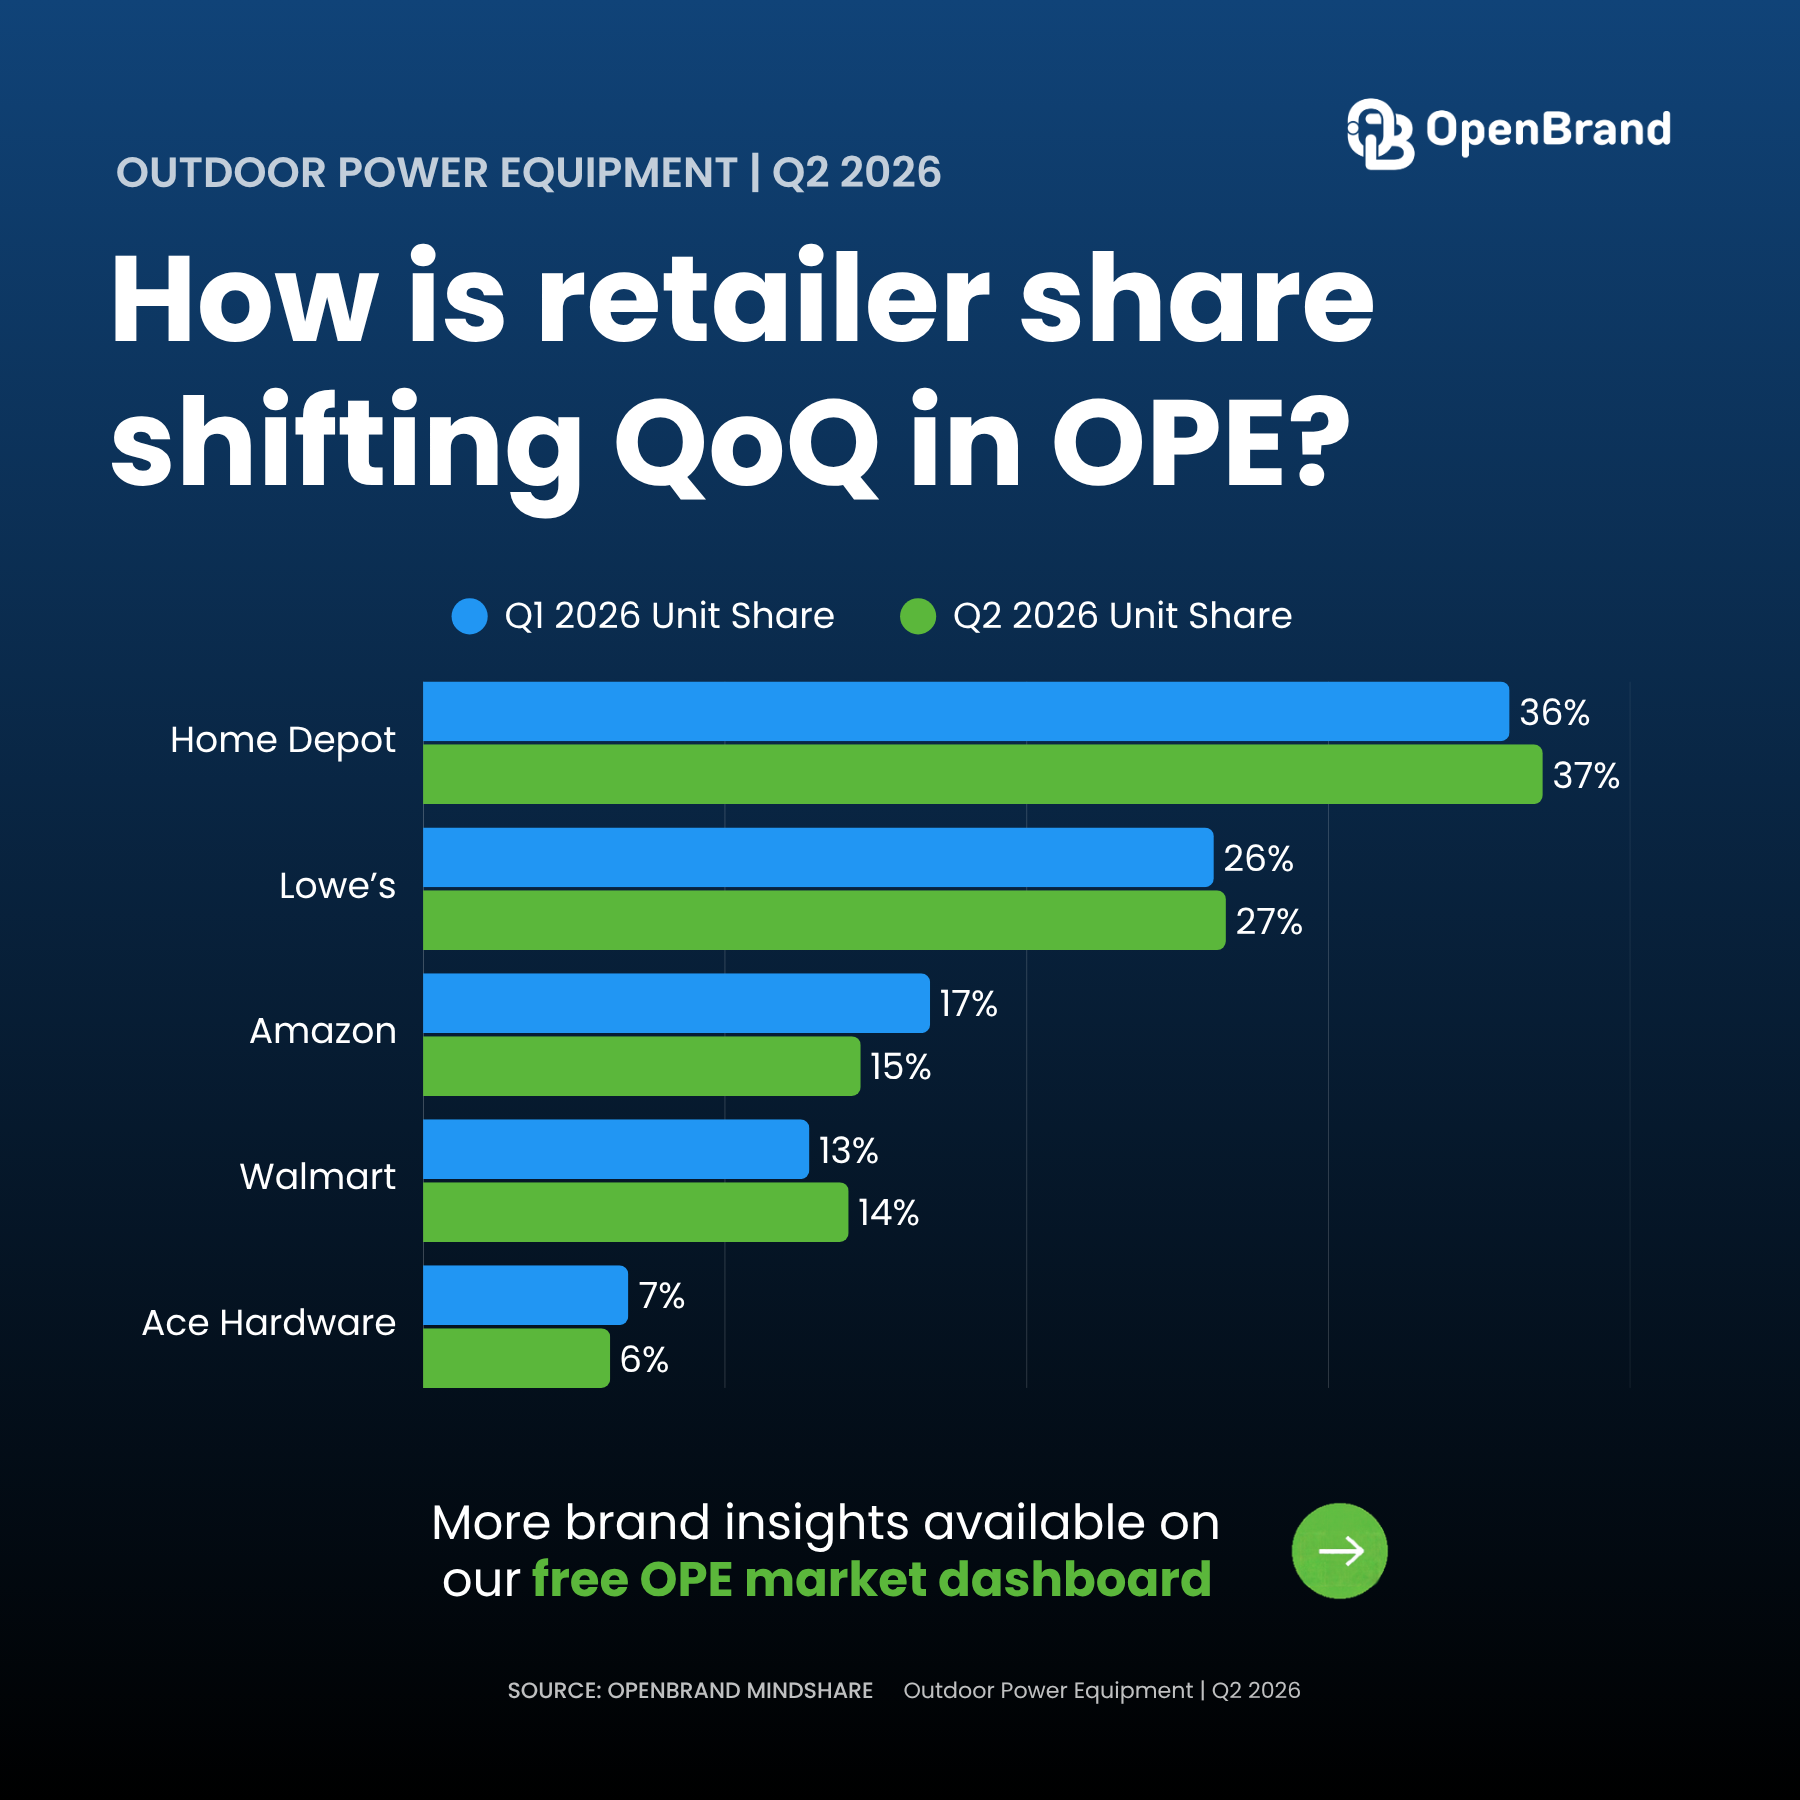
Home Depot retained the Q2 2026 lead at 37.1% of units and 35.0% of dollars, but Lowe’s narrowed its dollar-share deficit to 1.2 points. According to OpenBrand’s panel data, the sharper competitive change was below them: Walmart moved within 0.5 points of Amazon in unit share.The tables compare Q1 with Q2 using OpenBrand’s current historical series. Percentage-point changes are calculated from the underlying values, so they may differ from subtraction of the displayed shares.
Note: OpenBrand’s share split is based on its retailer panel, which currently consists of Home Depot, Lowe’s, Amazon, Walmart, Ace Hardware, Best Buy, and Tractor Supply Co. These retailers make up a majority of non-individual dealer sales in the OPE industry.
Outdoor Power Equipment Retailer Unit Share Winners
| OPE Retailer | Q1 2026 Unit Share | Q2 2026 Unit Share | QoQ Change |
| Home Depot | 36.0% | 37.1% | +1.1 pts |
| Lowe’s | 26.2% | 26.6% | +0.4 pts |
| Amazon | 16.8% | 14.5% | -2.3 pts |
| Walmart | 12.8% | 14.1% | +1.3 pts |
| Ace Hardware | 6.8% | 6.2% | -0.5 pts |
Outdoor Power Equipment Retailer Dollar Share Winners
| OPE Retailer | Q1 2026 Dollar Share | Q2 2026 Dollar Share | QoQ Change |
| Home Depot | 36.9% | 35.0% | -1.8 pts |
| Lowe’s | 31.8% | 33.8% | +2.0 pts |
| Amazon | 10.4% | 10.0% | -0.4 pts |
| Walmart | 7.9% | 8.4% | +0.5 pts |
| Ace Hardware | 9.5% | 6.5% | -3.0 pts |
OpenBrand’s OPE Retailer Trend Insights
- The home centers split volume from value: Home Depot widened its unit lead over Lowe’s to 10.5 points, but its dollar lead narrowed from 5.1 to 1.2 points. Lowe’s dollar share exceeded its unit share by 7.2 points, whereas Home Depot’s dollar share trailed units by 2.0 points. That is a difference in relative transaction value, not evidence that one retailer’s total sales grew.
- Amazon lost its unit-share cushion: Its lead over Walmart shrank from 4.0 to 0.5 points. Walmart recorded the largest unit-share gain in the seven-retailer panel at 1.3 points, while Amazon had the largest decline at 2.3 points. That puts Amazon’s third-place unit position within closer reach.
- Ace Hardware’s dollar position weakened most: Its 3.0-point dollar-share decline was substantially larger than its 0.5-point unit decline. At 6.5% of dollars and 6.2% of units, its Q2 mix no longer showed the large positive value gap visible in Q1.
- Tractor Supply deserves attention beyond the top-five tables: It held only 0.5% of panel units but 4.8% of dollars. Its 2.4-point dollar-share gain was the largest in the full panel, ahead of Lowe’s. Its much higher dollar than unit share shows why unit rank alone can miss an important account.
Outdoor Power Equipment Retailer Draw Rates
OpenBrand’s MindShare survey places Home Depot first on both consideration and conversion among the retailers measured below. Its 71.3% close rate exceeded Lowe’s by 12.3 points, even though Lowe’s dollar share nearly matched Home Depot’s. Survey conversion and modeled dollar share answer different questions; neither substitutes for the other.
| Retailer | Q2 2026 Draw Rate | Q2 2026 Close Rate |
| Home Depot | 37.6% | 71.3% |
| Lowe’s | 32.7% | 59.0% |
| Walmart | 18.6% | 61.7% |
| Amazon | 13.2% | 69.4% |
| Ace Hardware | 6.7% | 53.7% |
OpenBrand’s OPE Retailer Trend Insights
Home Depot’s 28.7% walk rate leaves a meaningful pool of shoppers buying elsewhere. Lowe’s won 50.9% of those lost shoppers, compared with Amazon at 12.9%, Walmart at 9.8% and Ace Hardware at 6.3%. Lowe’s is the dominant named destination in that leakage analysis, but the figures do not prove that leakage caused its dollar-share gain.Amazon’s 69.4% close rate sat close to Home Depot’s, despite a much smaller 13.2% draw rate. Walmart showed the opposite profile: greater reach at 18.6%, but a lower 61.7% close rate. For an account review, Amazon’s consideration base and Walmart’s conversion gap therefore deserve different questions.
Tractor Supply, outside the five-row display, drew 3.1% of shoppers and closed 63.3%. Its large dollar-to-unit share gap is not explained by an unusually high close rate.
Use OpenBrand’s retail leakage analysis to frame which competitors benefit when a retailer fails to close a shopper.
Who leads the Outdoor Power Equipment market share by brand?
Ryobi led the brand rankings below with 22.7% unit share and 13.1% dollar share in Q2, but Craftsman made the biggest unit-share gain. OpenBrand’s ten-brand trend series shows Craftsman adding 2.1 points to reach 10.8%, its highest share in the five-quarter period from Q2 2025 through Q2 2026.
Outdoor Power Equipment Brand Unit Share Winners
| OPE Brand | Q1 2026 Unit Share | Q2 2026 Unit Share | QoQ Change |
| Ryobi | 21.1% | 22.7% | +1.6 pts |
| Craftsman | 8.7% | 10.8% | +2.1 pts |
| Ego | 8.1% | 8.3% | +0.2 pts |
| DEWALT | 5.7% | 5.4% | -0.3 pts |
| Kobalt | 4.6% | 4.4% | -0.2 pts |
Outdoor Power Equipment Brand Dollar Share Winners
| Outdoor Power Equipment Brand | Q2 2026 Dollar Share |
| Ryobi | 13.1% |
| Ego | 11.4% |
| Craftsman | 7.8% |
| DEWALT | 4.7% |
| Kobalt | 2.7% |
The OPE MarketSignal dashboard provides additional context for how share, consideration and individual products line up.
OpenBrand’s OPE Market Trend Insights
- Craftsman, rather than Ego, delivered the strongest Q2 gain: Craftsman and Ryobi together added 3.7 points of unit share. Ryobi still led Craftsman by 11.9 points, but Craftsman’s increase was larger and took it above every prior quarter in the five-quarter series.
- Ego retained a positive value gap without leading growth: Its 11.4% dollar share exceeded its 8.3% unit share by 3.1 points. Ryobi showed the reverse at 13.1% of dollars against 22.7% of units. Their positions underscore different price and mix strategies rather than a single premium-versus-value outcome.
OPE Brand Consideration & Close Rates
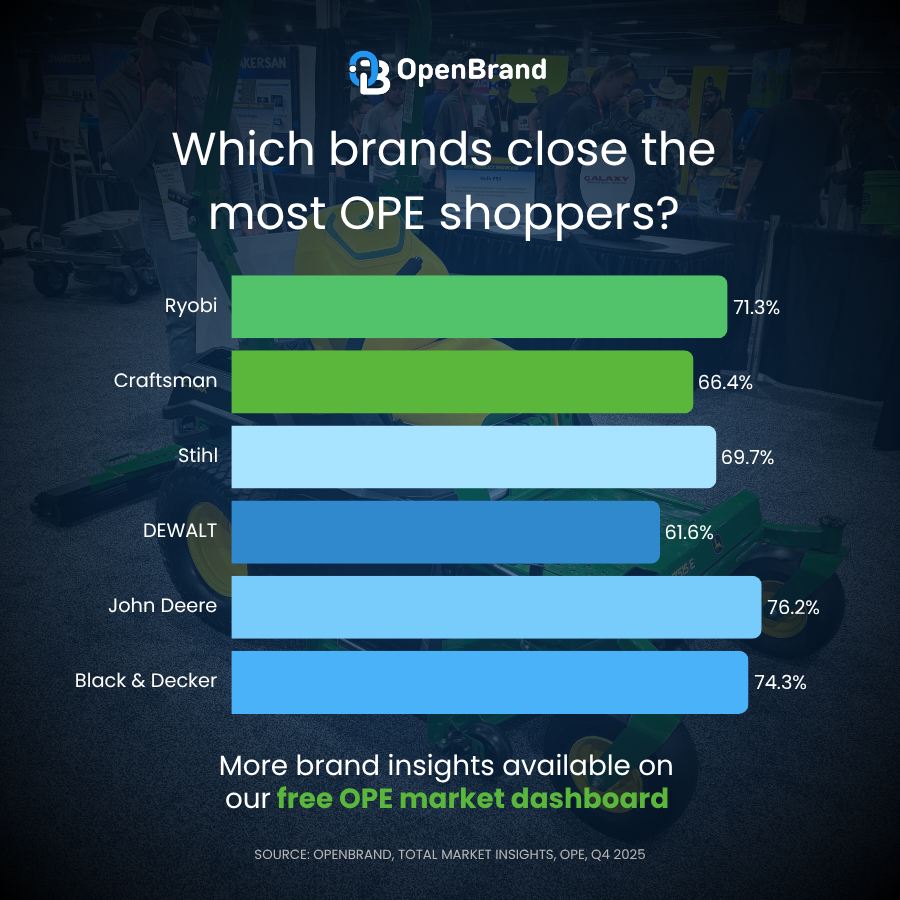
Among the outdoor power equipment brands shown below, OpenBrand’s Q2 MindShare data puts Ryobi first on consideration at 12.8%, while John Deere recorded the highest close rate at 76.2%. Craftsman’s 8.5% consideration and 66.4% close rate provide shopper context for its share gain, not a direct explanation of it.
| Brand | Q2 2026 Consideration | Q2 2026 Close Rate |
| Ryobi | 12.8% | 71.3% |
| Craftsman | 8.5% | 66.4% |
| Stihl | 7.6% | 69.7% |
| DEWALT | 7.5% | 61.6% |
| John Deere | 7.0% | 76.2% |
| Black & Decker | 6.6% | 74.3% |
OpenBrand’s OPE Market Trend Insights
The strongest close rate and the biggest share gain belonged to different brands. John Deere converted 76.2% of shoppers who considered it, while Craftsman led the unit-share increases in the separate ten-brand series. A line review needs both perspectives rather than treating survey close rate as a proxy for share momentum.
Ryobi’s walk rate was 28.7%. Among shoppers it lost, Ego won 16.6%, Black & Decker 14.5% and DEWALT 14.0%. Ego was the largest named destination, although the aggregated “Other Brands” bucket accounted for 49.2%. Ryobi’s share gain therefore coexisted with leakage to multiple competitors.
Outdoor Power Equipment Consumer Demographics
Homeowners represented 73.1% of Q2 OPE buyers, but renters still accounted for 25.0%, according to OpenBrand’s shopper insights data. Millennials remained the largest generation at 31.3%, followed by Gen X at 27.4%. These describe separate demographic cuts and should not be combined into an assumed buyer profile.
- Housing: 73.1% owned their home and 25.0% rented for cash payments.
- Marital status: 56.1% were married.
- Gender: Male purchasers accounted for 69.1%, compared with 30.9% female purchasers.
- Generation: Millennials accounted for 31.3% of purchases and Gen X for 27.4%.
OpenBrand’s OPE Consumer Trend Insights
The planning opportunity is broader than a generational headline. Baby Boomers represented 21.8% of buyers and Gen Z 18.0%, alongside a renter share of 25.0%. Those segments merit visibility in customer research, with follow-up analysis connecting demographics to equipment purchases and the spaces buyers maintain.Avoid equating renting with a small property or being younger with entry-price demand. Those are hypotheses for a demographic-by-product analysis, not conclusions from separate category-level percentages. The same caution applies to the 53.4% employed full-time and 17.9% retired shares: neither establishes professional equipment use.
OPE Purchase Drivers
Competitive price remained the leading reported reason for retailer choice at 44.2%, followed by product selection at 30.3%. According to OpenBrand’s Q2 survey, location mattered to 23.5% and previous store experience to 18.1%. These are multiple-response measures, so they are not shares of one mutually exclusive decision.Why consumers select a specific retailer:
- Competitive price: 44.2%.
- Good selection of products: 30.3%.
- Convenient location: 23.5%.
- Previous experience with store: 18.1%.
Price led selection by 13.9 points, making the combination more useful than a price-only reading. Retail buyers still need to test which products and price points are available together, rather than assuming a deeper promotion can compensate for an assortment gap. The survey identifies stated reasons, not the sales lift attributable to each factor.
How are online and in-store sales trending for the Outdoor Power Equipment market?
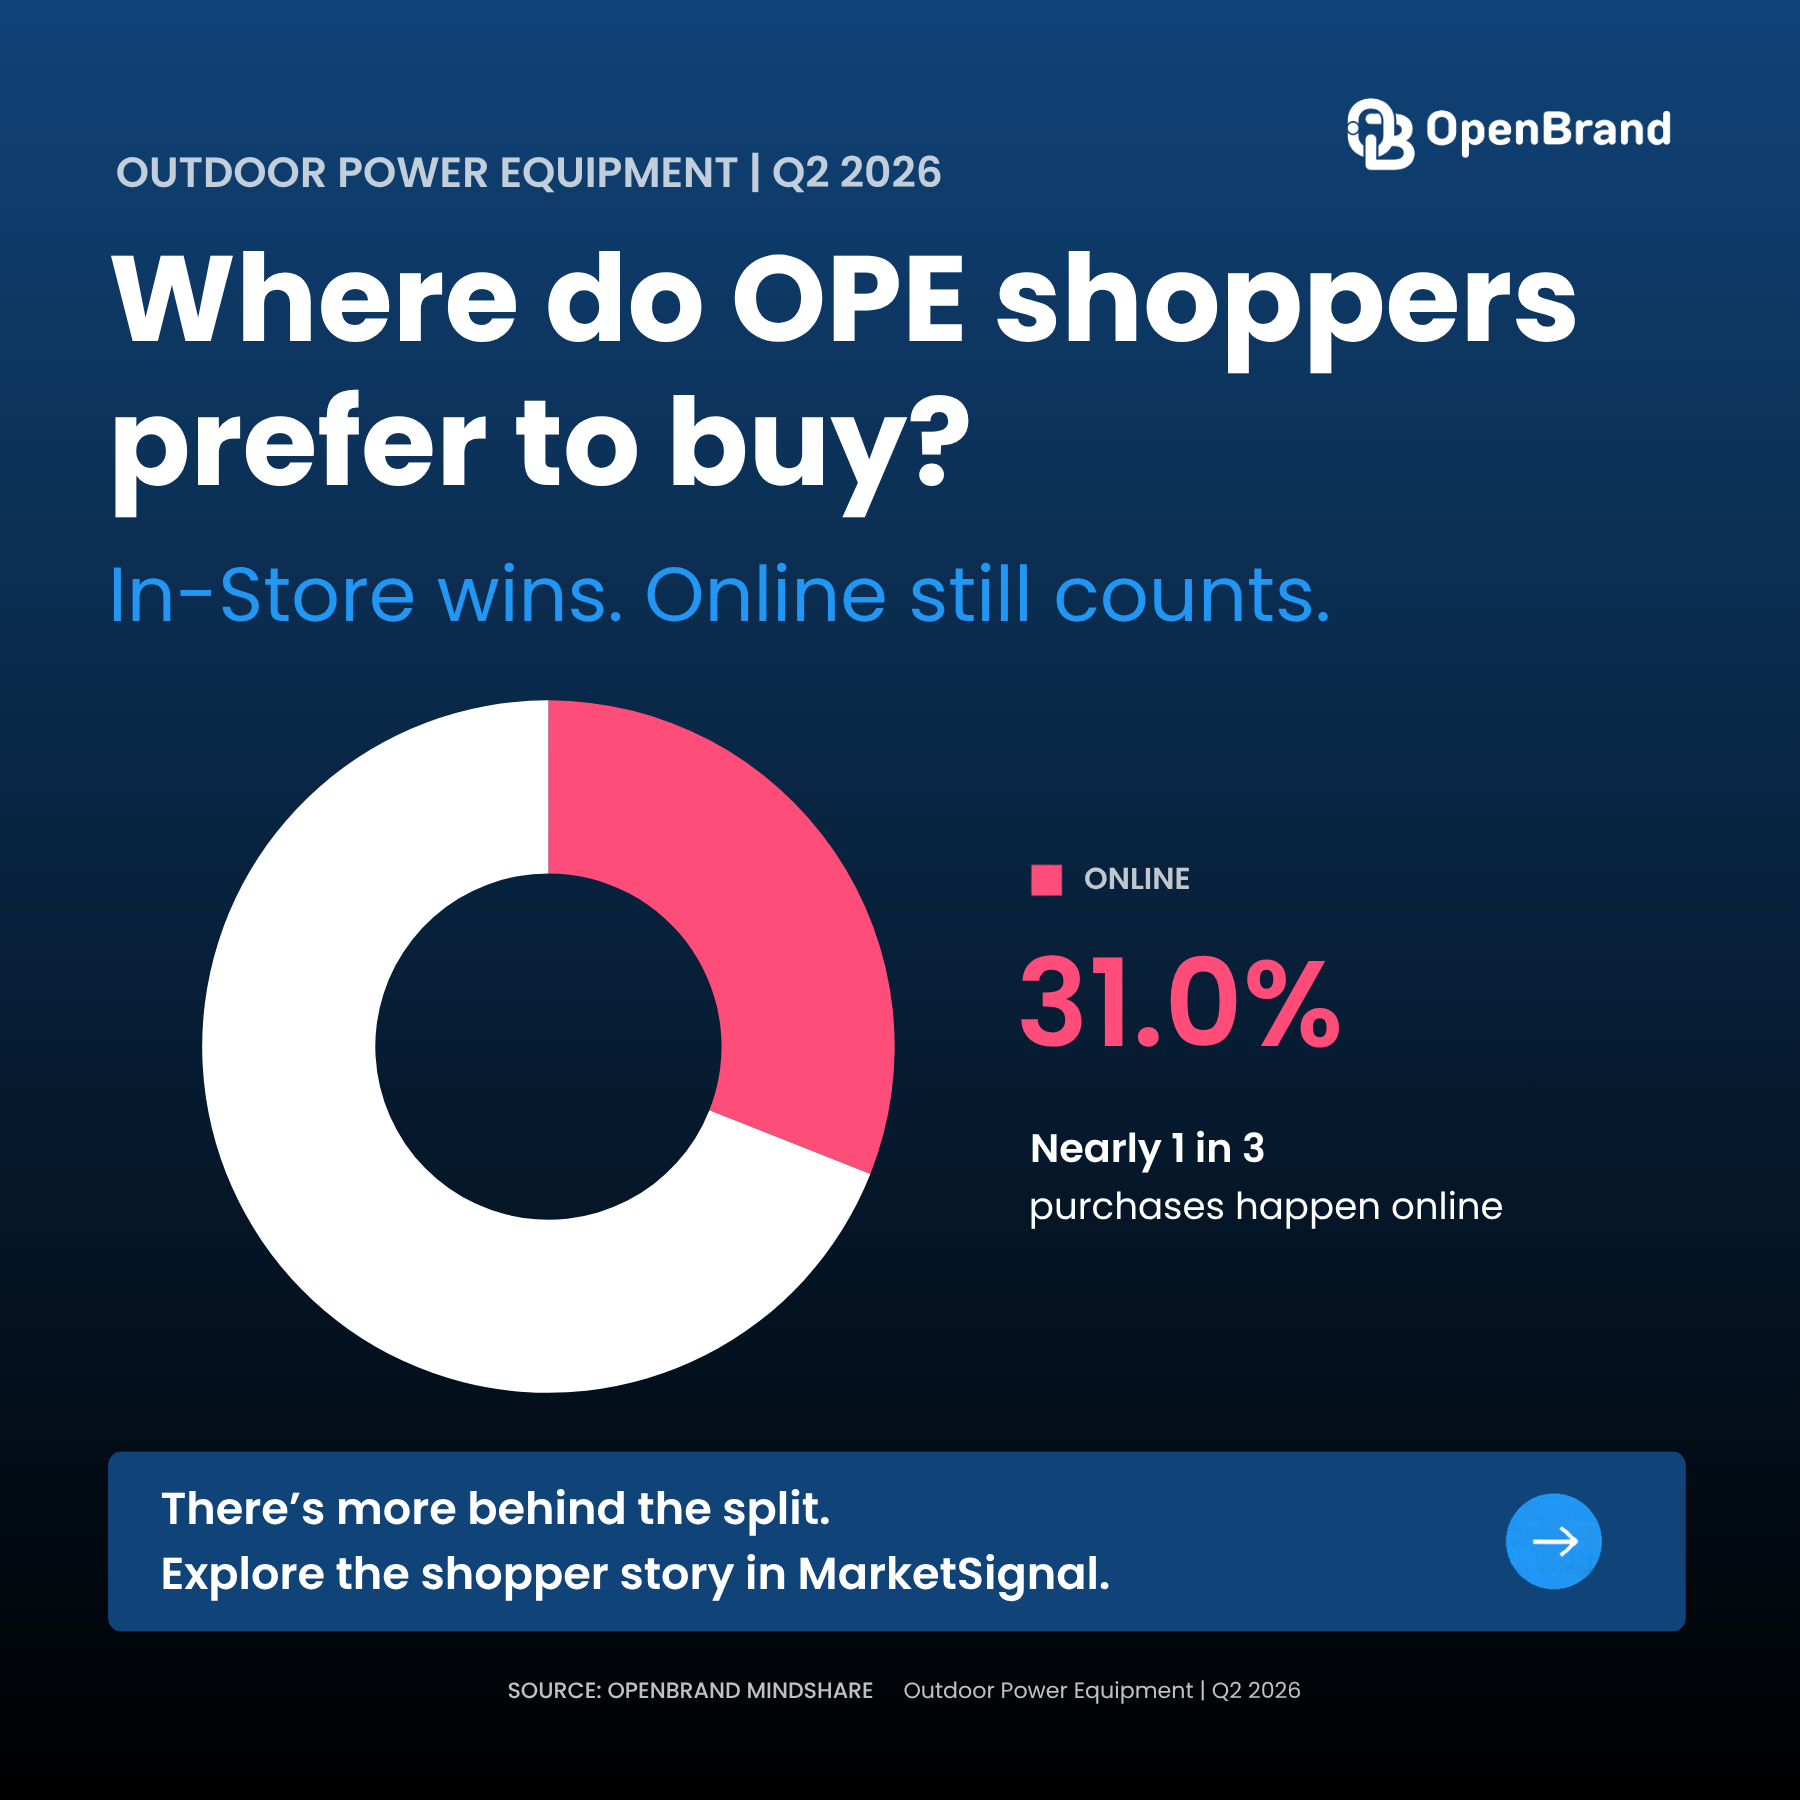
Physical stores accounted for 69.0% of Q2 OPE purchases, compared with 31.0% online, according to OpenBrand’s MindShare survey. That is a roughly two-to-one split, but it describes purchase channel rather than retailer share. Amazon’s position in the modeled panel cannot stand in for all online purchasing.
- In-store: 69.0% of purchases.
- Online: 31.0% of purchases.
OpenBrand’s OPE Channel Trend Insights
Amazon’s unit-share decline does not mean the category’s online channel contracted. The current survey puts online at 31.0%, while Amazon’s panel unit share fell 2.3 points. Consumers can also buy online from retailers with physical stores, so one account’s performance is not a channel-wide result.The useful distinction for brands is retailer versus channel performance. Investigate account-specific assortment, availability and price positioning before attributing a share loss to shoppers abandoning digital purchasing. A channel-by-product analysis would help establish whether larger equipment and smaller handhelds follow different purchasing patterns.
Key OPE Pricing and Promotions Insights
OpenBrand’s Q2 pricing series shows deeper discounts late in the reporting window, but not larger dollar promotions throughout. Average discount depth increased from 19.1% in week 15 to 23.3% in week 27. Meanwhile, the average promotion in that same series declined from $95.4 to $83.3.
- Discount percentage and promotion dollars moved differently: Discount depth peaked at 23.6% in week 26. Average promotion dollars peaked earlier at $98.3 in week 18 and reached their low of $41.8 in week 24. A deeper percentage discount did not necessarily mean a larger dollar saving.
- The net-price series also moved lower: Average net price fell from $795.8 in week 15 to $567.1 in week 27, reaching $347.3 in week 24. This is OpenBrand’s tracked pricing series, not the transaction-weighted average selling price calculated from panel sales.
- Lowe’s largest dollar promotions came early: Its average promotion ranged from $70.4 in week 23 to $163.0 in week 15. Brands reviewing Lowe’s dollar-share gain should examine that promotional timing alongside the products and price points promoted.
- New-product visibility favored Ryobi: Ryobi accounted for 7.1% of debut share of shelf, ahead of Greenworks at 6.3% and DEWALT at 4.9%. These are assortment-debut measures, not unit sales or market-share gains.
- Handhelds led the new-product mix: The product-type debut breakdown was 56.2% handhelds, 22.8% mowers, 15.8% pressure washers and 5.2% snow throwers. It describes the composition of new-product assortment and must not be presented as the mix of equipment purchased.
Review the pricing and promotional views in the OPE dashboard for more insight into OPE competitive intelligence in Q2.
OPE Industry Outlook and Emerging Trends
The Q2 evidence points to a contracting retailer panel with meaningful competitive gains inside it, rather than a uniform premium-growth story. OpenBrand’s sales totals show units down 16.9% and dollars down 17.5% year over year, while Craftsman, Ryobi and selected retailers improved their relative positions.What should brands and retail buyers watch through the rest of 2026?
- Separate relative wins from absolute growth: Panel sales imply an average selling price of $306.1, down 0.7% from Q2 2025. With dollars declining slightly faster than units, higher average selling prices did not cushion the year-over-year volume decline.
- Treat the home centers as different account opportunities: Home Depot and Lowe’s together captured 63.7% of panel units. Home Depot led on shopper draw and close, while Lowe’s came within 1.2 points in dollar share.
- Put Craftsman’s gain on the line-review agenda: Its 10.8% unit share and three entries among the ten SKU leaders make assortment-level analysis more useful than repeating the previous quarter’s Ego-led narrative.
- Watch the Amazon-Walmart unit race: The remaining gap was only 0.5 points. Compare account execution without assuming that share moved directly between those retailers or that all Amazon sales represent the online market.
- Keep product debuts separate from demand: Handhelds led the launch mix at 56.2%, but the supplied data does not quantify their share of sales. New assortment and actual purchase behavior should be evaluated side by side.
Get more insight into Outdoor Power Equipment market trends
Craftsman’s share gain, Lowe’s dollar position and the narrowing Amazon-Walmart gap call for different follow-up questions. The Outdoor Power Equipment MarketSignal dashboard connects brand and retailer share with shopper conversion, leakage, pricing and assortment evidence so teams can investigate those differences.
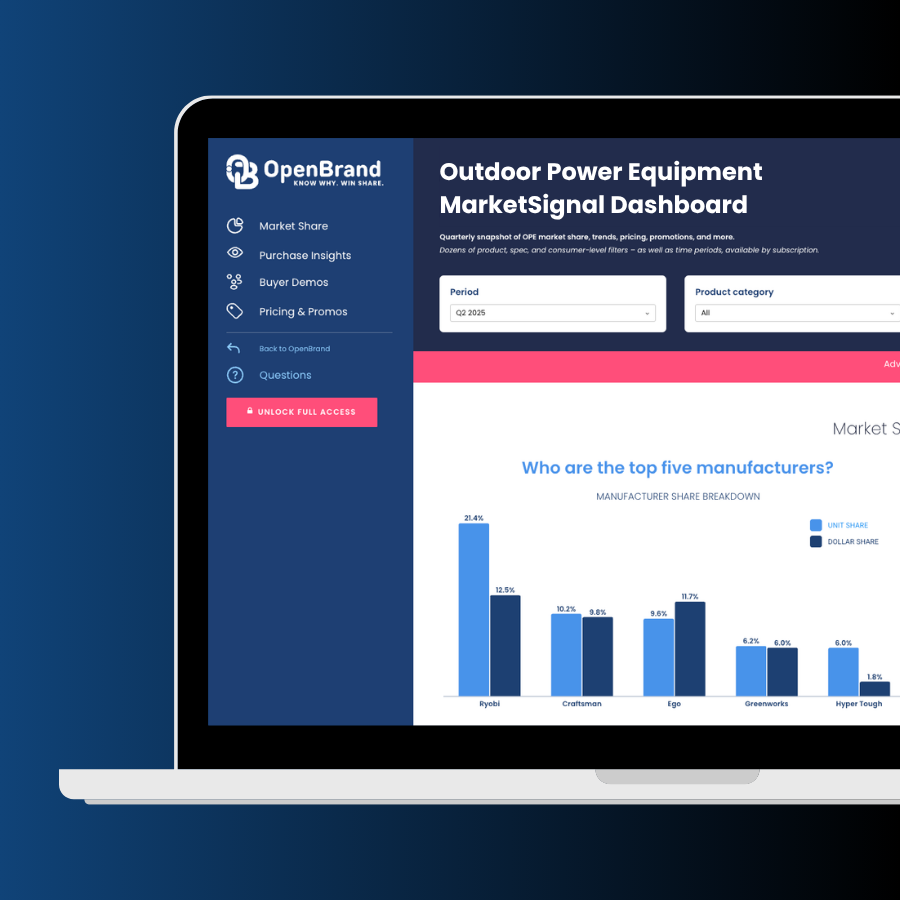
Want to see the data for a specific brand, product category, retailer, or timeframe? Contact OpenBrand to see how we can support your data needs.
FAQs: Outdoor Power Equipment Market Share
Who has the highest market share in the Outdoor Power Equipment category?
Home Depot led the seven-retailer panel in Q2 2026 with 37.1% unit share and 35.0% dollar share, according to OpenBrand. Ryobi topped the brand rankings shown in this article at 22.7% of units and 13.1% of dollars. These share results are distinct from the broader consumer survey’s consideration and close-rate measures.
Which OPE brand gained the most unit share in Q2 2026?
Craftsman posted the largest increase among the ten brands in OpenBrand’s historical series, gaining 2.1 percentage points to reach 10.8%. Ryobi followed with a 1.6-point increase, while Milwaukee gained 0.9 points. These are changes in relative share, not each brand’s percentage sales growth.
Which OPE brand had the strongest close rate?
John Deere had the highest close rate among the six brands in OpenBrand’s Q2 draw-and-close table at 76.2%. Black & Decker followed at 74.3%. John Deere’s consideration rate was 7.0%, illustrating why efficient conversion and broad shopper reach need to be assessed separately.
What percentage of OPE purchases happened online?
OpenBrand’s Q2 MindShare survey puts online purchases at 31.0% and in-store purchases at 69.0%. Those channel figures cover more than Amazon alone. They establish where shoppers purchased, not whether online buyers spent less or selected different equipment than customers shopping in physical stores.
What most influenced where consumers bought OPE?
Competitive price was cited by 44.2% of shoppers, product selection by 30.3%, convenient location by 23.5%, and previous store experience by 18.1% in OpenBrand’s Q2 survey. Respondents could select multiple reasons, so the percentages should not be added together or interpreted as mutually exclusive choices.
