


In today’s hyper-competitive retail environment, actionable data is the lifeblood of strategic decision-making. Whether it’s understanding customer behavior, tracking product performance, or adapting to market trends, businesses need tools that provide fast, accurate, and comprehensive insights.
Why Traditional Retail Data Methods Fall Short
While online data collection is prevalent, DIY and other solutions lack granularity, accuracy, and completeness. They introduce costly gaps in matching and categorization.
Here are a few ways legacy approaches fail to meet retailer and brand current demands.
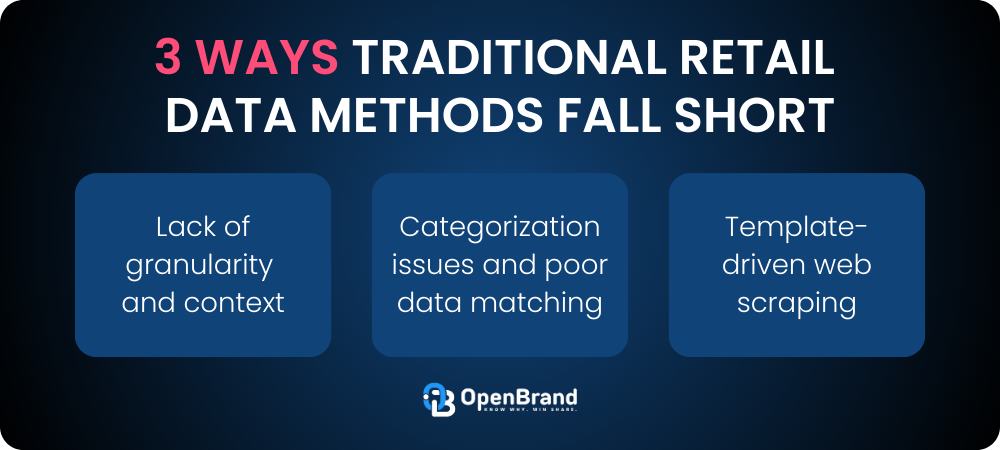
1. Lack of granularity and context: Conventional providers typically offer category-level or retailer-level data. Slicing down to niche product attributes, usage segments, or subcategories often proves impossible. As a result, businesses struggle to:
- Identify competitive pricing and promotions at a SKU level rather than broad category averages.
- Distinguish online and store-level variations in pricing and availability.
- Track emerging consumer trends tied to specific product features or attributes.
2. Categorization issues and poor data matching: One of the biggest pitfalls of traditional methods is poor data structuring. Many systems struggle with:
- Inconsistent product categorization leading to mismatched or misclassified items.
- Duplicate product entries caused by variations in naming conventions, packaging, or regional differences.
- Inaccurate price tracking, especially when dealing with complex pricing structures such as bulk discounts, subscription pricing, or bundled offers.
3. Template-driven web scraping: Most retail data platforms still rely on rigid, template-driven web scraping or manual data entry. These methods introduce severe limitations:
- Retailer-specific templates break frequently, requiring constant maintenance.
- New retailers and product categories take weeks or months to onboard.
- Data extraction lags behind market shifts, making insights obsolete before they can be acted upon.
The Future of Retail Intelligence: AI + Optical Processing
At OpenBrand, we’ve redefined what’s possible in retail data collection and analysis. By leveraging a unique combination of AI-driven data extraction, deep product taxonomies, and transaction integrations, OpenBrand provides a real-time, high-fidelity view of market share and competitive positioning at a fraction of the cost of legacy point-of-sale (POS) providers.
Why does this matter? By increasing efficiency and accuracy, OpenBrand empowers businesses to make faster, smarter decisions—leading to measurable ROI and a significant competitive edge. Here’s what our customers experience:
Faster Retailer Onboarding
From 6–8 weeks down to under 7 days
Accuracy You Can Trust
95–97% accuracy in complex categories
Out-of-Stock Reduction
12% improvement for tire category client
Increased Processing Speed
Optical processing parses pages 2–3x faster than template-based systems
ROI & Revenue Growth
Client reports a 20–25% boost in category revenue within 3 months
Cost Efficiency
40% reduction in analytics spend vs. traditional POS
This article explores how OpenBrand’s technology transforms the way retailers and manufacturers understand and act on their data, with a focus on customer success, scalability, and the future of retail intelligence. Read on for an in-depth look at the 3 ways that OpenBrand is revolutionizing retail intelligence
- Optical Processing: The Core of OpenBrand’s Retail Intelligence
- The Category Creation Flywheel: Building the Future, One Category at a Time
- AI-Powered Product Matching and Monitoring: A 360 Degree View of Retail Data
Optical Processing: The Core of OpenBrand’s Retail Intelligence
Web scraping has long been a standard method for data collection, but its limitations—fragility, lack of context, and inability to capture dynamic pricing and promotions—make it unreliable and is now often seen as a commodity. Ultimately, customers need both accuracy and speed. There’s a common belief that you can have one or the other but not both. We’ve built a solution that proves otherwise.
Why Optical Processing Matters
Optical processing sets OpenBrand apart in the competitive landscape. Our ability to rapidly adapt to new retailers and categories means our customers can act on real-time insights faster than ever. In industries where speed is critical – like semiconductors, where supply chains and geopolitical pressures are evolving rapidly – this is a step function.
OpenBrand’s optical processing technology is the foundation of our product. Unlike traditional web scraping methods that rely on predefined templates, optical processing allows our system to interpret and structure unstructured data in a human-like manner. With Optical processing, what you see is what you get.
Key Features of OpenBrand’s Optical Processing
- Template-Free Efficiency: Our algorithm doesn’t require page-specific templates, enabling us to onboard new retailers in hours or days rather than weeks or months. It doesn’t matter when a retailer changes a page, our technology adapts and doesn’t break.
- For example, we support hundreds of domestic and international retailers, even those with highly complex or non-standard page layouts.
- Human-Like Understanding: If a page displays a price as “12 payments of $100,” our algorithm understands and records it as $1,200—just as a human would.
- Complex Category Mastery: Categories with minimal taxonomy, such as tires or semiconductors, are no challenge for our system. Our optical processing extracts and organizes the data with unparalleled accuracy.
Optical Processing Example: Legacy vs. OpenBrand Approach
We’ll review a vacuum example to illustrate the difference between legacy and our approach.
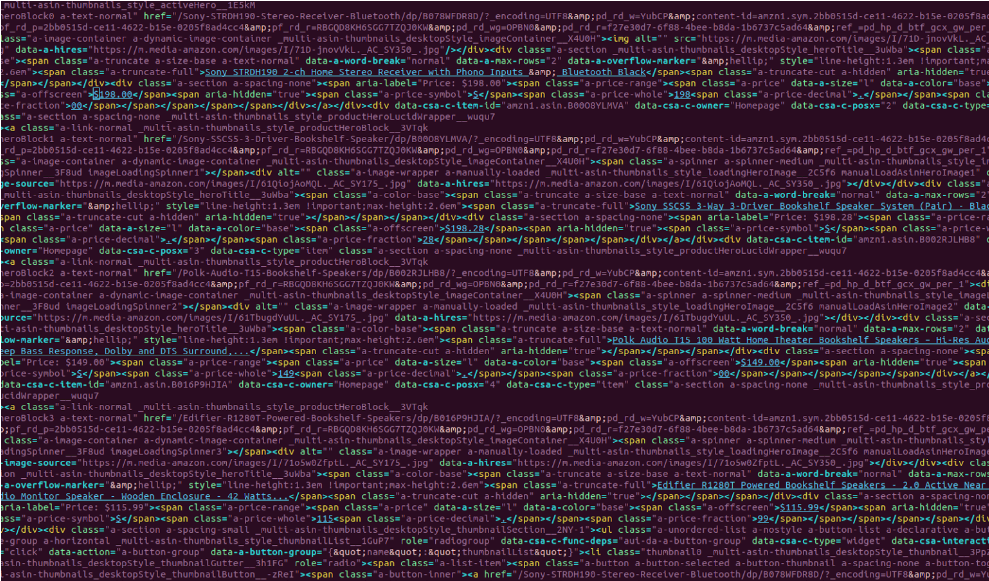
Legacy Approach: Traditional web scraping methods programmatically navigate the web, parse HTML, and retrieve structured information. Traditional web scraping methods rely on a series of steps to access and collect this data, but they are highly vulnerable to source code changes, dynamic content, and anti-scraping measures.
The image below shows code that legacy approaches monitor changes for specific variables like code updated, element removed, and new structure detected.
OpenBrand Approach: We account for all the combinations that exist on online websites. Things that are changing and being added all the time. This allows for clean, accurate, and consistent reporting for our customers. OpenBrand has decades of consistent experience in parsing all those complicated cases down into simple metrics for your business. We’ll review a few examples.
This example shows complicated prices and promotions (coupons, discounts, memberships, shipping, and product variants). Optical processing reviews full pages and accounts for all these nuances across many different page layouts. These elements are usually missed in legacy approaches.
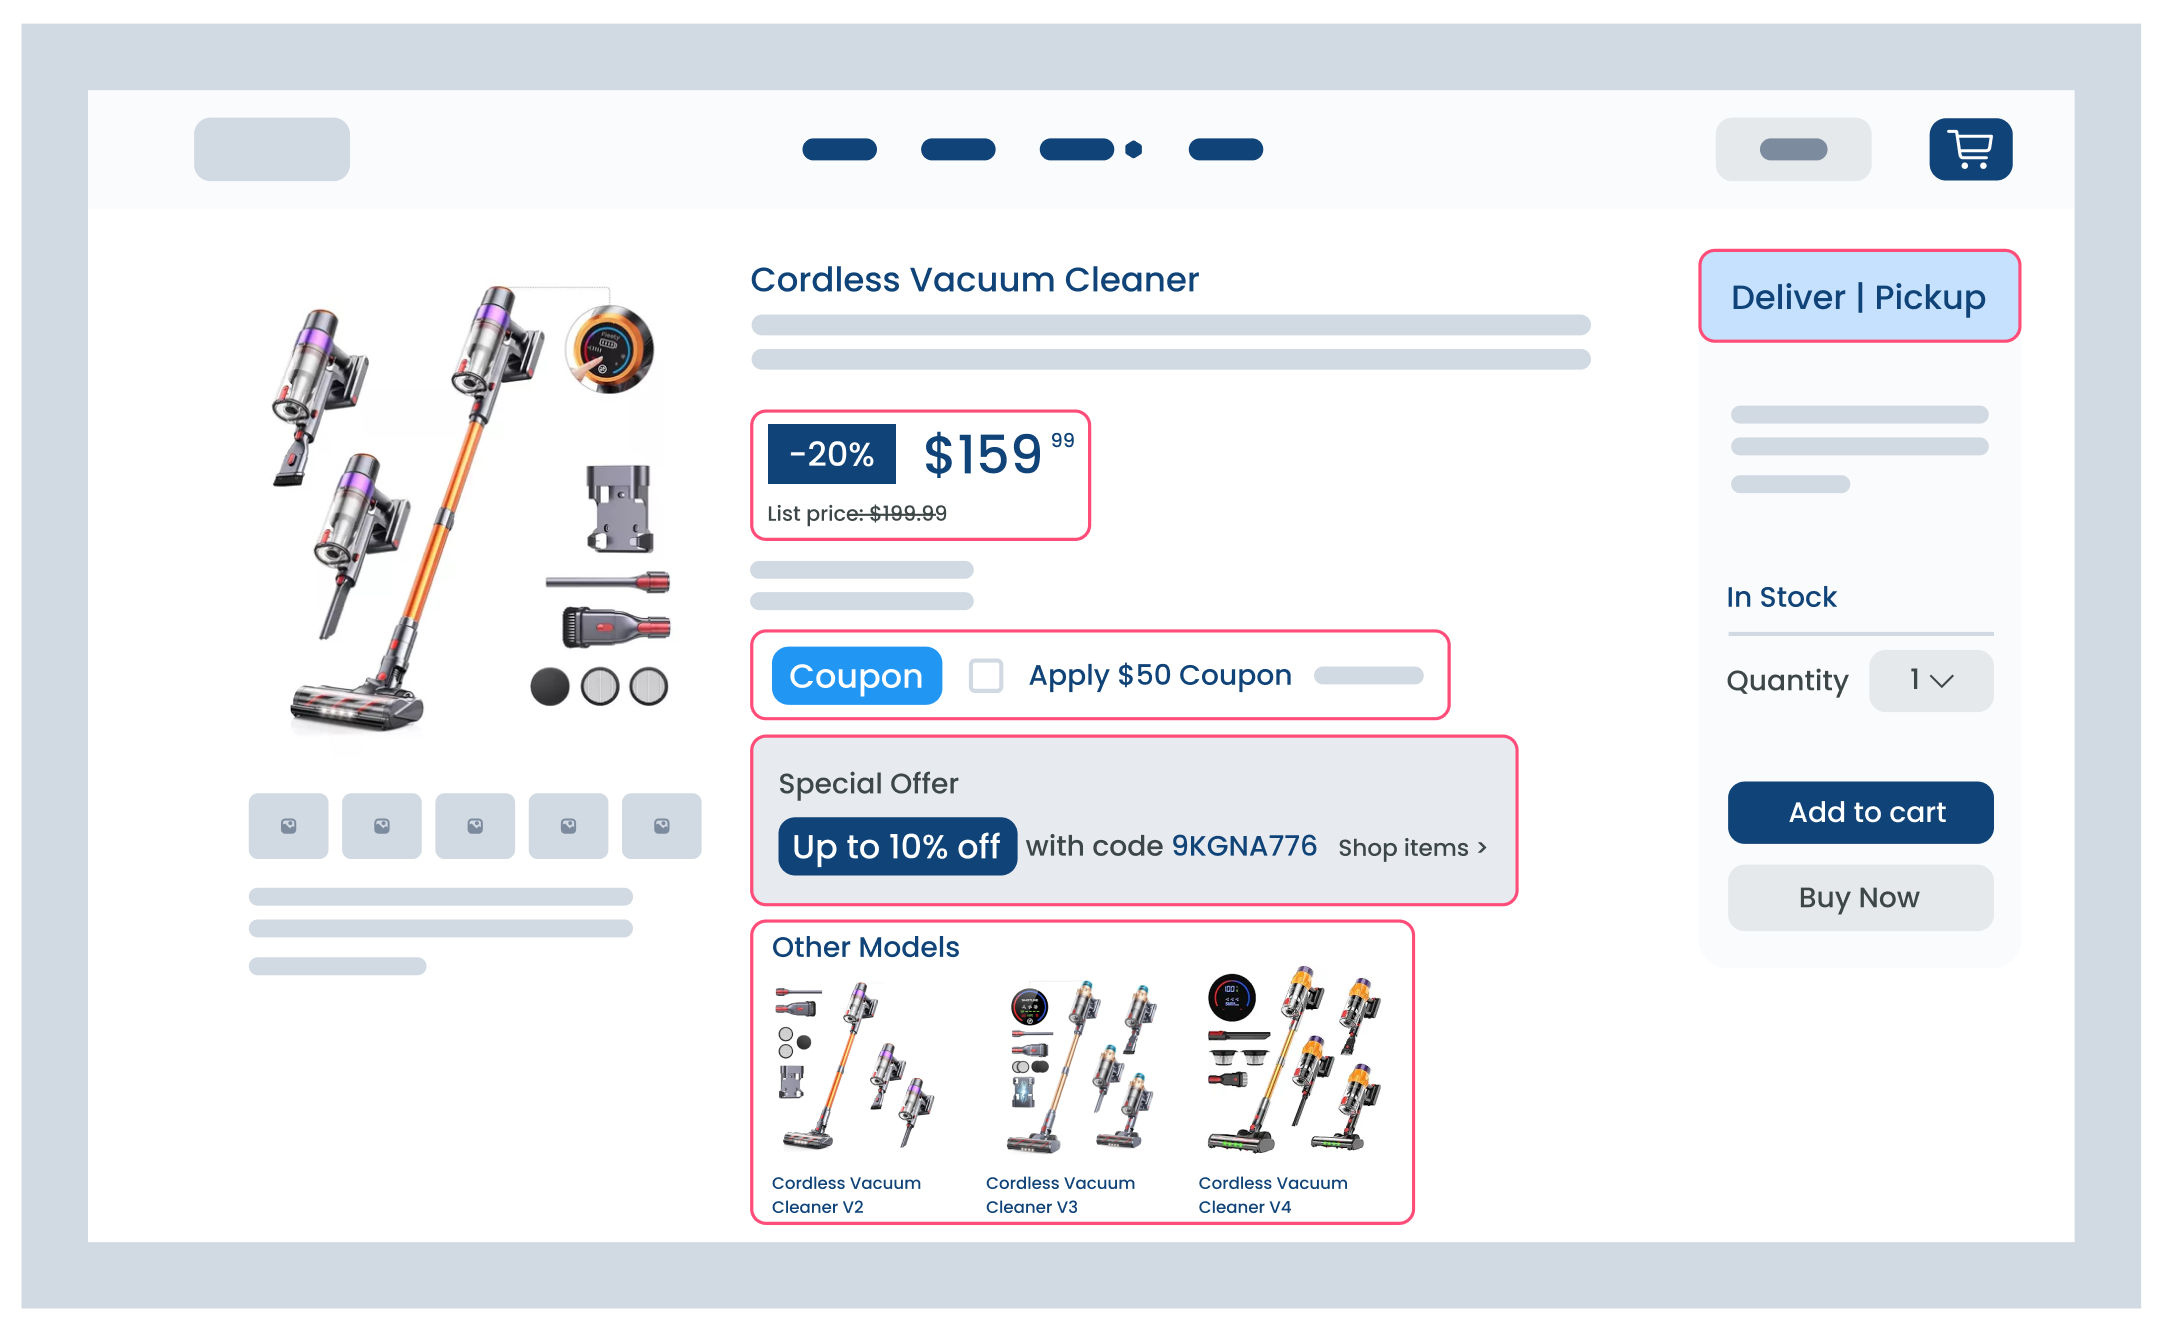
This example shows an item with a discount and marked on clearance, but the only one identified that this item is on clearance is the image. The clearance variable is not in the code. The legacy approach would not account for this and pick it up. OpenBrand’s optical processing can pick this up and ensure that what you see on the page is what you get in the data.

This example shows a complex combination that offers multiple options for delivery (in-store pickup, shipping, delivery). It shows stock levels in-store, but this data will change as you change stores or select check other stores. This is accounted for and accurate with our approach.
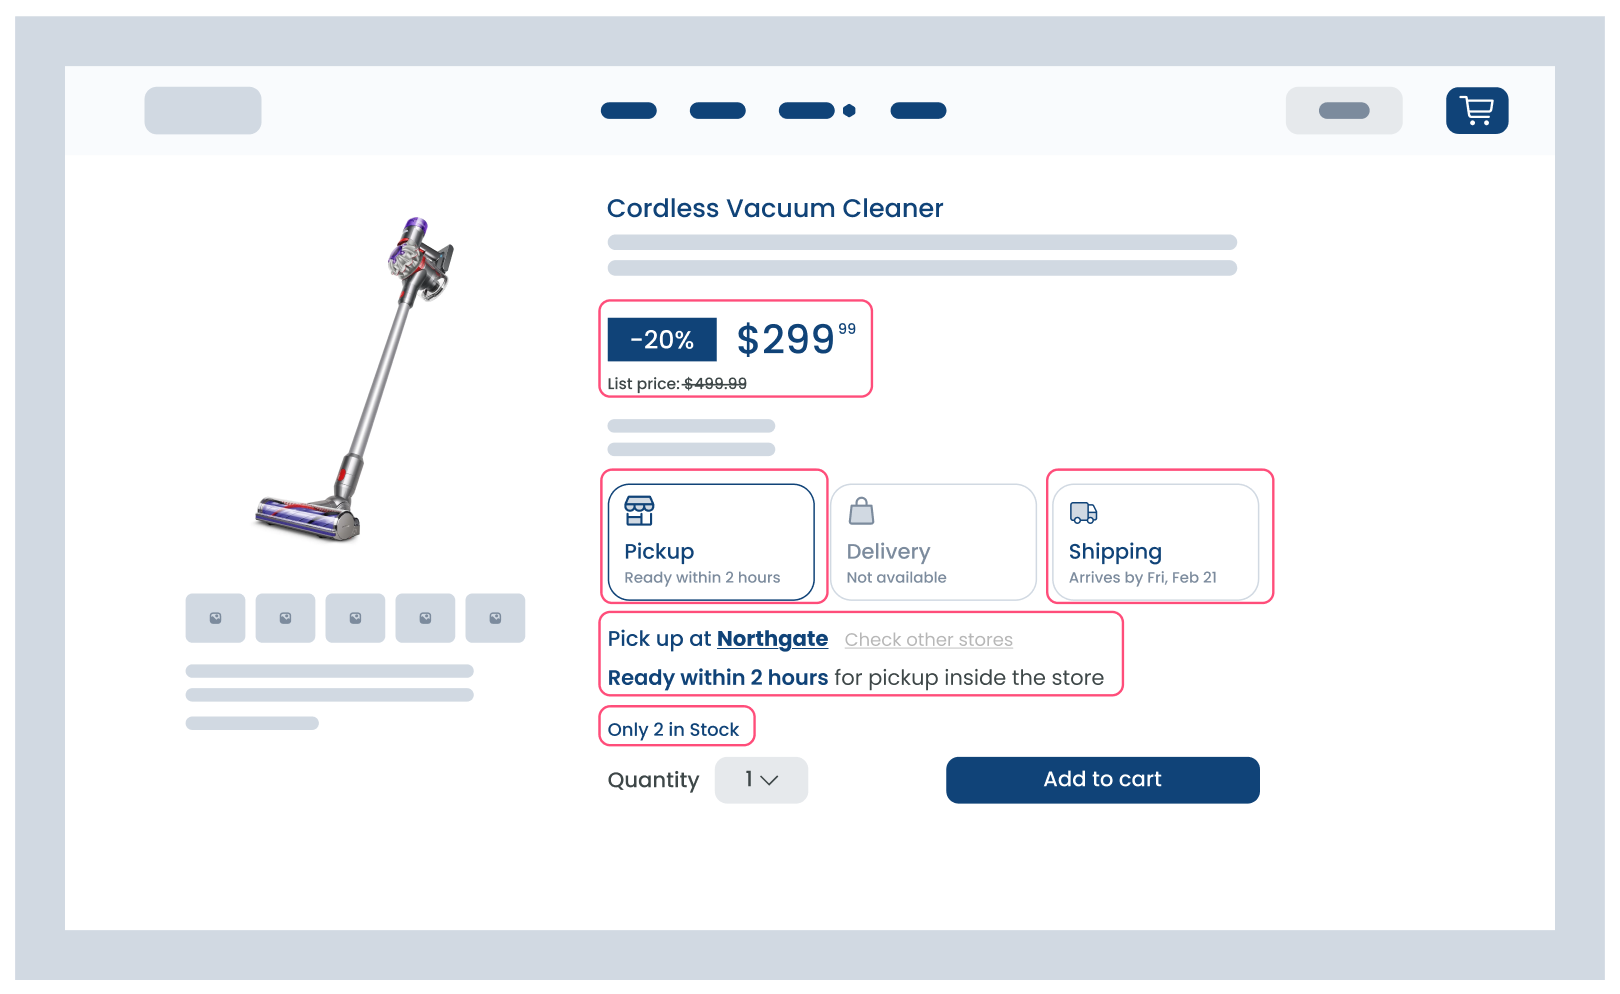
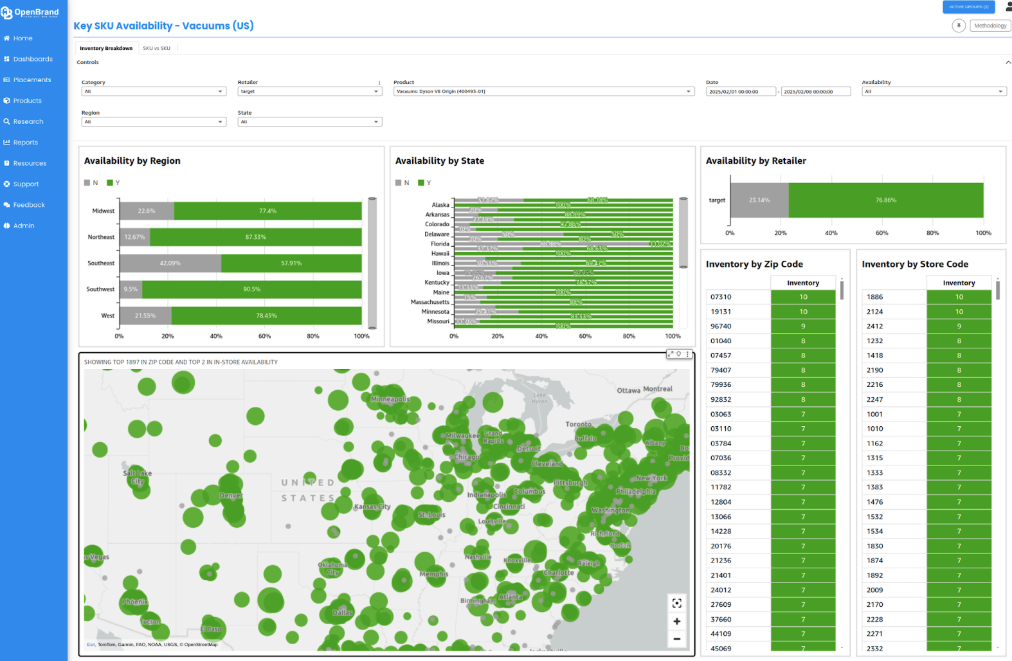
Traditional methods fail to capture nuanced pricing signals—whether it’s a bundle discount, regional variance, or a clearance tag missing from the HTML structure. Our optical processing bridges this gap. Take, for example, vacuum cleaners: retailers adjust pricing dynamically based on inventory and promotions. With OpenBrand, our clients get an immediate, precise view of these changes. Below is an example dashboard that showcases the live output of the action.
The Category Creation Flywheel: Building the Future, One Category at a Time
Extracting data is only the first step. To make this data actionable, we’ve built a systematic approach to category creation that ensures every dataset is structured, consistent, and insightful.
We don’t just collect data; we define the framework in which data operates. Our category creation flywheel ensures every new category added to our platform is complete, accurate, and aligned with customer needs.
We’ve gone through many iterations and spent tremendous time building out the most efficient processing to have the best product. We’ve decided to open-source a component of the optical processing called the DAR schema. It provides a richer and more complete view of the data collection process. The concept is similar to taking a high-definition recording of a web collection.
A Comprehensive 32-Stage Pipeline Delivers Industry-Leading Accuracy
Our 32-stage pipeline ensures that category creation is systematic, scalable, and robust. Each stage contributes to the final goal: a comprehensive, industry-standard dataset that our clients can trust. Key stages include:
- Definition: Establishing the scope of the category, along with detailed attributes.
- Methodology: Developing the data collection and taxonomy strategy to ensure completeness.
- Collection: Harvesting data from online sources and integrating it with transaction streams like receipts, e-receipts, clickstream data, and survey responses.
- Quality Control: Employing AI models and human analysts to validate data accuracy.
For the definition and methodology, we leverage our category-specific experts to ensure we create the taxonomy structure to produce a detailed product specification that is the foundation of the data structure for each category. Below is a vacuum example product specification.
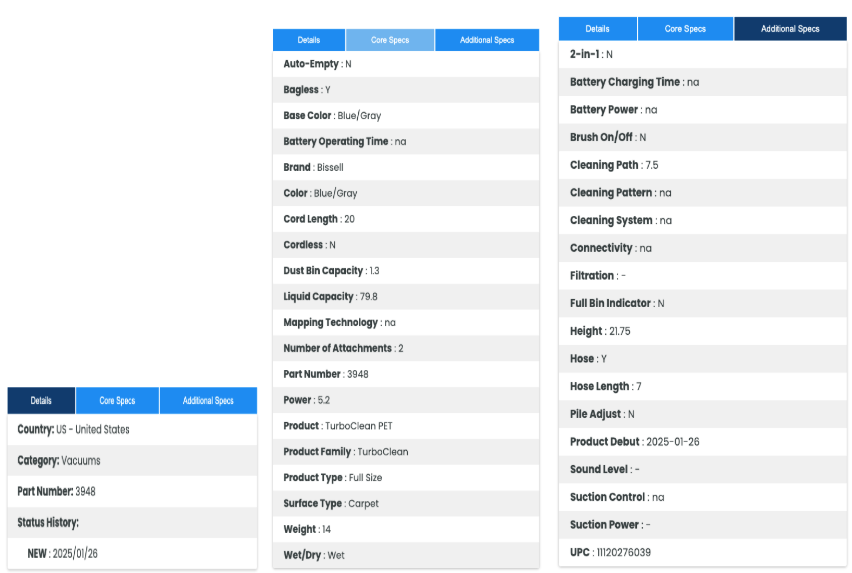
In the collection stage, we deploy our optical processing to collect and categorize all products and attributes. Our AI models take this information and organize, tag, and ensure the data is in the defined taxonomy structure. The models flag for human validation when needed, and our QA team and category analysts review and validate data in the QA process to ensure each category has the highest accuracy rate.
The flywheel and optical processing allows us to create new categories at impressive, industry-leading speed. The team leverages our MindShare data to understand which products and brands people buy and why. We leverage this data to create detailed, rich taxonomies and use our own data cleaning layer to ensure we normalize the data so there are no errors from merchants and our customers have a clean data set. The collection process is exhaustive.
AI-Powered Product Matching and Monitoring: A 360 Degree View of Retail Data
With millions of products sold across multiple channels, inconsistencies in product naming, UPC variations, and merchant-uploaded errors make product tracking incredibly complex. OpenBrand’s AI-powered matching eliminates these gaps, ensuring a 360° view of market activity.
The ability to track, map, and monitor products across channels is a cornerstone of our offering. By integrating advanced AI with in-store and online data collection, we deliver a comprehensive view of the market.
When a new product is launched, we already have the data in our tagging system. We go the extra mile to get product information early, before competitors, the government, and sometimes even our customers. Understanding the products gives us a significant edge because we can flag a merchant debut fast when using our optical processing.
What happens when there are brand-new products? The product gets flagged, scrutinized, and captured, and we alert all our clients in weekly new product announcements and feature them in our weekly analyst videos.
Product Matching and Mapping
When you’re matching millions of receipts, the barcode isn’t enough. You have to get into all the various details and imperfections in how the data gets transcribed and uploaded.
Our system uses UPCs, part numbers, attributes, naming conventions, and images to create accurate product matches.
Having a gigantic visual library of placements, product information, and barcodes (UPC, or GTIN, or GTIN13) is a competitive advantage. It means we can be more accurate, do more research, and have more evidence when we’re helping our clients.
Clients can also define custom rules to prioritize what matters most to them. In cases where data is incomplete or ambiguous, analysts can override matches using our soft mapping process, ensuring precision even in challenging scenarios.
In-Store Observations
OpenBrand works with thousands of observers who capture weekly images of in-store shelves in key markets. These observers have been vetted and trained on our process to ensure that high-quality images and data are reported correctly.
Here’s a brief overview of the weekly process:

This data is processed by our PanelBot, which:
- Extracts product information using optical processing
- Verifies prices and product details against our internal database
- Flags anomalies for human quality control
Instead of customers sending in employees or contracting in-store shops at a much lower scale, they can leverage our data to have their eyes in-store. Here’s an example of in-store pictures you can view on our platform.
Viral Video Monitoring
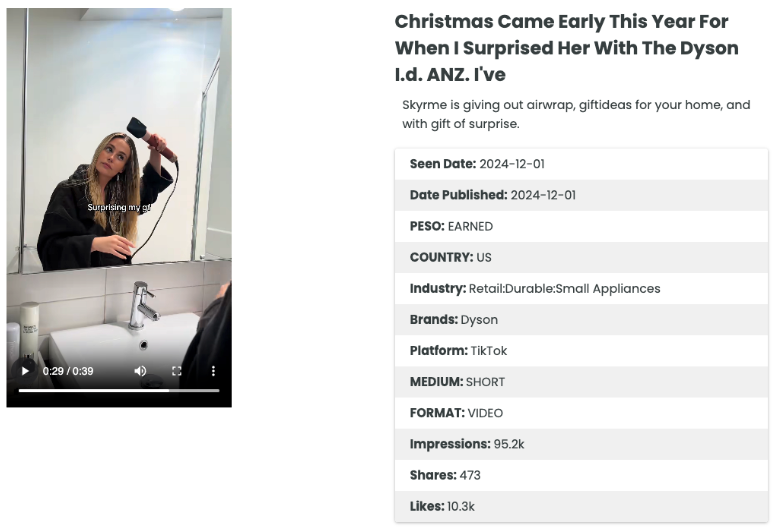
With the rise of platforms like TikTok and YouTube Shorts, OpenBrand has expanded its monitoring capabilities to viral videos. We deploy our matching technology to find the products in the clips, not just hashtags or tagged brands. This can be a product shown in the video, mentioned in the audio, or written on the screen. We parse massive data sets to find the media that is the hardest to measure and quantify (earned media).
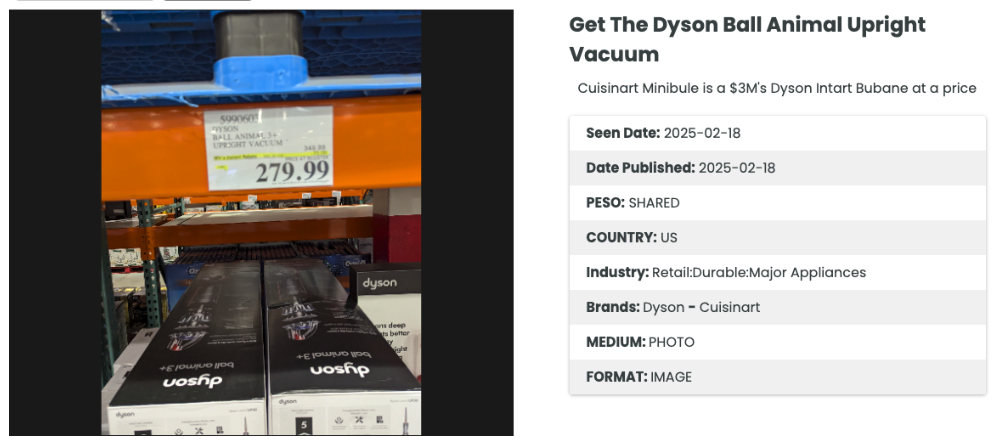
PanelBot identifies and tags products featured in videos, cross-referencing them with our database. New products are flagged for QC, ensuring our clients stay ahead of emerging trends and consumer behavior. Below is an example of a TikTok video featuring a Dyson product in our media library.
Human Validation
After PanelBot AI processes data, it enters an additional layer of human oversight and validation. Our team of category expert analysts is a key differentiator since they understand category specifics and nuances better than anyone. This is a critical piece of the equation for category validation and insight extraction, which ensures our data is accurate.
For clients, this means real-time visibility into in-store product placement, pricing trends, and competitive activity.
Real Customer Examples: Our Process in Action
Tackling Complexity with Tires
Tires are a notoriously challenging category due to limited taxonomies and inconsistent data. OpenBrand used optical collection and AI processing as a part of our category creation flywheel to:
- Define attributes like tread patterns and sizes
- Extract and map data across multiple retailers
- Deliver actionable insights that improved client pricing strategies and inventory management
- Provide partners an always-on pulse of the competition’s assortment and digital shelf strategies
- Enable real-time insights to fuel business growth within the tire industry
The team delivers a production dataset within 3 weeks. This success story highlights OpenBrand’s ability to handle even the most complex categories with speed and precision. OpenBrand’s ability to build new category segments while juggling numerous priorities is remarkable.
Here’s an example dashboard below.


New Market, New Category Creation
A customer entered a new market without prior data, relying on OpenBrand to map the category from scratch. The customer needed to understand the current landscape of the market and identify effective ways to break into the market that would drive revenue.
Their product, a component part embedded within other products, required detailed attribute mapping and product alignment. OpenBrand assisted the customer with:
- Mapping all products and their attributes
- Identifying which products were successfully aligning with clickstream data and which were not
- Data analysis to inform their assortment strategy to fill gaps in the channel, leading to optimized product offerings and increased performance
This demonstrates the power of our approach, which helps create robust category definitions and enables customers to make actionable decisions quickly and effectively.
The Future of Retail Intelligence
OpenBrand is designed to handle rapid increases in data volume and new category demands, thanks to a combination of advanced AI and a robust operational framework.
Key Scalability Factors
- Dedicated Teams: Our dedicated operations and DevOps teams ensure the system scales seamlessly as customer demands grow.
- AI-Driven Insights: Expert systems and customer surveys provide the necessary context for tackling complex categories and scaling our technology efficiently.
- Adaptable Processes: The category creation flywheel is flexible enough to handle rapid expansions while maintaining quality and accuracy.
From optical processing to the category creation flywheel, we deliver a holistic approach to retail data. But the value of any data product depends on more than just the numbers, it’s about how the data is captured, structured, and applied. Businesses must ensure their data comes from a reliable, transparent process to make the best decisions.
We covered how we are revolutionizing retail competitive intelligence data aggregation to deliver the best market share estimates in the world. We’ll cover how we do that in a future deep-dive article.
In an age where market share can shift overnight due to social media or a new product launch, brands need a partner capable of delivering accurate, dynamic, and actionable intelligence. For 20 years, OpenBrand has continually raised the bar to deliver a true 360° view of the retail landscape, making us the most trusted partner for the world’s leading retailers and manufacturers.
From power tools and home appliances to consumer electronics and semiconductors, our system scales effortlessly into new categories with the help of an engaged community of brand and retailer partners. The result? Real-time, hyper-granular market share insights that help you outmaneuver competitors and seize opportunities faster.
Get Unmatched Market Intelligence for YOUR Business
Want to see the insights available for your brand?
Have a specific data request you’re interested in diving into with our team?
Connect with our team below
ABOUT THE AUTHOR
