The second quarter of 2025 reinforced the rapid transformation underway in the U.S. major-appliance market, as consumer behaviour, channel disruption and brand positioning all accelerate. While traditional big-box retail remains influential, the rise of online and omnichannel models is gaining momentum and intensifying competition.
At the same time, the industry is navigating a fresh wave of trade- and tariff-driven headwinds — from rising input costs tied to steel and aluminium duties to altered sourcing strategies — creating a new strategic divide between market leaders with scale and agility, and challengers still reacting to the shifts.
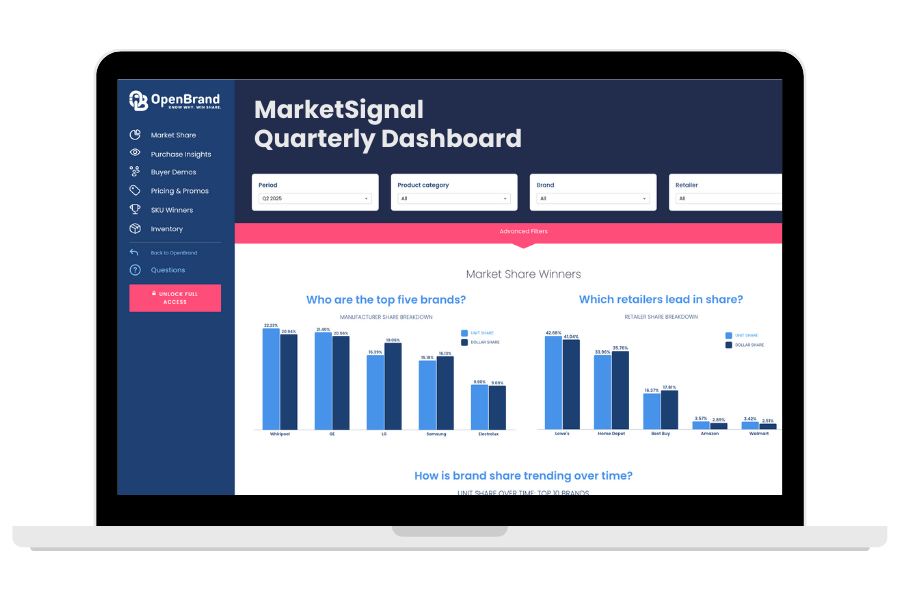
Our public MarketSignal dashboard highlights how these industry shifts are impacting the market, offering an interactive look at retailer performance, brand share shifts, pricing dynamics, and evolving consumer behavior.
Keep reading for Q2 2025 highlights, or jump into the dashboard to explore the latest data firsthand.
SOURCE: All data insights in this article covers Q2 2025 data within the OpenBrand Market Measurement suite. This category covers an aggregate of several products including Refrigerator, Clothes Washer, Clothes Dryer, Dishwasher, Freezer, Free-Standing Range, Cooktop, Wall Oven, Compact Refrigerator, and Built-In Range.
Who are the top major appliances retailers by market share?
In Q2 2025, Lowe’s and Home Depot remain the undisputed leaders in major appliance sales, topping both unit and dollar share.
Q2 2025 Major Appliances Retailer Unit Share Winners
| Major Appliance Retailer | Q1 2025 Unit Share | Q2 2025 Unit Share |
| Lowe’s | 43% | 41% |
| Home Depot | 34% | 36% |
| Best Buy | 17% | 16% |
Q2 2025 Major Appliances Retailer Dollar Share Winners
| Major Appliance Retailer | Q1 2025 Dollar Share | Q2 2025 Dollar Share |
| Lowe’s | 41% | 39% |
| Home Depot | 36% | 37% |
| Best Buy | 18% | 18% |
OpenBrand’s Major Appliance Trend Insight
Lowe’s saw a small decline in share from Q1 to Q2. As the leading retailer for major appliances, Lowe’s saw slight decrease in share (2 ppt in both unit and dollar share), while Home Depot saw 2 ppt gain in unit and 1 ppt gain in dollar share.
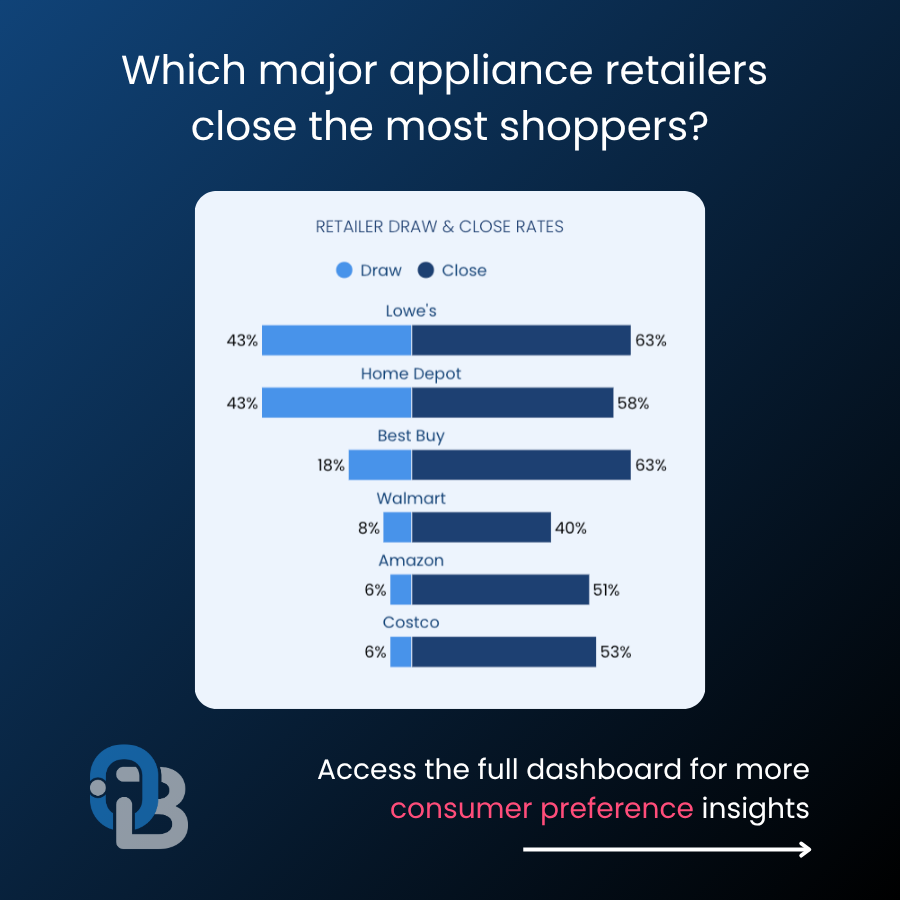
Q2 2025 Major Appliance Retailer Draw Rates
Our top market leaders also continue to lead in outlet draw rate, with:
- Lowe’s and Home Depot both drawing in 43% of all consumers who bought Major Appliances
- Best Buy follows as the third most-visited outlet, drawing 18% of consumers
OpenBrand’s Major Appliance Trend Insight
Best Buy draws in fewer shoppers, but closes the same amount as Lowe’s – and more than Home Depot. This highlights an opportunity for Best Buy. If they can draw in more shoppers, their ability to convert browsing customers into buyers at the same rate as Lowe’s, the share leader, they are likely to gain share.
For more insights on draw rates — and to see how these retailers compare in closing the consumers they brought in — quarterly major appliances MarketSignal dashboard.
Who leads the major home appliances market share by brand in Q2 2025?
Whirlpool, GE, LG, and Samsung remain the leading major appliance brands in Q2 2025, each maintaining double-digit share in both unit and dollar sales.
Q2 2025 Major Appliances Brand Unit Share Winners
| Major Appliance Brand | Q2 2025 Unit Share |
| GE | 21% |
| LG | 18% |
| Samsung | 16% |
| Whirlpool | 13% |
Q2 2025 Major Appliances Brand Dollar Share Winners
| Major Appliance Brand | Q2 2025 Dollar Share |
| GE | 20% |
| LG | 20% |
| Samsung | 16% |
| Whirlpool | 11% |
OpenBrand’s Major Appliance Trend Insight
GE saw the most share gains from Q1 to Q2. Across the top 10 brands, GE is the only brand to see a 2 ppt unit share gain. Whirlpool, meanwhile, saw a 2 ppt decrease in unit share.
Brand Consideration Rates
When purchasing major appliances, almost a third of all consumers consider these top four brands in their purchase.
| Major Appliance Brand | Q1 2025 Brand Consideration Rate | Q2 2025 Brand Consideration Rate |
| Samsung | 32% | 34% |
| LG | 32% | 33% |
| GE | 28% | 28% |
| Whirlpool | 27% | 27% |
OpenBrand’s Major Appliance Trend Insight
- While Frigidaire is only considered by 10% of consumers buying major appliances, they close 65% of those shoppers – the highest close rate of all the top major appliance brands. This high close contributes to how the brand holds 10% of market unit share, despite not being considered as often as brands like Samsung and LG.
- LG and Samsung lead all brands in consideration: Each approaches one-third of consumers, while GE and Whirlpool follow close behind at just over a quarter.
Discover the factors — from pricing dynamics to promotional activity — influencing lower conversion rates in our latest quarterly major appliances MarketSignal dashboard.
How are online and in-store sales trending for the Major Appliance market?
Physical retail remained the dominant channel for major appliance sales in Q2 2025, yet e-commerce continued its steady rise — capturing more than one in four purchases:
- In-store: 74% of purchases
- Online: 26% of purchases
OpenBrand’s Major Appliance Trend Insights
Omnichannel Advantage: With online sales now accounting for over a quarter of all major appliance purchases, brands can’t afford pricing or merchandising gaps across channels. The biggest winners are retailers that have turned BOPIS into a growth engine.
Major Appliance Consumer Demographics
OpenBrand provides census-balanced insights that reveal a clear picture of the typical major appliance customer.
As of Q2 2025, Major Appliance consumers showed the following traits:
- 73% of purchasers are homeowners, down 2 ppt since Q1
- 52% of purchasers are married, down 4 ppt since Q1
- 60% of purchases were made with males only in the buying process; 40% were made with female only
- 61% of purchases were made by Millennials or Gen Xers
- 33% were Millennials, up 2 ppt
- 28% were Gen X, down 1 ppt
OpenBrand’s Major Appliance Trend Insights
Major appliance consumers skew younger. Millennials lead as the largest buying segment for the category, and saw a 2 ppt rise between Q1 and Q2 2025. Gen Z already makes up 16% of major appliance consumers.
Major Appliance Purchase Drivers
Why do consumers select a specific retailer for purchase? The most mentioned reasons for purchasing major appliances at a specific retailer were:
Why consumers select a specific retailer
- Competitive price — 56% (down 1 ppt since Q1)
- Good selection of products — 31% (down 1 ppt since Q1)
- Convenient location — 28% (down 1 ppt since Q1)
- Previous experience with store — 27%
OpenBrand’s Major Appliance Trend Insights
Shopper familiarity is key: “Previous experience with the store” was the only purchase driver to not see a decrease from Q1 to Q2 2025, suggesting that trust, service consistency, and positive past interactions should not be ignored in where consumers choose to buy. For retailers, this highlights the importance of loyalty, reputation, and delivering a seamless experience that keeps shoppers coming back.
Appliance Industry Outlook and Emerging Trends
What’s next for the US Major Appliance market in 2025?
Looking beyond Q2 2025, several factors are shaping the major appliance market:
Holiday & Big Deal Days Gain Even More Weight: The traditional year-end shopping surge (including the Amazon Prime Days, Black Friday, and holiday promos) will continue to shape appliance volume. Retailers and brands should be prepared for intensified competition across both online and in-store as consumers expect deeper deals and faster fulfillment.
Tariff, Supply Chain & Pricing Risks Continue: With ongoing global trade uncertainty and tariff headwinds still on the radar, brands must remain agile in sourcing and cost-structure modeling. Unexpected input-cost shifts or policy changes in late 2025 could force pricing or promotional adjustments.
Elevated Promo Activity amid Economic Sensitivity: Given that consumers remain price-conscious, despite moderating inflation, promotional intensity is likely to stay high through Q4. Brands and retailers should expect discounting to remain a key lever for driving traffic and share.
Housing Market Dynamics Could Drive a Late-Year Lift: Appliances continue to correlate with housing activity. If new-home starts, remodeling projects, or existing-home sales pick up in late 2025, major appliance demand may receive a lift. Monitoring housing indicators will provide early signals.
Energy Efficiency & Smart Features Move Front-and-Center: With regulatory pressure increasing (for example around energy-use standards) and more consumers seeking sustainable, connected products, appliance makers that prioritise efficiency and smart-home integration will have a competitive edge.
Get more insight into Major Appliance market trends
The market insights don’t stop here.
For more retail sales data, market share, and insights on the major appliance industry, access our public major appliances MarketSignal quarterly dashboard now – no paid subscription required.

To see insights for other industries or find out how we can help power growth for your business, contact us today.
Ashley Jefferson
Ashley is the Demand Generation Manager at OpenBrand. She's a seasoned marketing professional with over 9 years of experience creating content and driving results for B2B SaaS companies.
Related blogs
Explore Our Data

Free Quarterly Dashboards
Explore category-level data dashboards, built to help you track category leaders, pricing dynamics, and consumer demand – with no subscription or fee.
Related blogs
Business Printer Hardware: 2025 Year-In-Review
Our Business Printers: Printer Hardware 2025 Year-in-Review report recaps product launch activity,…
Headphones: 2025 Year-In-Review
Our Headphones: 2025 Year-in-Review report recaps launches, placements, pricing and advertising and…
Refrigerators: 2025 Year-In-Review
Our Refrigerators: 2025 Year-in-Review report recaps product launches, placements, pricing and…
Notebooks: 2025 Year-In-Review
Our Notebooks: 2025 Year-in-Review report recaps launches, placements, pricing and advertising and…


