


The Power Tools market share landscape continues to shift in Q4 2025 as shoppers rebalance spending across brands like DEWALT, Ryobi, Milwaukee, Craftsman, and Hyper Tough and retailers such as Home Depot, Lowe’s, Walmart, and Amazon.
A wave of innovation is reshaping category fundamentals in cordless battery systems, smart-tool connectivity, and sustainability-driven design. Big-box home improvement retailers and traditional dealer networks remain influential, while e-commerce and brand-direct channels continue to carve out share.
This report uses OpenBrand’s Power Tools Total Market Insights Infographic [download now!] to show which Power Tools brands and retailers are gaining share, how online vs. in-store sales compare, and what drives purchase decisions across generations. To see all the data, download the infographic now!
Source: All data insights in this article reflect Q4 2025 data from an OpenBrand aggregate category that includes Air Compressors, Circular Saws, Jig Saws, Orbital Sanders, Power Drills, Reciprocating Saws, and Rotary Tools.
Key Takeaways: Power Tools Market Share Q4 2025
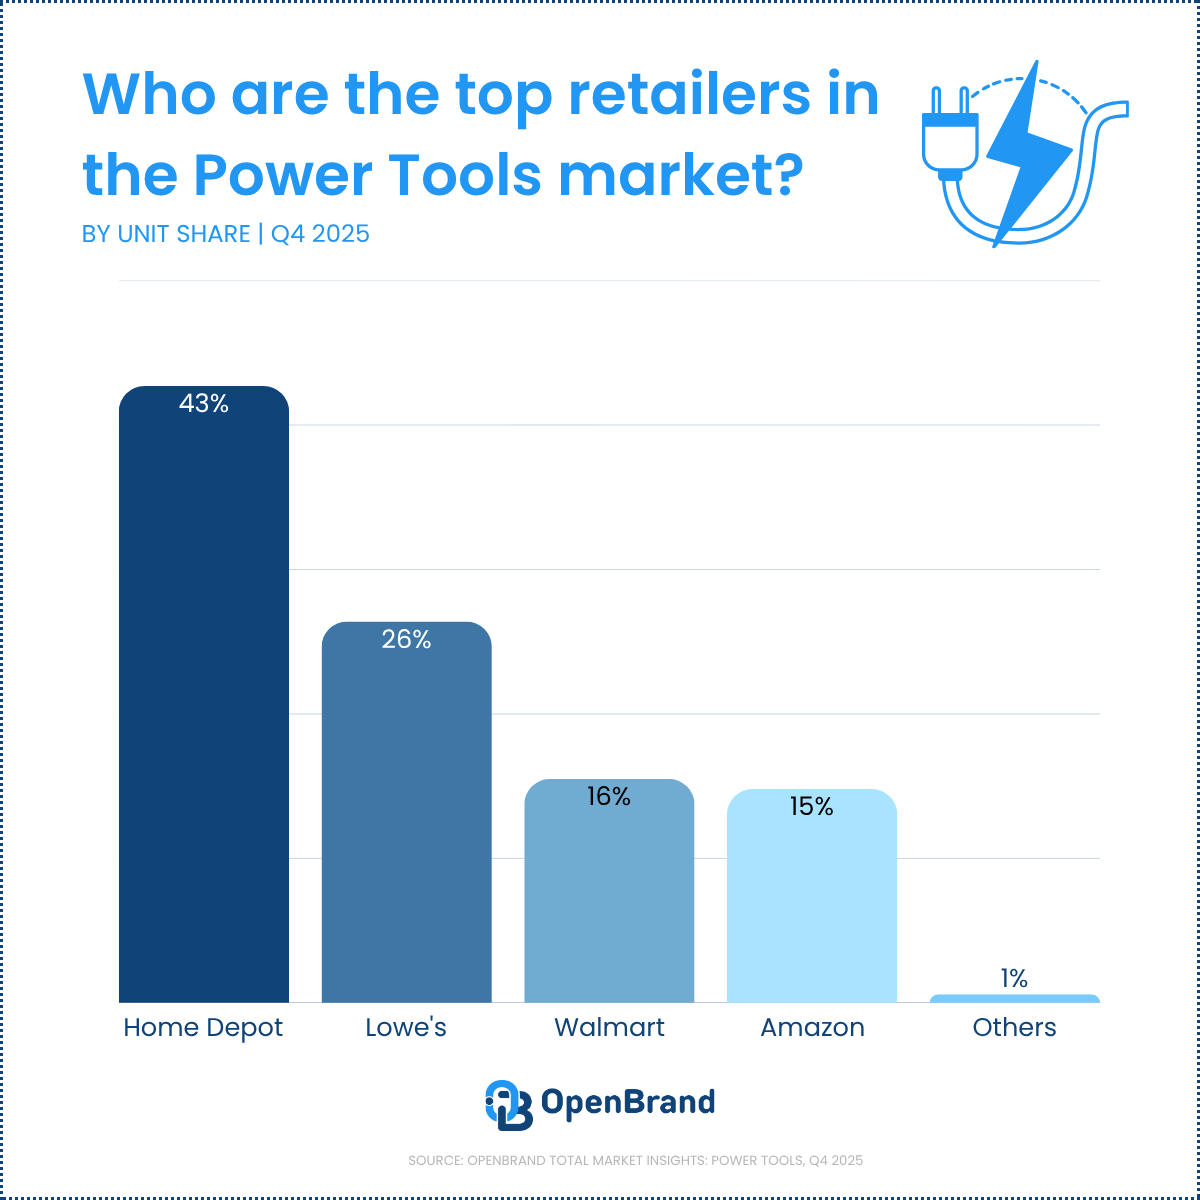
- Home Depot leads retailers at 43% unit share, with Lowe’s at 26%, Walmart at 16%, and Amazon at 15%.
- DEWALT and Ryobi tie for the brand lead at 19% unit share each, but DEWALT dominates dollar share at 28% to Ryobi’s 11%.
- Home Depot draws the most shoppers (41%) and closes the most (75%); when it loses a shopper, 53% go to Lowe’s.
- The category stays store-led: 72% of purchases happen in-store, 28% online.
- Millennials are the largest buyer group at 33%, with Gen X (28%) and Gen Z (20%) close behind.
- Competitive price is the top reason shoppers pick a retailer (50%), and replacing a broken tool drives the most purchases (35%).
Who are the top Power Tools retailers by market share?
In Q4 2025, Home Depot leads Power Tools unit share at 43%, followed by Lowe’s at 26%, Walmart at 16%, and Amazon at 15%. These retailers account for nearly the entire tracked market, with other outlets contributing just 0.6% of unit share.
Q4 2025 Top Power Tools retailers by market share
| Power Tools Retailer | Q4 2025 Unit Share |
| Home Depot | 43% |
| Lowe’s | 26% |
| Walmart | 16% |
| Amazon | 15% |
| Best Buy | 1% |
Notes:
OpenBrand’s share split is based on our retailer panel, which currently consists of Home Depot, Lowe’s, Amazon, Walmart, and Best Buy. These retailers make up a majority of non-individual dealer sales in the Power Tools industry. More retailers are coming soon.
Shares may not total 100% due to rounding.
OpenBrand’s Power Tools Trend Insight
Home Depot continues to dominate Power Tools unit sales, but Lowe’s maintains a strong share of the category, and Walmart and Amazon together now represent about one-third of tracked unit volume. The narrow gap between Walmart and Amazon shows that both remain credible alternatives for value-driven shoppers.
Q4 2025 Power Tools Retailer Draw Rates
Our top market leaders also continue to lead in outlet draw rate, with:
- Home Depot drawing in 41% of all Power Tools purchasers
- Lowe’s drawing in 33%
- Walmart following as the third most considered outlet at 18%
Among these top three retailers, Home Depot also has the highest close rate at 75%.
| Retailer | Draw Rate |
| Home Depot | 41% |
| Lowe’s | 33% |
| Walmart | 18% |
| Amazon | 14% |
| Harbor Freight | 6% |
To see close rates for these retailers, download the infographic.
OpenBrand’s Power Tools Trend Insights
Home Depot not only draws the most Power Tools shoppers but also converts them at a strong 75% close rate, reinforcing its role as the category’s anchor destination. Harbor Freight stands out for efficiency, closing 70% of the smaller share of shoppers it attracts, which points to upside if it can widen consideration.
Who wins Home Depot’s lost shoppers?
OpenBrand’s leakage analysis data looks at which Power Tools retailers win shoppers after they shop one retailer but ultimately don’t purchase. As one example, we look at Home Depot (market share leader) to see who picks up their lost shoppers.
Home Depot has a walk rate of 25%. Here’s who gains those shoppers.
| Destination for Home Depot Lost Shoppers | % of Lost Shoppers Captured |
| Lowe’s | 53% |
| Amazon | 15% |
| Walmart | 11% |
| Harbor Freight | 7% |
OpenBrand’s Power Tools Trend Insights
More than half of Home Depot’s leaked shoppers end up purchasing at Lowe’s, underscoring the retailer’s strength as a backup destination when Home Depot does not close the sale. Amazon and Walmart also pick up a meaningful share of these shoppers, suggesting that convenience and price remain strong fallback drivers.
Who leads the Power Tools market share by brand?
The top Power Tools brand is DEWALT, leading in both unit and dollar share – though tied with Ryobi in units share.
DEWALT and Ryobi each hold 19% of Power Tools unit share in Q4 2025, while Milwaukee holds 13% and over-indexes on dollar share at 22%. DEWALT leads the category in dollar share at 28%, compared with Ryobi’s 11%.
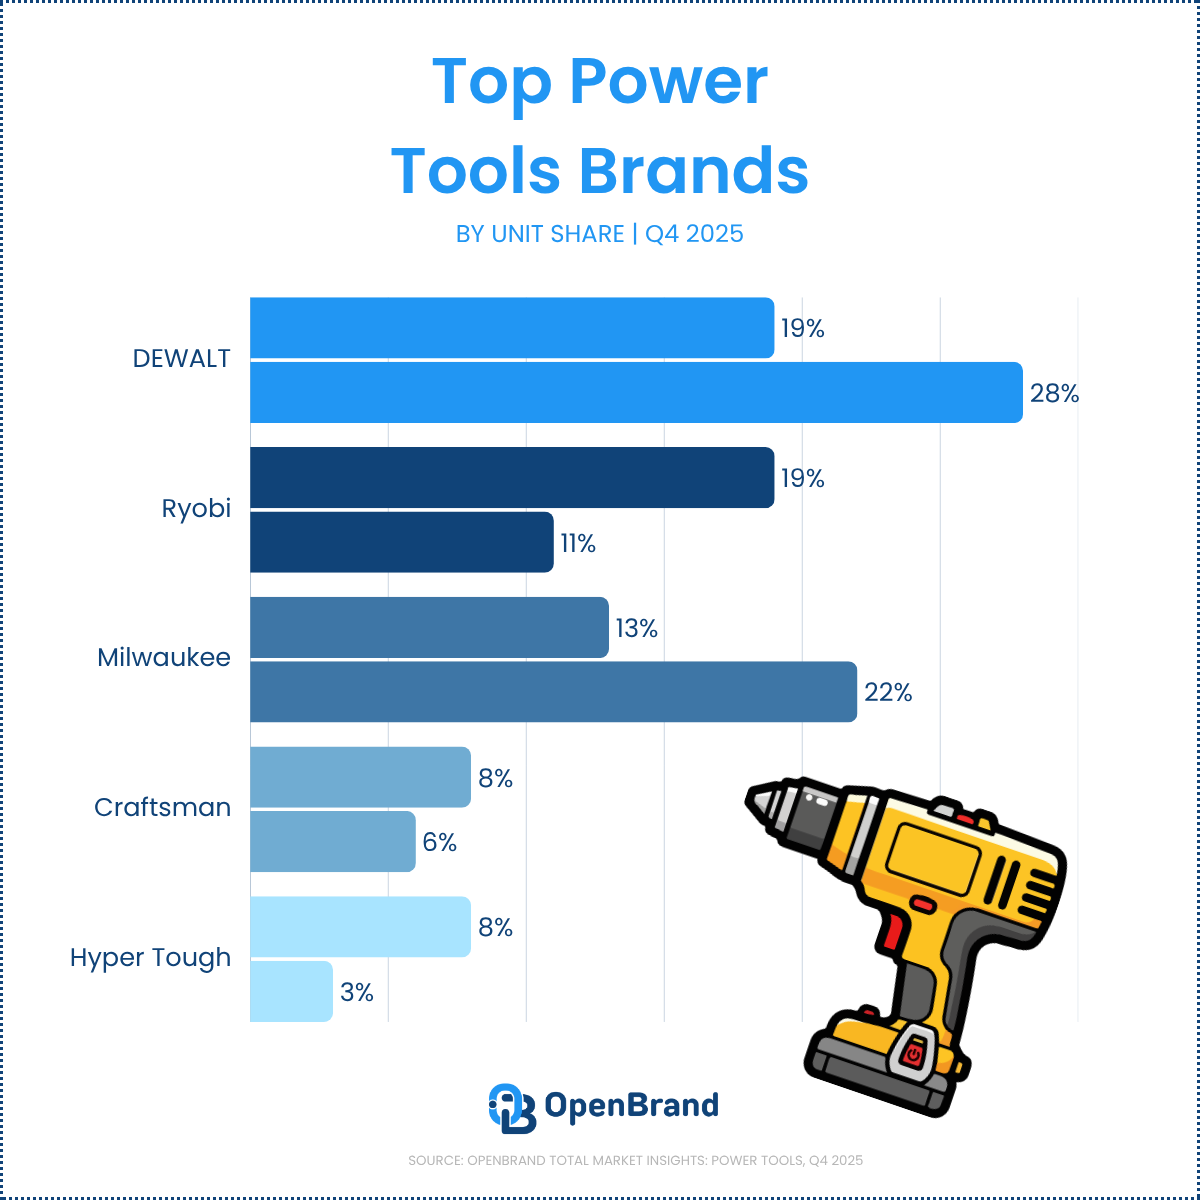
Q24 2025 Power Tools Brand Market Share
| Brand | Q4 2025 Unit Share | Q4 2025 Dollar Share |
| DEWALT | 19% | 28% |
| Ryobi | 19% | 11% |
| Milwaukee | 13% | 22% |
| Craftsman | 8% | 6% |
| Hyper Tough | 8% | 3% |
OpenBrand’s Power Tools Trend Insights
DEWALT and Ryobi are tied for first in unit share, but DEWALT’s dollar share is more than double Ryobi’s, highlighting a stronger premium position. Milwaukee also outperforms on dollars relative to units, while Craftsman and Hyper Tough play a larger role in value-driven sales.
Power Tools SKU-level share winners
The top SKUs in Power Tools were manufactured by Craftsman and Ryobi.
| SKU | Unit Share | Average Price | Min Price | Max Price |
| Craftsman – 20 V Power Drill (CMCD700C1) | 4.3% | $71 | $64 | $82 |
| Ryobi – 18 V Power Drill (PCL201K1) | 3.6% | $50 | $38 | $57 |
| Ryobi – 18 V Power Drill (PCL206K1) | 3.3% | $75 | $59 | $83 |
OpenBrand’s Power Tools Trend Insights
Craftsman leads the quarter at the SKU level with its 20 V Power Drill, but Ryobi places two of the top three SKUs across different price bands. This distribution shows how strong lineup coverage within a single use case can help a brand capture both entry and step-up demand. This is also significant given Ryobi exclusivity with Home Depot – and emphasizes why Home Depot leads the market.
How are online and in-store sales trending for the Power Tools market?
In Q4 2025, 72% of Power Tools purchases happen in a retail store or other outlet, while 28% are completed online through the internet. The category remains store-led, but online still represents more than one in four purchases.
- In-store: 72% of purchases
- Online: 28% of purchases
OpenBrand’s Power Tools Trend Insights
The in-store channel continues to dominate because Power Tools shoppers often want to assess weight, feel, and build quality before purchase. Even so, the online share is large enough that product content, reviews, and availability messaging remain essential to winning consideration and conversion.
Power Tools Consumer Demographics
Millennials remain the largest Power Tools buyer group in Q4 2025 at 32.9% of unit sales, followed by Gen X at 27.5% and Gen Z at 20.2%. Baby Boomers account for 18.2%, while Matures represent 1.2% of the market.
| Generation | Q4 2025 Unit Share |
| Gen Z (born after 1996) | 20% |
| Millennials (born 1981–1996) | 33% |
| Gen X (born 1965–1980) | 28% |
| Baby Boomers (born 1946–1964) | 18% |
| Matures (born before 1946) | 1% |
OpenBrand’s Trend insights
Millennials continue to lead the category, but Gen X and Gen Z together account for nearly half of all purchases, reinforcing the need for messaging that spans both established homeowners and younger shoppers entering the category. This mix suggests brands should balance performance and durability cues with approachable value and project-oriented education.
Power Tools Purchase Drivers
Competitive price remains the top reason shoppers choose a retailer for Power Tools, followed by product selection, convenient location, and prior experience with the store. On the product side, replacement remains the biggest purchase trigger, while first-time purchases and additional tool purchases also represent meaningful demand.
Why consumers select a specific retailer
| Retailer Purchase Driver | % of Shoppers Mentioning |
| Competitive price | 50% |
| Good selection of products | 30% |
| Convenient location | 21% |
| Previous experience with store | 19% |
| Already in store buying other items | 16% |
OpenBrand’s Power Tools Trend Insights
Nearly half of shoppers cite competitive price as the main reason they choose a retailer, confirming that Power Tools remains a cost-sensitive category. Assortment, convenience, and prior store experience still play major supporting roles, which means retailers cannot rely on pricing alone.
Why consumers purchase a Power Tool product
| Product Purchase Driver | % of Purchases |
| Replacement for broken, lost, or not working item | 34.9% |
| First-time purchase of this item | 17.3% |
| Wanted an additional one | 10.9% |
| Part of remodeling project | 10.3% |
| Just wanted a new one | 9.9% |
OpenBrand’s Power Tools Trend Insights
Replacement needs drive more than one-third of category purchases, which keeps functional, solution-oriented messaging highly relevant. At the same time, first-time buyers and expansion purchases create room for education, comparison content, and project-based merchandising.
Power Tools Competitive Intelligence: Pricing & Promotions
OpenBrand’s Q4 2025 competitive intelligence data shows how shelf presence, pricing, discounting, and new product activity differ across major Power Tools brands. Together, these indicators help explain which brands are building visibility, defending margins, and investing in future demand.
Our infographic offers insight into pricing, promotions, and product debuts. Here’s a look at how brand share of shelf is trending.
Brand share of shelf
There are 5,074 total category placements across tracked retailers.
| Brand | Share of Shelf |
| DEWALT | 15% |
| Milwaukee | 9% |
| Makita | 9% |
| Ryobi | 5% |
| Bosch | 4% |
| California Air Tools | 4% |
| Skil | 3% |
| Wen | 3% |
| Craftsman | 2% |
| Hyper Tough | 1% |
OpenBrand’s Trend insights
DEWALT’s share of shelf has clear value: the brand leads in unit and dollar share as well, highlighting the value of claiming space in store.
Power Tools Industry Outlook and Emerging Trends
What’s next for the US Power Tools market in 2025?
Looking into 2026, several factors are shaping the Power Tools market:
Sustainability and compliance reshape the competitive landscape
Battery platforms continue to expand as states phase out gas equipment and tighten emissions rules. Consumer demand is shifting toward cleaner, quieter, and lower-maintenance tools. Brands with established battery ecosystems and multi-tool compatibility are positioned to win as the category moves further into full electrification.
Smart technology and automation gain traction
Connected tools, diagnostics, and automation are moving from early adoption into mainstream use. Rising labor costs are accelerating interest in features like performance tracking, app-based management, theft prevention, and intelligent controls. Expect more high-capacity battery packs, faster charging innovations, and premium user experiences centered on efficiency and uptime.
Omnichannel execution becomes a key differentiator
In-store remains the anchor for Power Tools, but online growth continues to outpace the rest of the category. Amazon is closing the gap with Home Depot, and shoppers increasingly expect seamless pricing, strong digital content, and fast fulfillment. Retailers that integrate BOPIS, clear comparisons, and strong reviews will gain share as buying journeys shift.
Margin pressure increases and drives consolidation
Electrification, software integration, and regulatory compliance are raising the cost of doing business. Brands are reducing SKU complexity, leaning deeper into platform ecosystems, and taking a more disciplined approach to partnerships and pricing. The result is a more consolidated market where scale and innovation matter more than ever.
Get more insight into Power Tools market trends
Q4 2025 shows a Power Tools market shaped by premium and value segmentation, strong store-led demand, and a competitive mix of retailers and brands fighting for share.
As electrification, smart features, and omnichannel expectations continue to evolve, current market data becomes more important for pricing, assortment, and merchandising decisions.
See the Power Tools Total Market Insights Infographic
Get the complete Q4 2025 picture: brand and retailer share, draw and close rates, price-band breakdowns, SKU winners, share of shelf, discount depth, and product debuts in one view.
Want the data for a specific category, brand, or retailer? Contact us today!
Power Tools Market Share FAQs
Who has the largest Power Tools market share in Q4 2025?
By brand, DEWALT and Ryobi are tied for the lead at 19% unit share each, with DEWALT well ahead on dollar share at 28%. By retailer, Home Depot leads at 43% unit share, followed by Lowe’s at 26%.
Which brand leads Power Tools dollar share?
DEWALT leads dollar share at 28%, more than double Ryobi’s 11% despite their tied unit share. Milwaukee also over-indexes on dollars at 22% versus 13% unit share, signaling a premium position.
Which retailer has the highest close rate in Power Tools?
Among the top draw retailers, Home Depot has the highest close rate at 75%, converting the most shoppers it attracts. Harbor Freight closes 70% of a much smaller draw, pointing to upside if it can widen consideration.
Where do Home Depot’s lost Power Tools shoppers go?
More than half of Home Depot’s lost shoppers, 53%, end up purchasing at Lowe’s. Amazon captures 15% and Walmart 11%, making convenience and price the main fallback drivers.
Are Power Tools bought more online or in store?
The category remains store-led, with 72% of Q4 2025 purchases completed in a retail store and 28% online. That online share is large enough that product content, reviews, and availability messaging still influence consideration.