




With the 2023 Kitchen & Bath Industry Show (KBIS) just weeks away, join us as we breakdown some of the latest OpenBrand MindShare Kitchen & Bath Fixtures market data — including top brands and retailers, consumer preferences, and key consumer purchase drivers.
Download the full Kitchen & Bath Fixtures market infographic below to get even more insights.
Source: All data in this article was pulled from the OpenBrand MindShare platform using the rolling 4Q ending Q4 2023, Kitchen & Bath category. The TraQline Kitchen & Bath Fixtures category is an aggregate of several products including: Faucets (43%), Shower Heads (27%) Sinks (12%), Toilets (12%), Shower Stall/Door or Bathtub (7%). For the most recent insights or further dives into the data, please contact us.

Who are the top Kitchen & Bath Fixtures retailers by market share?
Kitchen & Bath Fixtures Retailer Unit Share
In 2023, the leading retailer for Kitchen & Bath Fixtures was Home Depot, winning the market with a unit share of 32%.
Lowe’s was the next largest retailer for Kitchen & Bath Fixtures with 24%-unit share, though the outlet was down nearly 1 point compared to the same time the previous year.
Amazon came in third place with 12%-unit share. However, the major online retailer continued a 4-year upward trend, with an increase of over 1 point year-over-year (YOY).
Kitchen & Bath Fixtures Retailer Dollar Share
Home Depot also leads the Kitchen & Bath Fixtures market with 26% dollar share, followed again by Lowe’s (18% share). Both Home Depot and Lowe’s were down over 1 point in dollar share YOY.
Meanwhile, sales with Contractors close the gap on Lowe’s with a YOY increase of 2.5 points, sitting in third place with 13%-dollar share.
Outlet Draw Rates
Top retailers Home Depot, Lowe’s, and Amazon also lead in outlet draw rate, bringing in 46%, 39%, and 16% of consumers shopping for Kitchen & Bath Fixtures, respectively.
Who leads the Kitchen & Bath Fixtures market share by brand?
Kitchen & Bath Fixtures Brand Unit Share
In 2023, the most popular brands for Kitchen & Bath Fixtures were Kohler, Moen, and Delta.
In unit share, the top three brands saw the following split:
- Kohler, 14.3% share
- Moen, 13.8% share
- Delta, 13.2% share
Each of these top brands enjoyed significantly higher unit share than all other brands. Notably however, while Kohler and Delta were mostly flat YOY, Moen saw a decline of nearly 2 points, resigning its spot as the top retailer in 2022 to Kohler.
Kitchen & Bath Fixtures Brand Dollar Share
When looking at brand dollar share, Kohler maintained a clear lead over all other Kitchen & Bath Fixtures brands with 16% market share. Kohler enjoyed an increase of 1 percentage point versus the prior year.
Moen and Delta were the second and third most popular Kitchen & Bath Fixture brands, each with a dollar share of 8%. As seen in unit share, Moen dollar share declined YOY, with a loss of over 2 points.
Brand Consideration Rates
Across the Kitchen & Bath Fixtures aggregate, Kohler, Moen, and Delta continue to lead in brand consideration with 20%, 20%, and 19% of all consumers, respectively.
What is the average price paid in the Kitchen & Bath Fixtures market?
In 2023, the average price paid across the industry for Kitchen & Bath Fixtures was $223, an increase from the $208 average price paid in 2022.
In general, all the top outlets have had a slight increase in average prices from this time last year. Specialty Kitchen & Bath retailers saw the largest increase in average price paid with Kitchen & Bath dealers up by $723 and sales purchased via Contractors increasing by $275 versus the year prior.
How are online and in-store sales trending for the Kitchen & Bath Fixtures market?
In 2023, in-store continued to be the most common sales channel for Kitchen & Bath Fixture purchases, accounting for 66% of all purchases. Correspondingly, 27% of all Kitchen & Bath purchases are made online.
Additional online vs. In-store insights for Kitchen & Bath Fixtures include:
- In-store purchases continue a 5-year downward trend, dropping 2.6 points YOY
- Online purchases have steadily increased over the past 5 years, gaining 1.8 points YOY
- Among consumers buying in-store, 27% shopped online before making their purchase
Online vs. In-Store Average Price Paid
Historically, consumers purchasing Kitchen & Bath Fixtures in-store tend to have a lower average price than those buying online. This trend continued in 2023, with an average retail purchase price of $149 and an average online purchase price of $166.
Other key Kitchen & Bath Fixtures market insights
Kitchen & Bath Fixtures Consumer Demographics
In 2023, demographics for the typical Kitchen & Bath consumer included:
- 84% of purchasers were homeowners; 14% of purchasers were renters
- 63% of purchasers were married
- 36% of purchases were made with female only involved in the shopping process; 33% were male only made purchases
- 73% of purchasers were made by Baby Boomers (47%) and Gen X (26%)
- Purchases by Baby Boomers were down 3.6 points and Gen X purchases were flat YOY
- Purchases by Millennials (19.9%) and Gen Z (3.8%) were up 2.5 points and 1.2 points, respectively, YOY
Outlets & Brands Shopped
When buying Kitchen & Bath Fixtures, 66% of consumers shopped at only one store before purchase, and 78% shopped for only one brand.
Kitchen & Bath Fixtures Purchase Drivers
What drives consumers to purchase Kitchen & Bath Fixtures?
As seen in previous years, the most mentioned reasons for purchasing Kitchen & Bath Fixtures were:
- “Routine maintenance or minor repair” (53%)
- “Part of remodeling project” (23%)
- “Redecorated” (11%)
When it comes to selecting a retailer to purchase from, the most mentioned reasons were:
- “Competitive price” (51%)
- “Good selection of products” (41%)
Kitchen & Bath Fixtures Installation
In 2023, 56% of Kitchen & Bath Fixture installations were performed by the purchasers, someone in their house, or a friend. Understandably, the less complicated product installations like Shower Heads are more likely to be installed this way, making up 77% of the aggregate.
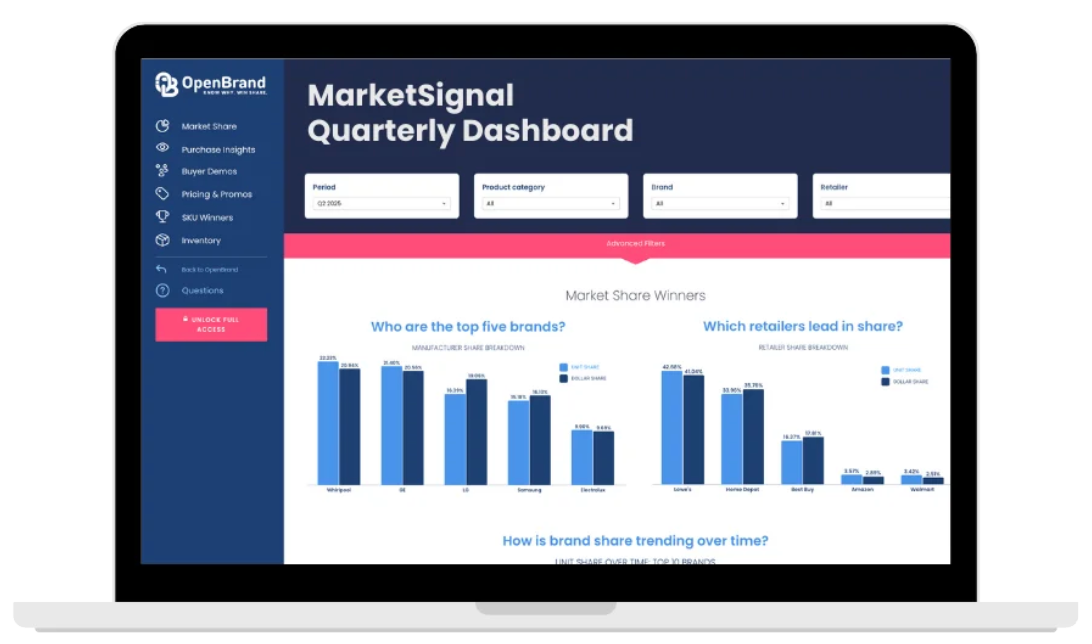
Get more insight into Kitchen & Bath trends and market share
The market insights don’t stop here. For more retail sales data, market share, and insights on the Kitchen & Bath industry, download the OpenBrand-exclusive infographic below. To see insights for other industries or find out how we can help power growth for your business, contact us today.