



Home improvement demand held steady through the back half of 2025, and paint market share closed the year shaped by three forces:
- Retailer share concentrating around a single dominant player
- Value-tier volume holding firm while net prices climbed
- A widening gap between shelf presence and share capture
Using data from OpenBrand’s latest Paint & Stain Total Market Insights report [download now!], we analyzed how consumers are shopping the category, where retailers are winning and losing share, and which top paint brands are gaining traction.
The paint and stain market referenced here includes interior and exterior paint and stain purchases measured per ticket, meaning multiple products or brands could appear in a single transaction.
While the data reflects Q4 2025, the trends highlighted below represent the current direction of the paint and stain market heading into 2026.
SOURCE: All data insights in this article covers Q4 2025 data within the OpenBrand Total Market Insights Paint & Stain category. This includes interior and exterior paint and stain, measured per ticket, excluding spray paint.
Summary: Paint & Stain Market Key Stats
- Home Depot leads paint and stain retailer unit share at 58.5%, more than 23 points ahead of Lowe’s
- BEHR ranks as the top brand by unit share at 31.1%, followed by Glidden and Valspar
- Products priced under $50 account for the largest share of units at 32.7%
- Sherwin-Williams posts the category’s highest retailer close rate at 83.1% on the smallest draw among the top three
- Category average net price per gallon rose from $48.47 in July to $54.02 in December
- In-store still accounts for 93.2% of purchases, with only 6.8% bought online
- Baby Boomers are the largest buyer group at 31.9% of purchases
- OpenBrand tracked 5,217 total category placements across retailers, led by Glidden at 15.7% share of shelf
Which retailers have the highest market share for paint and stain?
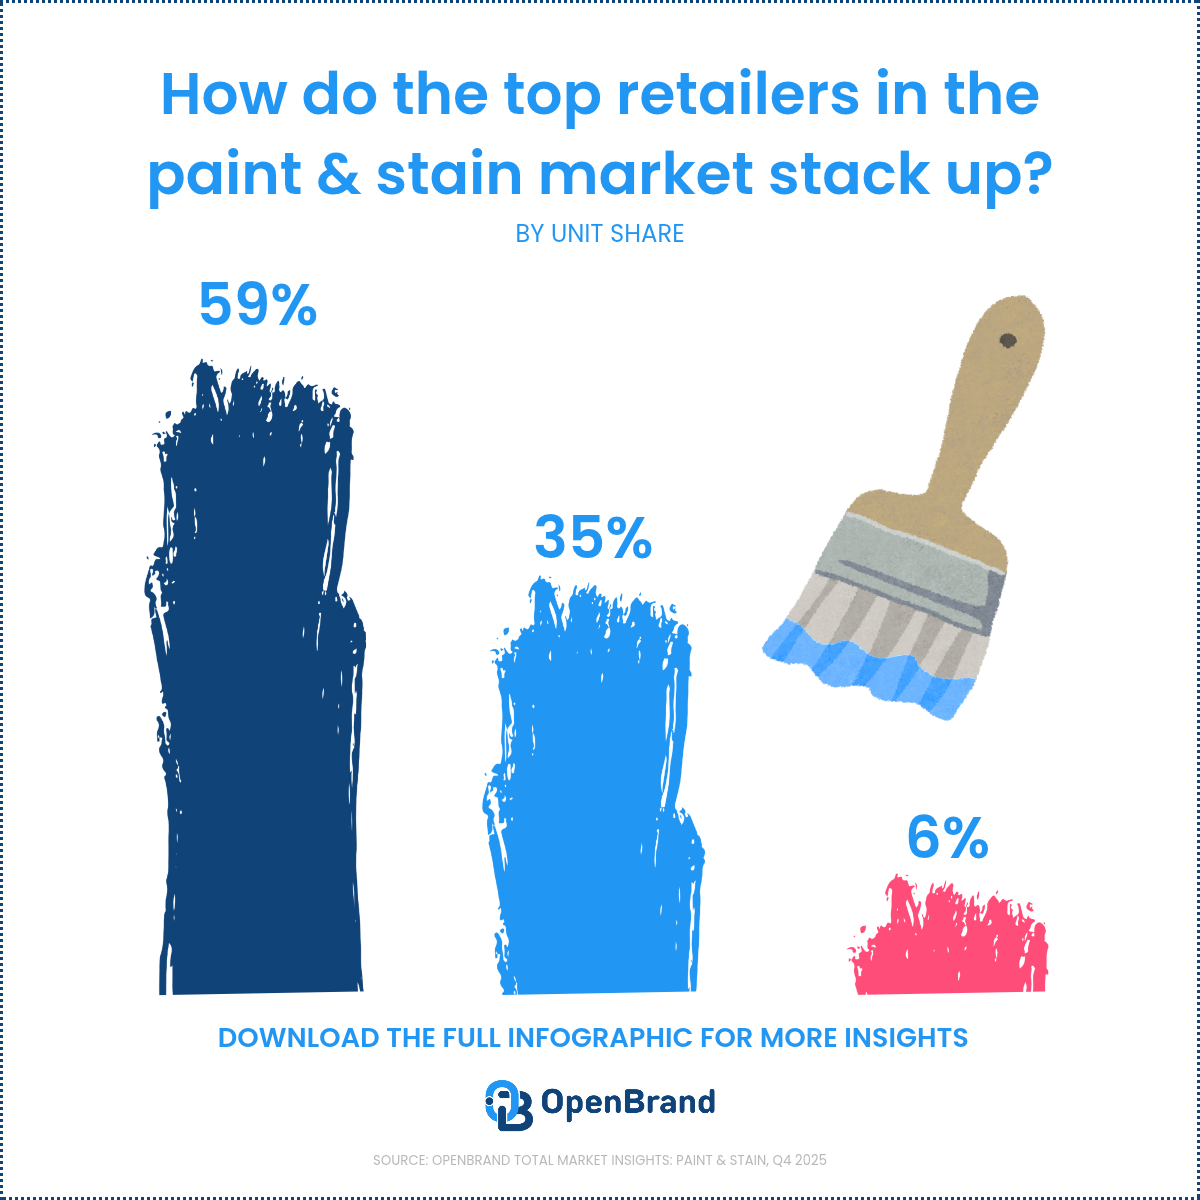
According to OpenBrand’s Q4 2025 market data, retail leadership in the paint and stain market is far more concentrated than in most durables categories. Home Depot is the leading retailer for paint purchases with 58.5% of unit share, Lowe’s takes 35.4%, and Ace Hardware rounds out the measured field at 6.1%. Two retailers account for roughly nine in ten units sold.
Top Paint & Stain Retailers by Unit Share
| Rank | Paint & Stain Retailer | Unit Share (%) |
| 1 | Home Depot | 58.5% |
| 2 | Lowe's | 35.4% |
| 3 | Ace Hardware | 6.1% |
Source: OpenBrand Paint & Stain Market Insights, Q4 2025
OpenBrand’s Paint & Stain Trend Insights
Concentration this tight changes what growth looks like. In a fragmented category, a brand can win by adding doors. Here, national distribution effectively means two accounts, so assortment position, planogram depth, and promotional calendar alignment inside those accounts carry most of the weight.
For brands, that raises the stakes on every line review. For independents and regional chains, the opening is service, color expertise, and contractor relationships rather than price.
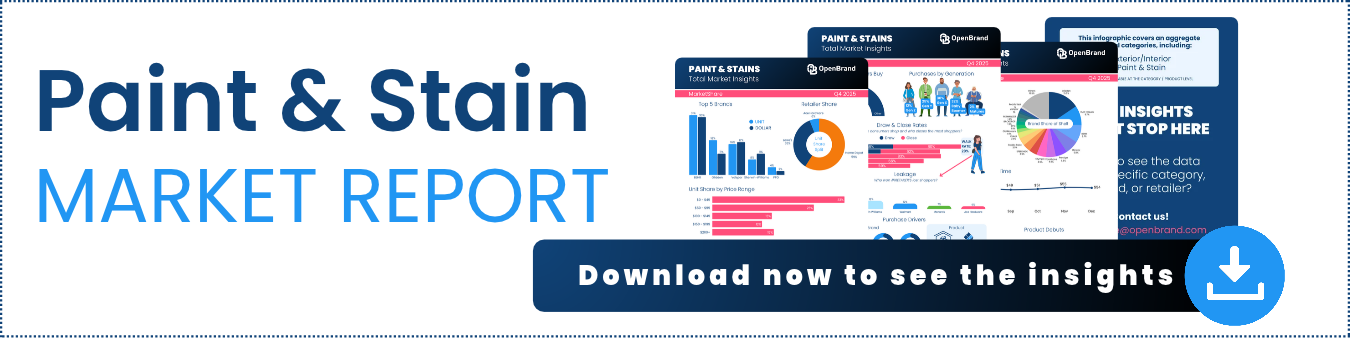
For more paint and stain retailer insights, including retailer leakage, conversion trends, and shopper behavior data, download the full infographic.
Paint and stain retailers are competing more aggressively for shopper conversion
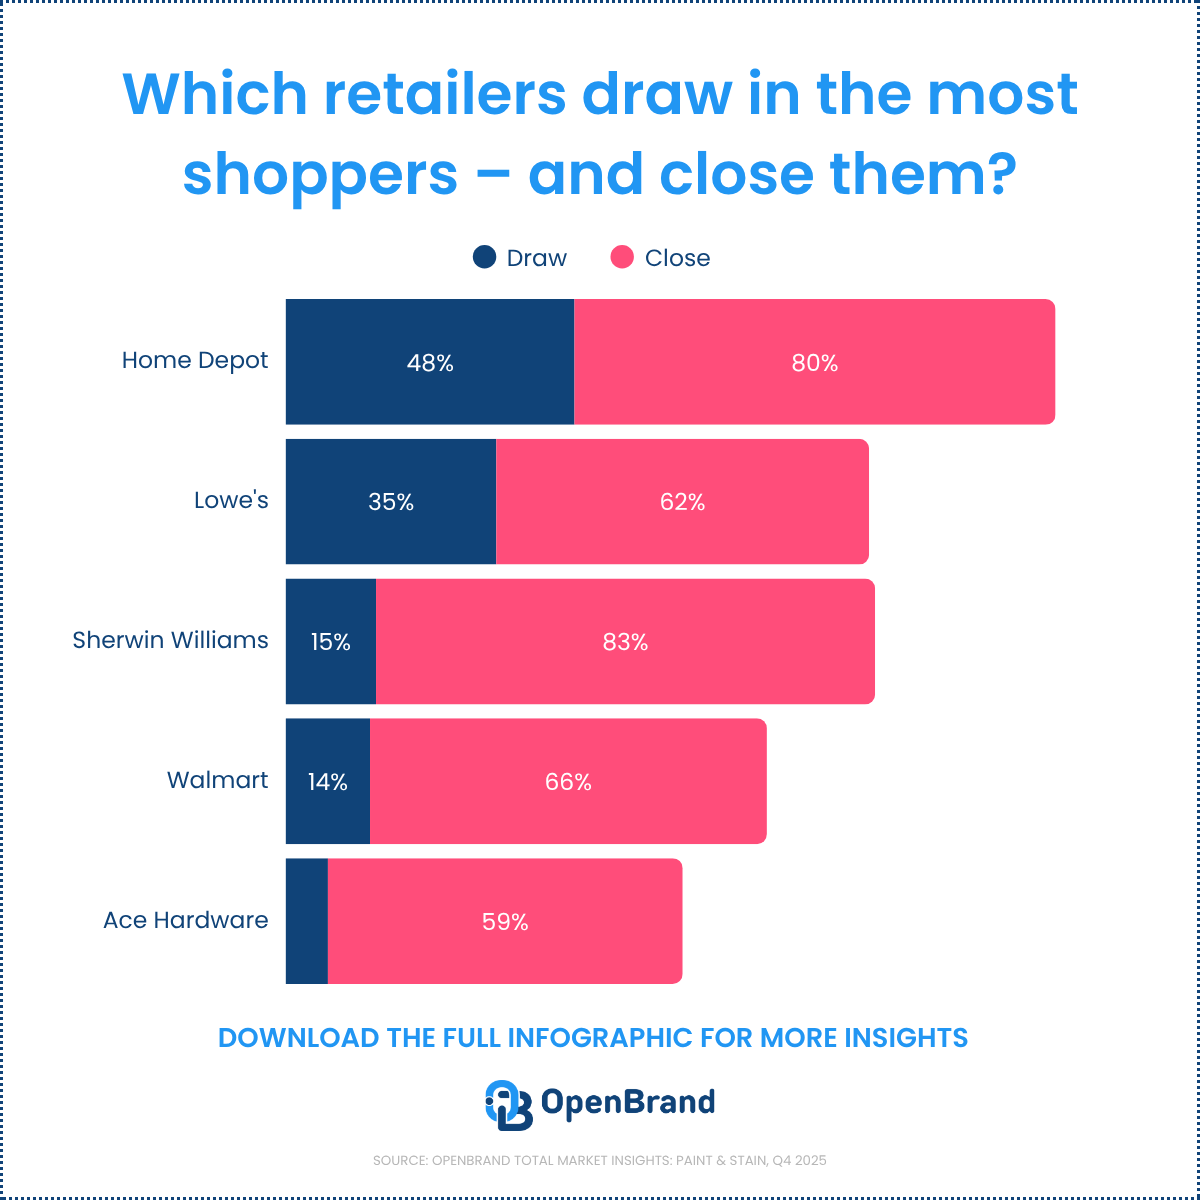
Unit share tells you who sold the paint. Draw rate looks at how many consumers a retailer brought in regardless of where they ultimately purchased, and close rate shows how many of those shoppers converted. In coatings, those two numbers separate sharply.
Q4 2025 Paint & Stain Retailer Draw Rates
| Paint & Stain Retailer | Draw Rate | Close Rate |
| Home Depot | 47.6% | 79.6% |
| Lowe's | 34.6% | 62.0% |
| Sherwin-Williams | 14.5% | 83.1% |
| Walmart | 13.9% | 65.6% |
| Ace Hardware | 7.4% | 58.6% |
Source: OpenBrand Paint & Stain Market Insights, Q4 2025
Home Depot both draws the most shoppers and converts nearly four in five of them. Sherwin-Williams draws only 14.5% of shoppers but closes 83.1%, the strongest conversion rate in the category. The opportunity for Sherwin-Williams would be to increase their traffic, which would then increase their share.
Lowe’s has the second-largest draw and the weakest close among the top three, which is where its unit share leaks away.
Want deeper insights into retailer conversion and shopper leakage trends? Download the infographic for the full breakdown.
OpenBrand’s Paint & Stain Trend Insights
A high draw with a soft close is a merchandising problem, not a traffic problem. Shoppers who reach the aisle and leave without buying are usually blocked by:
- color matching and tinting wait times
- out-of-stock sheens or base sizes
- unclear price-per-gallon comparisons across container sizes
- weak staff guidance on prep and coverage
Sherwin-Williams shows the ceiling. Specialist service converts intent at a rate mass retail has not matched.
Shopper leakage reveals how directly retailers compete
Retail competition becomes clearer when a retailer loses a sale and someone else captures it. OpenBrand’s proprietary retail leakage analysis tracks exactly where those shoppers land.When Home Depot does not close a paint or stain shopper:
- Lowe’s captures 50% of those lost shoppers
- Sherwin-Williams captures 18%
- Walmart takes 12%, Menards 7%, and Ace Hardware 6%
Half of every shopper Home Depot loses walks into a Lowe’s, which makes these two retailers direct substitutes in the consumer’s mind more than any other pair in the paint and stain market.
OpenBrand’s Paint & Stain Trend Insights
The leakage pattern explains why competitive pricing and promotion between the two home centers moves category share so quickly. It also explains the outsized value of Sherwin-Williams capturing 18.1% of Home Depot’s lost shoppers: those consumers are already in project mode and are trading up to service rather than shopping down on price.
What are the top paint and stain brands?
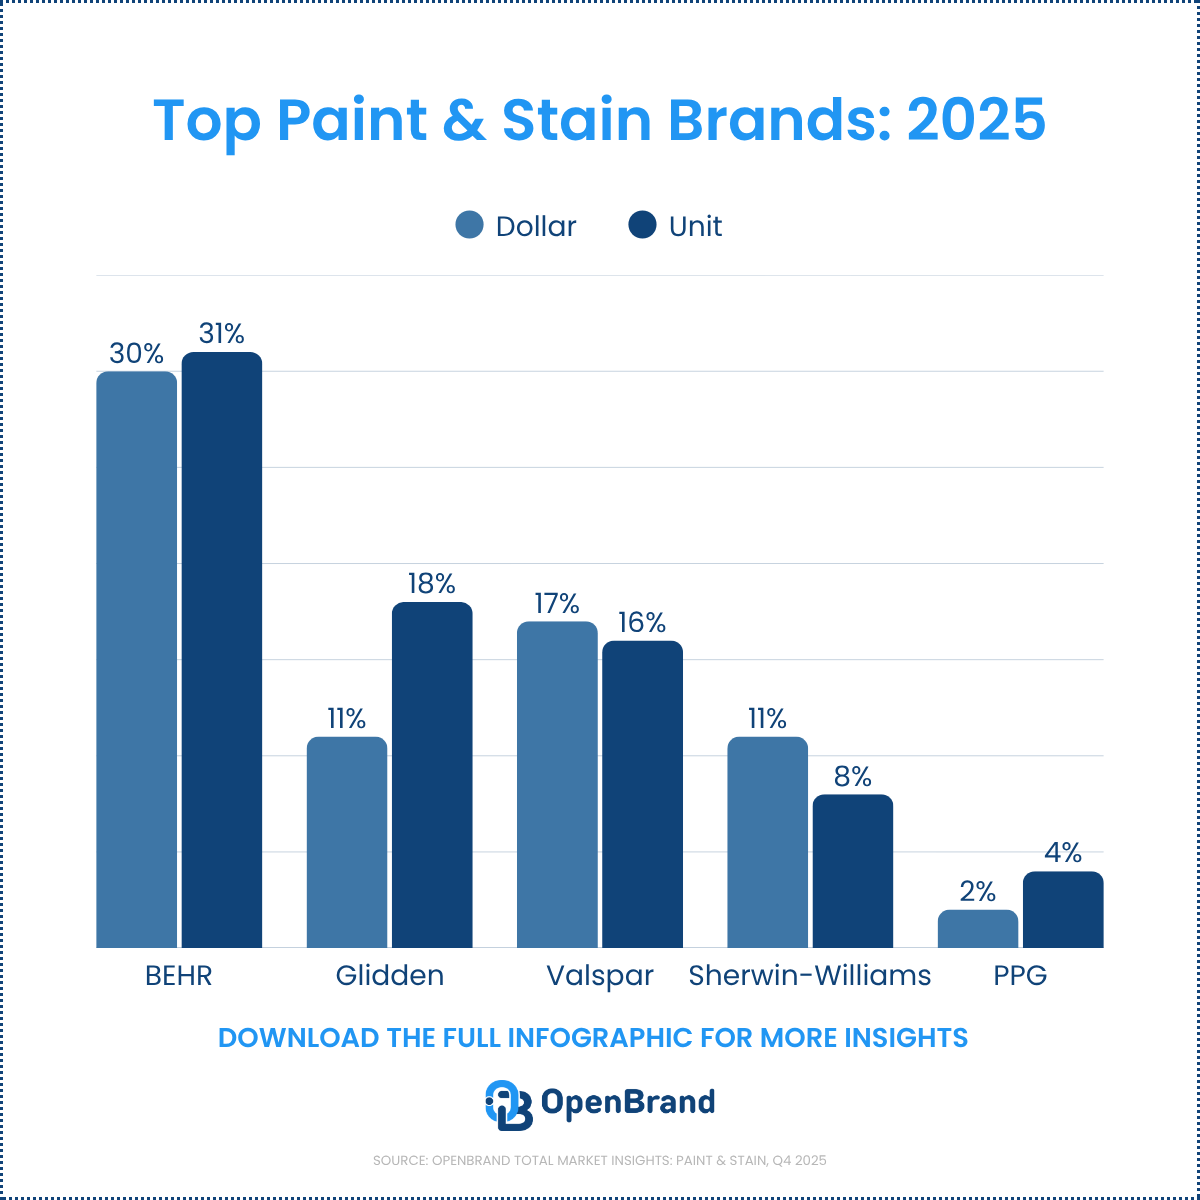
Who leads paint market share by brand in Q4 2025? The top 5 leading brands in the paint and stain market include BEHR, Glidden, Valspar, Sherwin-Williams, and PPG.
Top Paint & Stain Brands by Unit and Dollar Share
| Rank | Paint & Stain Brand | Unit Share | Dollar Share |
| 1 | BEHR | 31.1% | 30.4% |
| 2 | Glidden | 17.9% | 11.4% |
| 3 | Valspar | 16.4% | 17.4% |
| 4 | Sherwin-Williams | 8.2% | 10.8% |
| 5 | PPG | 3.6% | 1.6% |
Source: OpenBrand Paint & Stain Market Insights, Q4 2025
The unit-to-dollar spread is where the strategy shows. Glidden converts 17.9% of units into only 11.4% of dollars, while Valspar and Sherwin-Williams both index higher on dollars than units. Brands outside the top five still account for 15.9% of units, so fragmentation below the leaders remains meaningful.
For more insights into top paint and stain brands, share trends, product launches, and competitive positioning, download the full infographic.
OpenBrand’s Paint & Stain Trend Insights
BEHR leads on both units and dollars, which is the strongest position in the category and reflects the value of owning the dominant retailer’s premium shelf. Glidden is running a volume-and-access strategy at a lower average selling price. Valspar and Sherwin-Williams are running mix strategies, capturing more dollars per unit sold.
At the SKU level, the winners confirm it: Glidden’s 5-gallon Pure White Base leads all SKUs at 4.4% unit share at a $25 average price, ahead of BEHR’s 1-gallon Ultra Pure White at 3% and a $47 average.
Which paint brands compete most directly?
Brand-level leakage shows who wins a shopper when the category’s top-drawing brand does not close the sale. When BEHR loses a shopper, Sherwin-Williams captures 36.4% of them, Glidden takes 18.4%, Valspar 16.1%, Benjamin Moore 6.8%, and all other brands split 12.2%.
BEHR’s closest competitor by leakage is the highest-priced national brand rather than the closest-priced one, which suggests its lost shoppers are trading up on service and color expertise instead of hunting a lower price.
Average Paint & Stain Selling Price by Brand
Which brand a consumer picks moves the ticket as much as which tier they shop, and the spread across the majors is wide.
| Paint & Stain Brand | Average Selling Price |
| Benjamin Moore | $78 |
| Sherwin-Williams | $76 |
| BEHR | $62 |
| Valspar | $57 |
| Glidden | $49 |
| PPG | $48 |
Source: OpenBrand Paint & Stain Market Insights, Q4 2025
Benjamin Moore and Sherwin-Williams sell at roughly 1.5 times Glidden and PPG, which is the clearest read on how the category’s premium and value tiers are actually priced at retail.
OpenBrand’s Paint & Stain Trend Insights
Rising net price with flat promotional support and volume still anchored under $100 is a squeeze, not a premiumization story. Consumers are protecting ticket size by buying smaller quantities, choosing base-tier product lines, or delaying rooms rather than by trading up. Brands holding price should expect volume pressure at the entry tier. Brands with a credible good-better-best ladder can defend units by making the step-up justify itself on coverage and durability rather than on discount.
How much do consumers spend on paint and stain?
Demand still sits at the bottom of the price ladder, but the ladder itself moved up during the second half of 2025.
Paint & Stain Market by Price Range (Unit Share)
| Price Range | Share of Units |
| $0 to $49 | 32.7% |
| $50 to $99 | 25.1% |
| $100 to $149 | 14.7% |
| $150 to $199 | 12.3% |
| $200+ | 15.2% |
Source: OpenBrand Paint & Stain Market Insights, Q4 2025
Nearly 58% of units sold for under $100 per ticket. At the same time, category average net price per gallon climbed from $48.47 in July to a $55.23 peak in November before settling at $54.02 in December, while average discount depth narrowed from 23.8% in October to 19.3% in December.
Source: OpenBrand Paint & Stain Market Insights, Q4 2025
Purchase drivers reinforce a value-first market
Price matters, but it is not what consumers say decides the brand.
Purchase Drivers: Why Consumers Choose a Paint Brand
| Driver | Share |
| Quality product | 46.6% |
| Good brand name | 37.9% |
| Previously owned brand | 34.9% |
| Competitive price | 31.7% |
Source: OpenBrand Paint & Stain Market Insights, Q4 2025
The leading trigger for entering the market is routine maintenance or minor repair at 44.7%, followed by redecorating at 27.6%.
OpenBrand’s Paint & Stain Trend Insights
Quality, brand name, and prior ownership all rank ahead of competitive price, which puts coatings in rare company among value-concentrated durables categories. A failed paint job costs a weekend, not just a return. That gives established brands real pricing latitude and makes repeat purchase the most efficient growth lever in the category:
- 34.9% of buyers name prior ownership as a reason to buy again
- maintenance-driven demand means shorter, more frequent purchase cycles
- shelf adjacency to primer, tape, and applicators reinforces the same brand choice
Product strategy is diverging across brands
Shelf and innovation data separate the leaders further. OpenBrand tracked 5,217 total category placements across retailers in Q4 2025:
- Glidden holds the largest share of shelf at 15.7%, followed by Rust-Oleum at 10.4% and BEHR at 8.5%
- Glidden also led product debuts with 23% of all new items in the category
- Benjamin Moore, Prestige, Minwax, and Varathane each accounted for 5% to 7% of debuts
- BEHR launched 4% of category debuts, despite leading share
OpenBrand’s Paint & Stain Trend Insights
Two strategies are visible, and they are close to opposites:
- flood the shelf and the launch calendar to hold access and entry-tier volume, which is Glidden’s approach
- concentrate on fewer, higher-value items and let brand equity carry conversion, which is closer to BEHR and Sherwin-Williams
Shelf share and market share are not tracking together here. Glidden nearly doubles BEHR on placements and debuts and still trails it by 13 points of unit share, which is a signal for any category manager evaluating how much space entry-tier lines should hold.
Paint & Stain Market Buyer Demographics
Older consumers still carry this category, which sets it apart from most home improvement segments. OpenBrand’s census-balanced MindShare data shows Baby Boomers and Gen X together accounting for more than 61% of purchases.
Paint & Stain Purchases by Generation
| Generation | Share of Purchases |
| Baby Boomers | 32% |
| Gen X | 30% |
| Millennials | 25% |
| Gen Z | 12% |
| Matures | 2% |
Source: OpenBrand Paint & Stain Market Insights, Q4 2025
Online vs. in-store sales trends in the paint and stain market
In-store overwhelmingly remains the top sales channel for paint purchases, accounting for 93% of all sales in Q4 2025. Only 7% of purchases were made online, among the lowest digital penetration of any category OpenBrand measures.
Source: OpenBrand Paint & Stain Market Insights, Q4 2025
OpenBrand’s Paint & Stain Trend Insights
Homeownership tenure drives coatings demand, so the age skew is structural rather than a temporary swing. It also reinforces why the channel stays physical: color matching, tinting, and sheen decisions are hard to make on a screen. Millennials at 25% are the group to watch. As they take on more maintenance projects, brands that establish preference now inherit decades of repeat purchases in a category where 35% of buyers cite prior ownership.
What this means for the paint and stain market
The latest paint and stain market data describes a category with stable demand and very little room to maneuver.
- Retail share is concentrated, so brand growth runs through two accounts and their line reviews
- Half of Home Depot’s lost shoppers go to Lowe’s, making promotional response between the two the fastest lever on share
- Net prices rose while volume stayed under $100 per ticket, pressuring entry-tier units
- Quality and brand name outrank price as brand selection drivers, protecting established players
- Shelf presence is not converting to share for every brand, which makes assortment productivity the sharpest question heading into 2026
Together these forces define the current direction of the paint and stain market and where the greatest opportunities for growth may exist moving forward.
Want the Full Paint & Stain Market Report?
The trends highlighted here represent only a portion of the latest paint and stain market data available through OpenBrand. Download the full infographic to explore deeper insights into:
- paint market share by brand and retailer
- SKU-level share winners and pricing
- retailer draw, close, and leakage performance
- average selling price by brand
- net price and discount depth by month
- share of shelf and product debut activity
- consumer purchase drivers and demographics
FAQ: Paint & Stain Market Trends
Which retailer has the highest paint market share?
According to OpenBrand’s modeled MarketShare data, Home Depot leads paint and stain retailer unit share at 58.5% in Q4 2025, ahead of Lowe’s at 35.4% and Ace Hardware at 6.1%.
What are the top paint brands right now?
BEHR, Glidden, Valspar, Sherwin-Williams, and PPG lead the category, with BEHR holding 31.1% unit share according to OpenBrand’s Q4 2025 MarketShare data.
How much do consumers spend on paint and stain?
According to OpenBrand’s Q4 2025 MarketShare data, tickets under $50 account for the largest share of units at 32.7%, average net price landed at $54.02 per gallon in December, and average selling price by brand ranges from $48 for PPG to $78 for Benjamin Moore.
What is driving paint and stain purchases?
According to OpenBrand’s MindShare consumer insights survey data, routine maintenance or minor repair is the leading purchase trigger at 44.7%, while quality product at 46.6% is the top reason consumers choose a brand.
