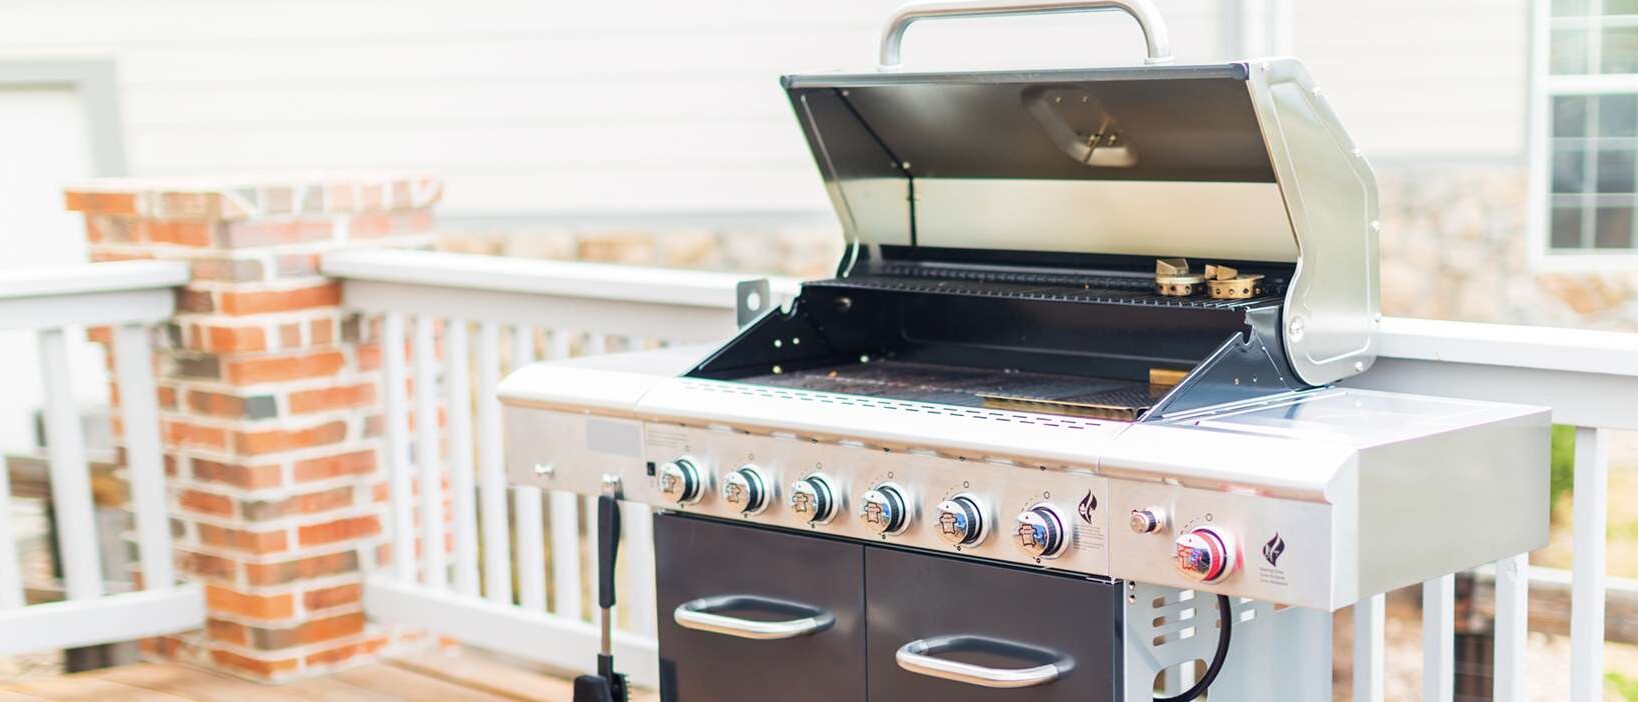
With grilling season upon us, let’s look back on how consumers prepared for the warmer months over the last year, diving into the details on Barbecue Grill market data and purchase insights — including the who, what, where, when, how, and why.
Read on to discover some of the key data insights from our free US Barbecue Grills market rankings infographic (download now!).
SOURCE: All data insights in this article cover the rolling four quarter period ending March 2024 within the OpenBrand MindShare Total US Total Barbecue Grill product category. Contact us to get the latest data. The Total Barbecue Grill product category is an aggregate of grill types consisting of: Grills (65%), Griddle Grills (27%), and Smokers (7%).

Who are the top Barbecue Grill retailers by market share?
As of March 2024, the top five retailers for Barbeque Grills are Walmart, Home Depot, Lowe’s, Amazon, and Ace Hardware.
The leading retailer shifts when looking at either unit or dollar share. Let’s look at the top three for each — and download the infographic to see more.
Barbeque Grill Retailers: Unit Share Winners
Walmart leads all other Barbeque Grill outlets in units sold with 26% share, and no significant change compared to last year.
Home Depot has the next highest unit share at 19%, also with no significant year-over-year change. In third place is Lowe’s with 17% — down nearly 1 point from last year, continuing a three-year downward trend.
Does a 1% shift in share seem small? Look at it in context. The Barbeque Grill market was valued at more than $5 billion in 2023. Meaning a 1% drop in share denotes a $50 million loss.
Barbeque Grills Retailers: Dollar Share Winners
In dollar share, Home Depot won the greatest share of the Barbeque Grill market with 22%. Lowe’s comes in at a close second with 20% share. Walmart’s dollar share is 15%. For all three retailers, share remained mostly unchanged over the past two years.
Outlet Draw Rates
Looking at our top three retailers, how well did they draw in consumers shopping for Grills?
Walmart saw the highest draw rate, with 35% of all consumers who purchased a Barbeque Grill in the last year shopping at Walmart before final purchase. Notably, Walmart closed with 73% of those shoppers, claiming the highest closing rate of all the top Barbeque Grill retailers. Meanwhile, Home Depot drew in 34% of Grill shoppers and Lowe’s drew in 32%.
Download the infographic to see draw and close rates for all top five retailers.
Who leads the Major Home Appliances market share by brand?
As of March 2024, the top five brands for Barbeque Grills were Weber, Blackstone, Traeger, Char-Broil, and PitBoss. Let’s look at how the top three brands shift based on unit and dollar share.
Barbeque Grill Brands: Unit Share Winners By units sold, the most popular US Barbeque Grill brand was Weber with 19% share, followed by Blackstone (12%), and Char-Broil (8%).
Are Barbeque Grills brands seeing a trending decline in popularity?
While top Barbeque Grill brands like Weber and Char-Broil have historically led brand share, the same leaders have experienced a steady decline over the past four years. More specifically, Weber lost 2.4 points and Char-Broil 1.4 points versus a year ago. Additionally, both are down compared to 4QE March 2020. Weber is directionally down from 2020, with a 32% change. Char-Broil is directionally down from 2020 as well, with a 60% change.
Meanwhile, more recent market additions such as Blackstone have significantly increased in the past four years. As of March 2024, Blackstone is up 3.4-unit share points year-over-year, overtaking Char-Broil for the second most popular brand.
Barbeque Grills Brands: Dollar Share Winners
In dollar share, Weber remains the Barbeque Grill brand leader with 21% share. However, Weber saw a continued downward trend for the past year, losing 3% share since March 2023.

As seen with unit share, Blackstone gained share this year, coming in as the second most popular Barbeque Grill brand with 13%. This put Blackstone ahead of Traeger (10%) and Char-Broil (6%) — who both saw a loss of 1 percentage point compared to the same time last year.
Blackstone’s rise in share is likely attributed to the growth of griddles, a space in which Blackstone is the predominant brand.
Brand Consideration Rates
What percent of consumers considered the top brands before making their purchase?
- Weber — 25% brand consideration rate
- Blackstone — 15% brand consideration rate
- Char-Broil — 10% brand consideration rate
- Traeger — 8% brand consideration rate
- PitBoss — 5% brand consideration rate
Unsurprisingly, given their rise in share wins, brand consideration for Blackstone increased 4.1 points since March 2023, while brand consideration for Weber and Char-Broil decreased, down 3.4 points and 1.7 points respectively.
More Than Market Share: Other Notable Barbeque Grill Market Insights
Online vs. In-Store: How are sales trending by channel in the Barbeque Grills market?
As of March 2024, Barbeque Grills are most often purchased in a retail store, accounting for 70% of all sales.
Historically, Barbeque Grill purchases are much more likely to be made in-store, however the percentage has trended down in the past few years — declining 1.1 points from this time last year.
Other insights around online vs. in-store Barbeque Grill purchases include:
- Of consumers purchasing online, 21% have the product shipped to the store for pick-up.
- Across all purchases, made both online and in-store, 55% of consumers shopped online for grills before buying; with 39% of consumers shopping online before making a purchase in-store.
Average Price Paid: How much do consumers spend on Barbeque Grills?
As of March 2024, the average price paid across the Barbeque Grill market was $316. The average price for grills saw little change year-over-year, rising only $1 since March 2023
When looking by retailer, the average price paid shifts slightly.
Home Depot ($358) and Lowe’s ($356) have the highest average prices paid for Barbeque Grills, when compared to other top outlets. Both retailers saw a slight increase in the average prices paid for girlls this time last year.
Notably, the leading outlet by units sold, Walmart saw a much lower average price paid of only $189. Due to this lower price, the retailer only comes in third for dollar share.
Consumer Demographics: Who is the typical Barbeque Grill shopper?
Just who buys Barbeque Grills? In March 2024, the typical consumer for Barbeque Grills included the following characteristics:
- 70% of purchasers are homeowners; 28% of purchasers are renters
- 61% of purchasers are married
- 44% of purchases are made with male only involved in the shopping process; 30% of purchases are made with female only; 26% of purchases have male and female involved
- 63% of Barbeque Grill purchasers are in the generations Millennials (31%) or Gen X (32%)
- Purchases by Baby Boomers (25%) saw a decrease of 3.3 points
- Millennials (31%) and Gen Z (11%) increase in share of purchases from last year, up 1.8 points and 2.2 points, respectively
Features: What Barbeque Grill qualities most attract consumers?
The most common Barbeque Grill features found in purchased units include:
- Warming rack (34%)
- Cast iron grates (34%)
- Exterior folding side table/shelf (26%)
- Adjustable fire grate (25%)
- Enclosed cabinet (20%)

What fuel type is most popular with Barbeque Grill purchasers? Gas (43%) and charcoal (33%) are the most popular fuel types seen in Barbeque Grill purchases. However, the gas is down 1.3 points and charcoal decreases 0.9 points from last year — with electric grills rising in popularity, up 1.5 points year-over-year.
Most Barbecue Grill purchases are full-size models, accounting for 86% of gas grill purchases and 62% of electric grill purchases.
Purchase Drivers: Why are consumers making Barbeque Grill purchases?
As seen in previous years, the most mentioned reason for purchase of a new Barbeque Grill is “Old one was broken/required service.”
The top four reasons for purchasing a Barbeque Grill are:
- Old one was broken/required service (37%)
- First time purchase (20%)
- Moved to a new home (13%)
- Wanted a new one (12%)
Interestingly, “Wanted a new one” increased by 2.9 points from this time last year.
Retailer Purchase Drivers
The most mentioned reasons for purchasing Barbeque Grills at a specific store include:
- Competitive price (56%)
- Good selection of products (27%)
- Convenient location (23%)
- Previous experience with store (18%)
- Saw display in store (17%).
While not top ranked outlets, Amazon and Menards over-index for “competitive price” as the top purchase driver.
Brand Purchase Drivers
The most mentioned reasons for purchasing a specific brand of Barbeque Grill are “Competitive price” (43%), “Features desired” (31%), and “Quality product” (31%).
Outlets & Brands Shopped: Where/what else are Barbeque Grill consumers shopping?
When purchasing a Barbeque Grill, 57% of consumers shopped at only one
store before deciding, and 73% shopped for only one brand.
Download our Barbeque Grills
market infographic for all the insights
Related blogs
Prime Day 2025 for Durables: Shopper Intent, Promotions & Where to Focus
Prime Day 2025 broke the mold. For the first time, Prime Day ran four full days, spanning July 8–11, twice the usual length, and emerged as Amazon’s…
Related blogs
Ranges: 2025 Year-In-Review
Our Ranges: 2025 Year-in-Review report recaps product launches, placements, pricing and advertising…
Tablets & Detachables: 2025 Year-In-Review
Our Tablets: 2025 Year-in-Review report recaps Tablet & Detachable launches, placements,…
Printer Supplies: 2025 Year-In-Review
Our Ink & Laser Supplies: 2025 Year-in-Review report recaps printer supply launches,…
Desktops: 2025 Year-In-Review
Our Desktops: 2025 Year-in-Review report recaps Desktop launches, placements, pricing and…


