


The tire market is shifting. Between record-high U.S. tire shipments projected for 2025 and the return of steep tariffs on Chinese-made tires, supply chains are being tested and pricing pressures are mounting. Total U.S. shipments expected to top 340 million units this year and new import tariffs are already driving up prices for many consumer-favorite models.
Both brands and retailers are feeling the impact. In this post, we analyzed the latest U.S. tire market data to uncover who is winning, the factors driving change, the consumers behind the dollars spent, and how the market is evolving across channels.
For a complete breakdown be sure to download our complimentary 2025 Tire Market Infographic.
Source: OpenBrand MindShare, Tires: Total Auto/Truck per Ticket, 4Q ending Q1 2025 | OpenBrand Pricing & Promotions, Total Market Overview – Tires (US), Q2 2025. For the most recent insights or further dives into the data, please contact us.
Tire Market Snapshot & Summary
Before diving into the full results, here’s an overview of what the data reveals. These top-line stats and trends capture where the market stands and where it’s shifting as of early 2025.
| Metric | 2025 Insight | YoY Change |
| Top Brand by Dollar Share | Goodyear | –1.4 ppt ↓ |
| Biggest Brand Gainer (Units) | Continental | +0.3 ppt ↑ |
| Top Retailer by Unit Share | Walmart | +0.8 ppt ↑ |
| Retailer with Highest Close Rate | Discount Tire | 83% (flat) |
| % of Shoppers Who Start Online | 31% | +1 ppt ↑ |
| % Who Actually Buy Online | 13% | +1 ppt ↑ |
| Share of Buyers Who Forget Brand (Units) | 20.5% | – |
| Avg Tire Discount (Q2 2025) | 14% | – |
| Avg Net Price Paid (Q2 2025) | $192 | – |
Tire Brand Performance
Which brands lead in tire market share?
Goodyear remains the leading tire brand in early 2025, holding the top spot by both unit and dollar share. While its unit share declined slightly to 14.6%, it still edges out all competitors for total volume sold. Goodyear also maintains the #1 rank in dollar share at 13.9%, though that figure is down 1.4 percentage points year over year, indicating some erosion in pricing strength or product mix.
Tire Market Share by Brand
| Rank | Brand | Dollar Share (%) |
| 1️⃣ | Goodyear | 13.9% |
| 2️⃣ | Michelin | 11.7% |
| 3️⃣ | Bridgestone | 9.2% |
| 4️⃣ | Firestone | 6.5% |
| 5️⃣ | BF Goodrich | 6.3% |
Other key insights from the top-performing brands:
- Michelin follows in second place by dollar share (11.7%) but lost unit share year over year.
- Bridgestone is climbing, gaining the most dollar share among top brands (+1.3 ppt).
- Firestone has warning signs. While the company holds the third-highest unit share (7.6%), it has dropped notably in dollar share (–1.5 ppt).
- BF Goodrich remains consistent and rounds out the top five, holding steady across both unit and dollar metrics.
While Goodyear retains category leadership they did see significant loss. Meanwhile, Bridgestone saw significant gain, emerging as a key challenger and showing momentum in both shelf presence and promotional volume.
Download the full tires playbook to see the unit share percentage breakdown by tire brand.

Tire Retailer Share: Largest Retailers, Dollar Share, & Other Trends
What are the largest tire retailers in the US?
As of Q1 2025, Walmart is the top tire retailer by unit share, accounting for 15% of units sold, while Discount Tire leads in dollar share at 16%. These two retailers continue to dominate the U.S. tire market — each holding the #1 spot in one of the two most critical performance metrics.
| Rank | Tire Retailer | Unit Share (%) | Dollar Share (%) |
| 1️⃣ | Walmart | 15% | 12% |
| 2️⃣ | Discount Tire | 14% | 16% |
| 3️⃣ | Tire Store | 12% | 10% |
Other notable retailer insights include:
- Walmart saw the largest YoY gain in unit share (+0.8 ppt), while Discount Tire held steady in units but added +0.2 ppt in dollars.
- Walmart also ranks second in dollar share at 11.8%, up significantly from last year (+0.7 ppt).
- Other top players: Costco, Firestone, and Goodyear round out the top five retailers by both unit and dollar share.
- Firestone is declining: The company is the only major retailer to lose dollar share year over year (–0.4 ppt) and also declined in online market share
While Discount Tire retains its title as the highest-dollar tire outlet, Walmart’s unit growth and digital expansion position it as a volume leader in 2025.
Shopper Demographics & Channel Preference
Online vs. in-store sales trends for the U.S. tire market?
Despite the rise of e-commerce across many consumer categories, the tire market remains firmly grounded in brick-and-mortar retail. According to OpenBrand’s 2025 data, in-store remains the dominant channel, though the digital path to purchase continues to expand.
Channel Breakdown: Where Tire Sales Happen
- 77% of tire purchases are made in-store, confirming the category’s offline strength
- 13% of purchases happen online, up 1 percentage point year over year
- The remaining 10% come from other channels, such as catalogs or third-party fulfillment

Pricing Trends & Promotional Activity
What is the average price paid in the U.S. tire market?
In 2025, the industry average price paid (APP) for tires was $192.
In a category as price-sensitive as tires, understanding the relationship between shelf presence, discount depth, and net pricing is critical for both brands and retailers. As of Q2 2025, here’s how the landscape looks:
Average price paid by retailer – tire market insights
- Average net price (APP): $192
- Average discount across the category: 14%
This reflects a market still heavily reliant on promotions to move volume, especially in light of inflation concerns and tariff-induced cost pressures.
Shelf Share and Promo Strategy: Who’s Most Visible?
Michelin was the brand with the highest share of shelf at 16%, signaling broad retailer support and availability. However, shelf space alone doesn’t guarantee growth:
- Michelin and Bridgestone are tied as the top promoted brands, each responsible for 10% of total promotional activity.
Despite heavy promotion and shelf presence, Michelin lost both unit and dollar share, while Bridgestone gained dollar share (+1.3 ppt)
Tire Market: Outlet Draw-Close Rates
Walmart drew in 20.1% of tire shoppers, while Discount Tire drew 17% — the highest draw rates among all major retailers.
But when it comes to closing the deal:
- Discount Tire leads with an 83% close rate, converting nearly all of its in-store traffic.
- Walmart’s close rate trails slightly at 76%, but its high volume still drives massive total sales.
- Fewer, but loyal shoppers: Costco sees fewer shoppers overall (8% draw rate) but retains 65% of them.
- Firestone and Goodyear trail behind in traffic, but drive similar conversion rates.
High draw + high close = high sales volume. That’s why Discount Tire and Walmart continue to outpace competitors, despite their differing pricing and service strategies
Other key US tire market insights
Tire Shopper Demographics
OpenBrand’s census-balanced data paints a clear picture of the average U.S. tire buyer:
- 71% are homeowners
- 59% are married
- 63% of buyers are male, while women represent a meaningful 37% share of tire purchasers
- 66% of shoppers are over age 45, with Baby Boomers and Gen X dominating the market
- 24% of buyers are retired, a key insight for marketing targeting based on life stage
OpenBrand’s Tire Takeaway
Don’t overlook female buyers: more than 1 in 3 tire purchases involve women, yet many retail environments still default to male-oriented messaging.
Top Selling Tire Sizes
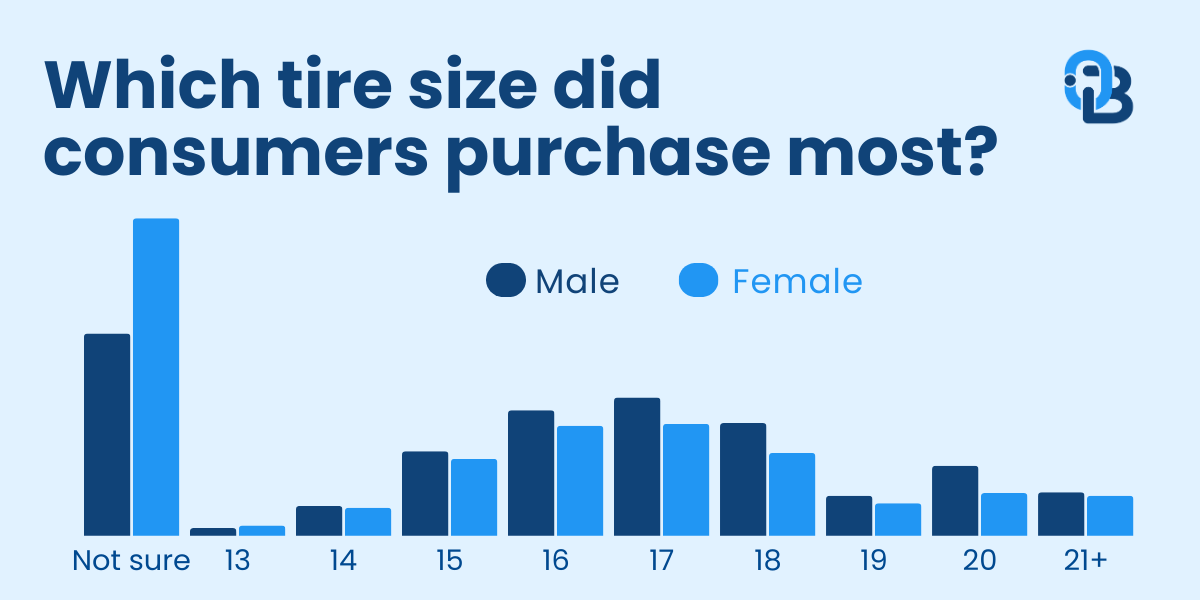
OpenBrand’s data shows that tire size—not type—is a key factor in buyer behavior. The Playbook identifies the most commonly purchased rim diameters in the U.S. market:
- 17-inch tires are the most purchased size, followed by 16″, 18″, and 15″
- 18”+ tire sizes are gaining share, driven in part by the rise of larger vehicles like SUVs and EVs
- Buyers of 19” and 20”+ tires are more likely to skew younger, with a higher incidence of Gen Z and Millennial buyers selecting larger rims
- Conversely, older consumers over-index in 15” and 16” tire purchases, indicating more traditional vehicle preferences
OpenBrand’s Tire Takeaway
Retailers and brands can use rim diameter data to align inventory with local buyer profiles — especially in regions with age – skewed populations or heavy SUV/EV adoption.
Tire Purchase Drivers
The “why” behind the buy remains consistent year over year, withprice and quality leading the decision.
- 52% of consumers say “competitive price” is the top reason for choosing a brand
- 53% say it’s the top reason for selecting a retailer
- Product quality ranks second among brand drivers (29%)
- Previous ownership and size availability round out the top purchase influences
Pricing may dominate the purchase decision, but tire size availability is a subtle yet powerful lever for conversion—especially in-store where immediacy matters.
Download the Tires Market Playbook
This is just the start. The full 2025 Tire Market Playbook delivers an even richer view into how brands, retailers, and buyers are shaping the road ahead—from market share shifts to shopper behavior, pricing patterns, and promotional strategy.
Download the exclusive playbook below to access the complete dataset and uncover opportunities to grow your share in a competitive, price-sensitive market.

Looking for insights in another category—or ready to explore how OpenBrand can help your business win at retail? Let’s talk. We’ll show you what’s happening in your space, and what to do next.