




Latest Update: June 2026
The small appliance market heading into 2026 is defined by three forces pulling against each other:
- Value-driven purchasing concentrated in the sub-$200 range
- A retail channel split sharply between two dominant players
- A brand hierarchy where unit leadership and dollar leadership no longer tell the same story
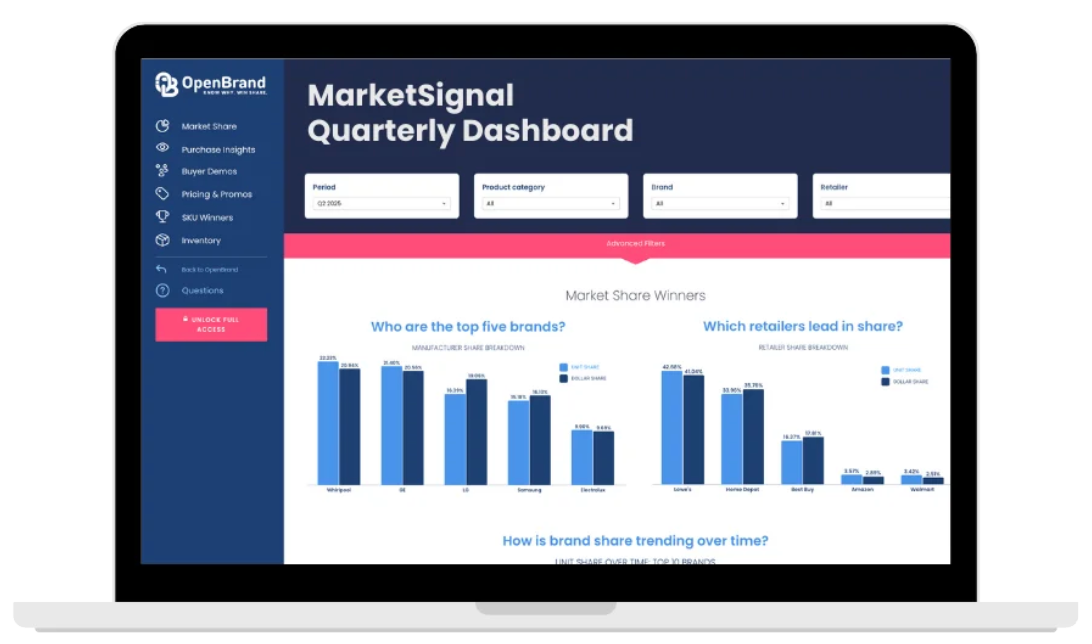
Using data from OpenBrand’s latest Small Appliances Total Market Insights report [download now], we analyzed how consumers are shopping the category, where retailers are drawing and closing shoppers, and which brands are converting shelf presence into share.
The small appliance market referenced here covers an aggregate of categories including air fryers, blenders, coffee makers, mixers, and vacuums, reflecting how consumers shop across the small appliance category today.
While the data reflects Q4 2025, the trends below represent the current direction of the small appliance market heading into 2026.
SOURCE: All data insights in this article cover Q4 2025 data within the OpenBrand Total Market Insights Small Appliances category. This includes air fryers, blenders, coffee makers, mixers, and vacuums.
Summary: Small Appliance Market Key Stats
- Walmart is the #1 retailer for small appliances, followed by Amazon
- Ninja is the top small appliance brand by unit share at 33%, and its dollar share climbs to 47%
- Products priced $199 or less account for roughly three-quarters of unit sales
- Replacement demand drives 52% of purchases, with an old product breaking as the leading trigger
- Price and quality remain the top brand purchase drivers
- Millennials (Gen Y) are the largest small appliance buyer segment
- Online accounts for 39% of purchases, and retail competition is concentrated between Walmart and Amazon
Who are the top retailers in the small appliance market?
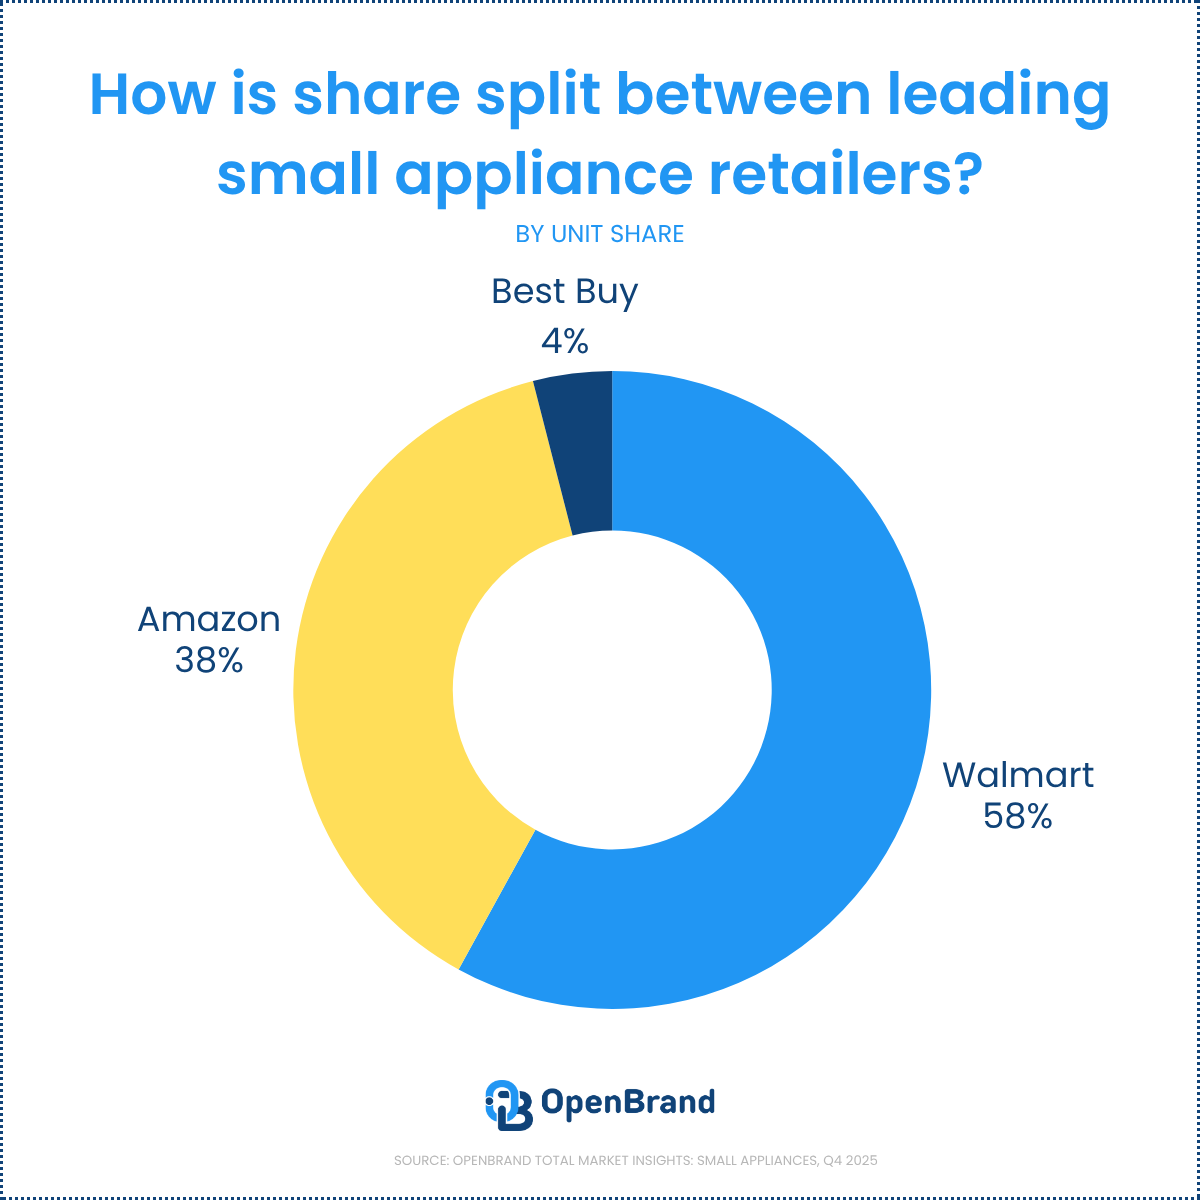
Among OpenBrand’s Q4 2025 small appliance market share panel, Walmart leads the market decisively, and Amazon holds a strong second position.
Q4 2025 Top Retailers in the Small Appliance Market (Unit Share)
| Rank | Small Appliance Retailer | Unit Share (%) |
| 1 | Walmart | 58% |
| 2 | Amazon | 38% |
| 3 | Best Buy | 4% |
At the time of analysis, OpenBrand’s retailer market share data looked across a panel of key retailers, including Walmart, Amazon, and Best Buy. At the time of publication (July 2026) more retailers have been added to our panel, with more coming in Q3 2026. The latest data and additional retailer set is available by subscription. Download the infographic to see all the free market insights or contact us today to see the latest data.
Source: OpenBrand Small Appliances Total Market Insights, Q4 2025
OpenBrand’s Small Appliance Trend Insights
The small appliance market is heavily concentrated within retailers like Walmart and Amazon, making shelf placement, pricing, and conversion efficiency the deciding factors for a brand’s unit share. This is exactly the kind of shift OpenBrand’s modeled MarketShare data is built to track across the full category.
For brands, being on the shelf is not the same as winning it. In a channel this consolidated, assortment decisions at major retailers like Walmart and Amazon can make or break a category strategy.
For more small appliance retailer insights, including leakage and conversion trends, download the full infographic.
How are small appliance retailers competing for shopper conversion?
Walmart both draws the most small appliance shoppers and closes them at the highest rate, but Amazon converts high-intent shoppers nearly as efficiently. In a concentrated channel, the ability to close a shopper who is already in the aisle matters more than raw traffic.
Q4 2025 Small Appliance Retailer Draw & Close Rates
| Small Appliance Retailer | Draw Rate | Close Rate |
| Walmart | 50% | 75% |
| Amazon | 31% | 70% |
| Target | 21% | 50% |
| Best Buy | 7% | 55% |
| Home Depot | 6% | 46% |
Source: OpenBrand Small Appliances Total Market Insights, Q4 2025
Walmart leads in both drawing and converting shoppers, while Amazon stays close on close rate. Smaller players like Best Buy, Target, and Home Depot have a limited draw, but convert roughly half of the shoppers they attract.
OpenBrand’s Small Appliance Trend Insights
Consumers shopping for small appliances compare price, quality, features, and retailer experience before buying. Traffic alone does not win the category. Retailers that convert efficiently, and reduce the number of shoppers who walk without buying, are better positioned to hold share.
Who wins when a retailer loses a shopper?
When Walmart fails to close a small appliance shopper, Amazon captures the largest share of those lost shoppers, followed closely by Target. OpenBrand’s proprietary retail draw, close, and leakage analysis shows a 25% walk rate for Walmart shoppers, and it reveals exactly where that demand goes.
Where Walmart’s Lost Small Appliance Shoppers Go (Leakage)
| Retailer Capturing Lost Shoppers | Share of Leaked Shoppers |
| Amazon | 33% |
| Target | 29% |
| Best Buy | 8% |
| Home Depot | 4% |
Source: OpenBrand Small Appliances Total Market Insights, Q4 2025
OpenBrand’s Small Appliance Trend Insights
Consumers rarely commit to a single retailer before buying a small appliance. This behavior makes final-stage conversion and shopper retention central to protecting market share, especially for the two retailers absorbing the bulk of leaked demand.
Which brands lead small appliance market share?
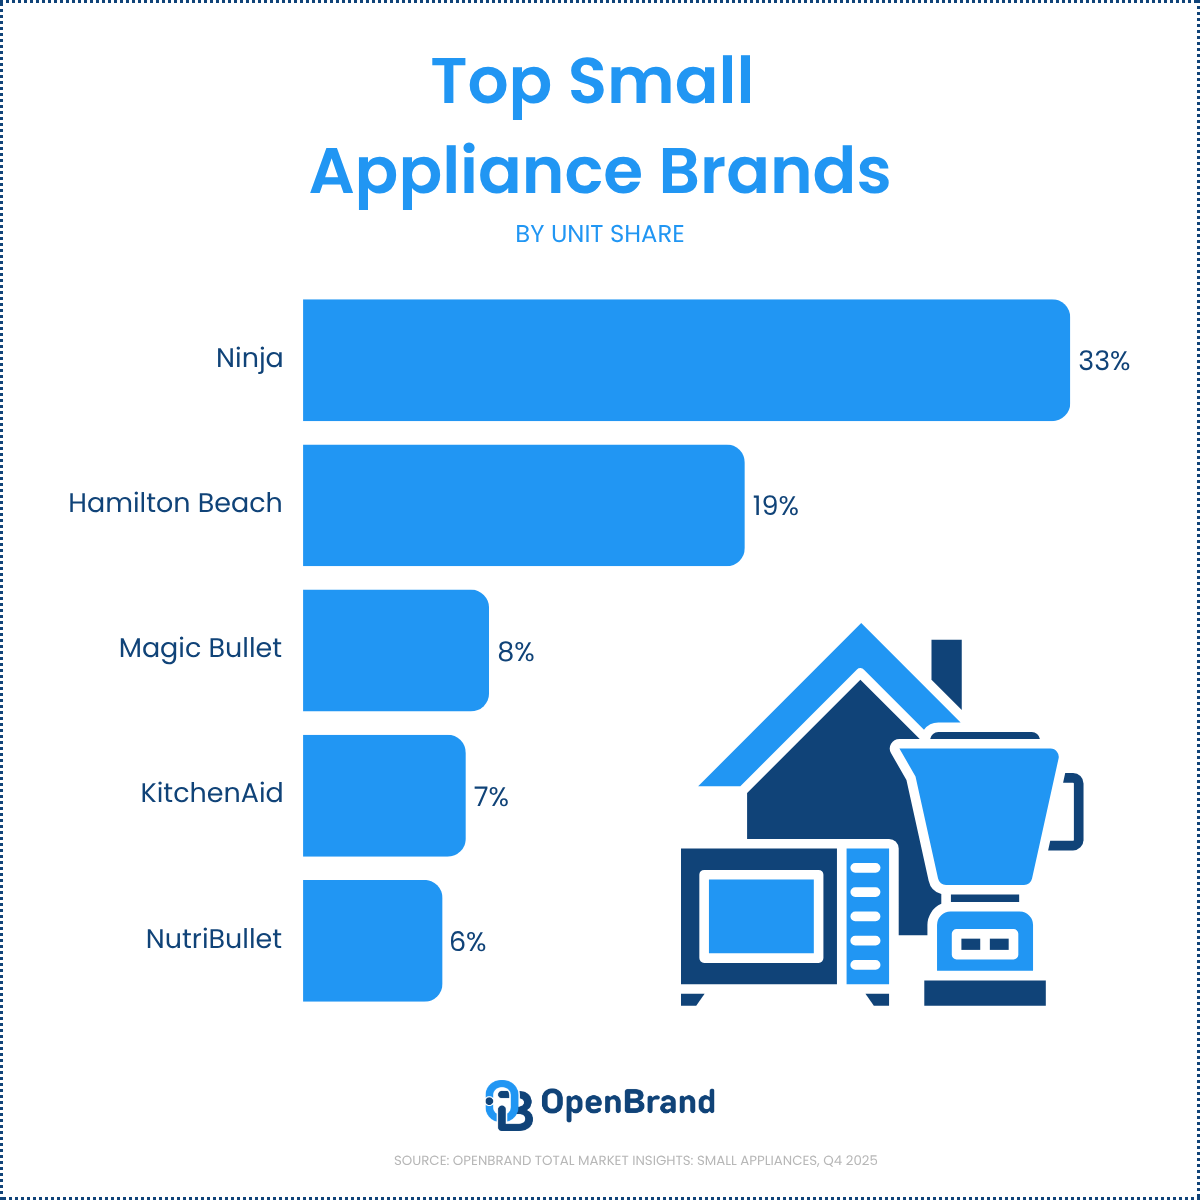
According to OpenBrand’s MarketShare data, Ninja leads the small appliance market on both unit and dollar share, and the gap between the two tells the real story. Ninja converts a 33% unit share into a 47% dollar share, while Hamilton Beach wins volume at value pricing but trails sharply in revenue.
Q4 2025 Top Small Appliance Brands by Market Share
| Rank | Small Appliance Brand | Unit Share |
| 1 | Ninja | 33% |
| 2 | Hamilton Beach | 19% |
| 3 | Magic Bullet | 8% |
| 4 | KitchenAid | 7% |
| 5 | NutriBullet | 6% |
Source: OpenBrand Small Appliances Total Market Insights, Q4 2025
At the SKU level, the highest-share individual products skew to value pricing. Hamilton Beach’s model 50180 leads with a 4.0% unit share at a $26 average price, followed by the Ninja BE200 at 3.7% and a $50 average price.
For more small appliance brand insights, including share of shelf and product launch trends, download the full infographic.
OpenBrand’s Small Appliance Trend Insights
Ninja’s dominance reflects a brand that has translated feature-forward positioning into premium pricing power. Winning nearly half of category dollars on a third of the units is the clearest signal in the data.
Hamilton Beach plays the opposite game, converting a strong 19% unit share into just 9% of dollars by anchoring the value tier. NutriBullet is the only top-five brand whose dollar share exceeds its unit share, a sign of favorable mix.
What is driving small appliance purchases?
Replacement demand is the leading reason consumers make small appliance purchases, with 52% of purchases triggered by an old product breaking. Once shopping, price is the top brand purchase driver, followed by quality.
Beyond brand attributes, the strongest product trigger is a broken predecessor at 52%, while first-time purchases account for 13% of demand.
Q4 2025 Top Purchase Drivers for Small Appliance Brands
| Brand Driver | Share |
| Price | 43% |
| Quality | 34% |
| Features | 30% |
| Name Brand | 27% |
Source: OpenBrand Small Appliances Total Market Insights, Q4 2025
OpenBrand’s Small Appliance Trend Insights
Because the category is so heavily replacement-driven, consumers arrive with practical intent and a clear reference point: the product that just failed. That raises the importance of competitive pricing, trusted quality, and easy availability at the two retailers that dominate the channel.
Brands that communicate durability and value are best positioned to capture a shopper who is already motivated to buy.
How is small appliance product strategy diverging across brands?
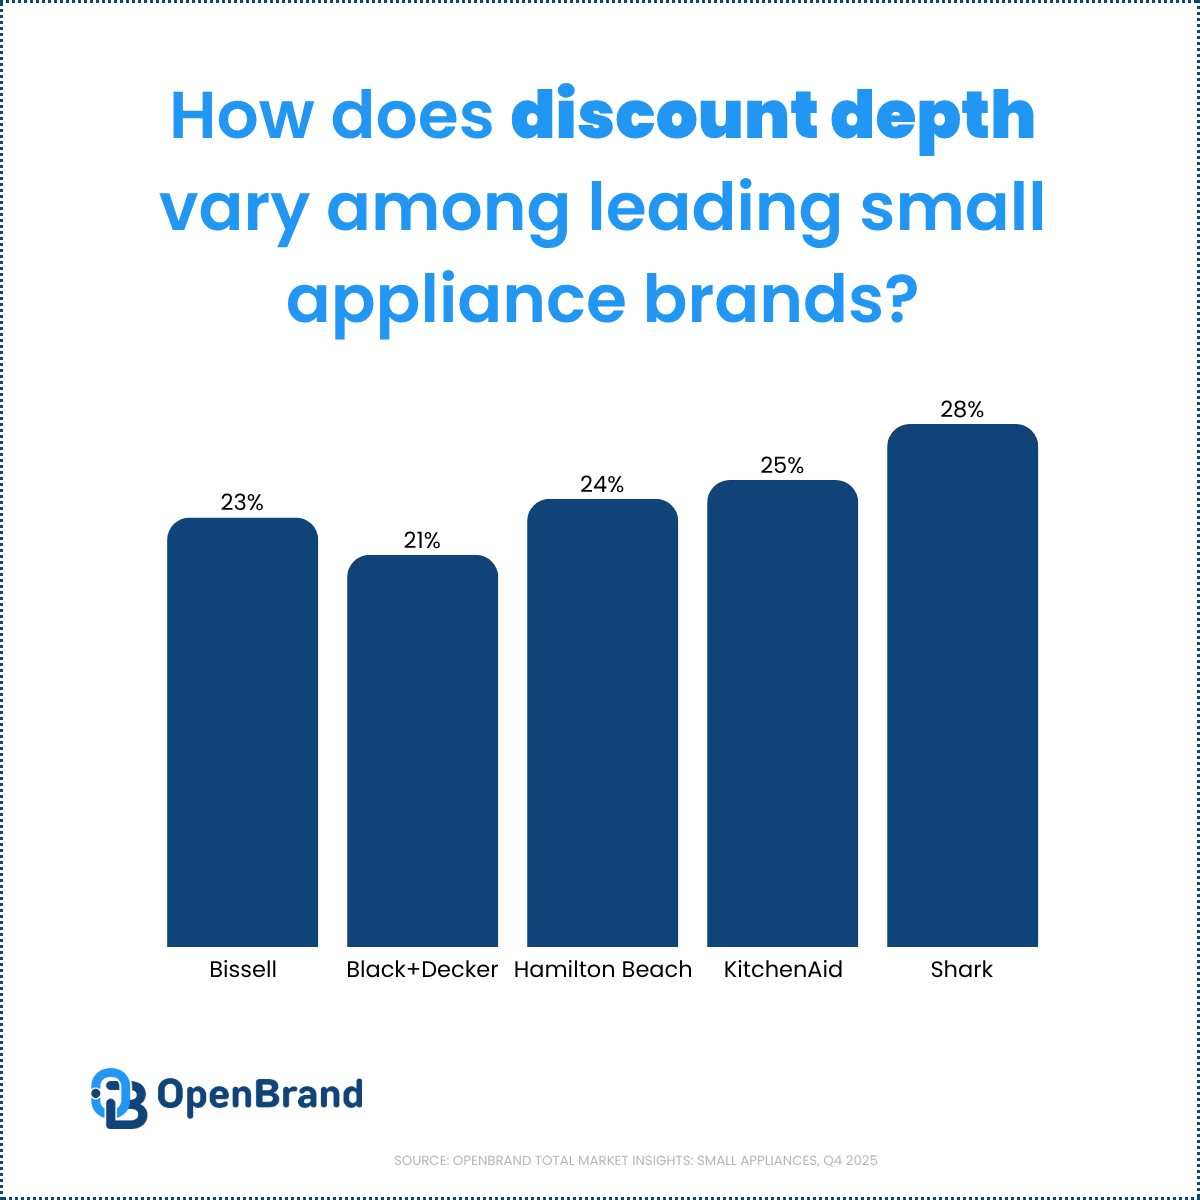
OpenBrand’s competitive intelligence data tracked 6,591 total category placements across retailers in Q4 2025. Among these placements, the data shows brands are splitting into two strategies: protecting margin through premium pricing, or driving visibility through aggressive promotion and product launches.
On share of shelf, Shark leads at 7%, followed by Hamilton Beach at 6%, with the rest of the field fragmented across dozens of brands each holding low single digits.
Brand Strategy Signals in Small Appliances (Q4 2025)
| Brand | Share of Shelf | Discount Depth |
| Hamilton Beach | 6% | 24% |
| KitchenAid | 4% | 25% |
| Shark | 7% | 28% |
| Bissell | 4% | 23% |
| Black+Decker | 4% | 21% |
Source: OpenBrand Small Appliances Total Market Insights, Q4 2025
OpenBrand’s Small Appliance Trend Insights
Hamilton Beach and KitchenAid are the most active on new product debuts, together accounting for nearly three-quarters of launches among the tracked brands.
Notably, despite its market share leading position, Ninja fell below the top five brands with the highest share of shelf, staying disciplined on discounting while continuing to introduce products.
The takeaway for category managers: shelf presence is fragmented, so a brand’s assortment and launch cadence matter as much as headline market share. For teams heading into a product line review, that fragmentation is where assortment decisions are won or lost.
Who is buying small appliances?
Younger and middle-aged consumers drive the small appliance market, with Gen Y and Gen X together accounting for more than half of purchases. OpenBrand’s census-balanced data provides a snapshot of who is shopping the category today.
Q4 2025 Small Appliance Purchases by Generation
| Generation | Q4 2025 Unit Share |
| Gen Z (born after 1996) | 20% |
| Millennials (born 1981–1996) | 33% |
| Gen X (born 1965–1980) | 28% |
| Baby Boomers (born 1946–1964) | 18% |
| Matures (born before 1946) | 1% |
Source: OpenBrand Small Appliances Total Market Insights, Q4 2025
OpenBrand’s Small Appliance Trend Insights
Small appliance demand is more evenly distributed across generations than most durables categories, with Gen Y, Gen X, and Baby Boomers each holding roughly a quarter of purchases. That breadth reflects how essential these products are across every household stage, from first-time buyers to replacement shoppers refreshing a vacuum or floor care product.
As Gen Z grows its share, brands and retailers will keep adapting toward digitally informed, price-sensitive shopping behavior, reinforcing the value orientation already visible in the pricing data.
What this means for the small appliance market
Small Appliances in 2026
The latest small appliance market data points to a category with steady, replacement-led demand and intense competition on execution.
Several trends are shaping the market at once:
- Demand is concentrated in value-oriented price tiers below $200
- Retail share is heavily led by Walmart and Amazon, making conversion and leakage decisive
- Brand leadership splits between volume players and premium players, with Ninja capturing outsized dollar share
- Product launches and shelf strategy are the levers brands are pulling to gain visibility
- Younger buyers are steadily reshaping the long-term direction of the category
Together, these forces define the current direction of the small appliance market and where the greatest opportunities for growth may exist moving forward.
Want the Full Small Appliance Market Report?
The trends highlighted here represent only a portion of the latest small appliance market data available through OpenBrand.
Download the full infographic to explore deeper insights into:
- small appliance market share
- top brands and rankings
- retailer performance and leakage
- pricing and promotions
- product launches and SKU trends
- consumer shopping behavior
Access the Small Appliance Total Market Insights Infographic
Get the complete Q4 2025 picture: brand and retailer share, draw and close rates, price-band breakdowns, SKU winners, share of shelf, discount depth, and product debuts in one view.
Want the data for a specific category, brand, or retailer? Contact us today!

FAQ: Small Appliance Market Trends
Which brand has the largest small appliance market share?
According to OpenBrand’s Q4 2025 data, Ninja leads the small appliance market with a 33% unit share and a 47% dollar share, well ahead of Hamilton Beach in second.
Which retailer has the largest small appliance market share?
According to OpenBrand’s modeled MarketShare data, Walmart leads small appliance retailer unit share at 58%, followed by Amazon at 38% and Best Buy at 4%.
What price range dominates the small appliance market?
According to OpenBrand’s Q4 2025 data, products priced $199 or less account for roughly three-quarters of unit sales, confirming a value-driven category.
What is driving small appliance purchases?
According to OpenBrand’s MindShare consumer survey data, replacement demand is the leading trigger, with 52% of purchases prompted by an old product breaking. Price and quality are the top brand purchase drivers.
Where do consumers buy small appliances?
According to OpenBrand’s Q4 2025 data, 39% of small appliance purchases happen online, and the channel is concentrated between Walmart and Amazon.