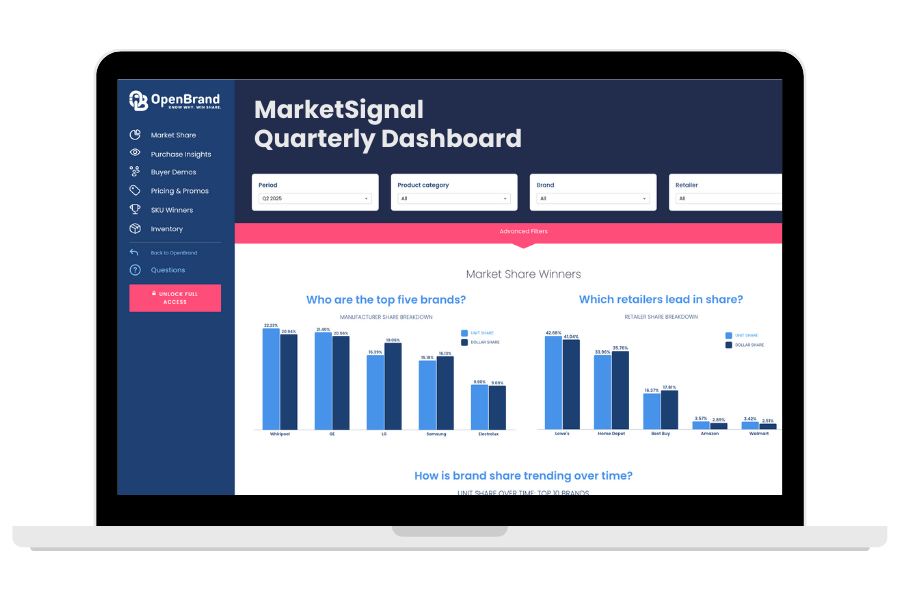
What are the best brands and outlets in the US Consumer Electronics market share? – An infographic
TraQline answers the “who”, “what”, “where”, “when”, “why”, and “how” for consumer electronics market shares. Our quarterly survey will help you understand who’s buying consumer electronics, where they’re buying them, and what drives their decisions. Our Consumer Electronics Market infographic will help you answer the following questions about the US Consumer Electronics market and how it is changing…
Who is leading sales in the Consumer Electronics market?
Our infographic will give you greater details, but for now, here’s what you need to know about the market leaders for Consumer Electronics:
- Best Buy takes the lead for dollar share in the Consumer Electronics market.
- Samsung consumer electronics win almost 14% of consumer dollars.
- Apple stores outdo Costco for dollar share, at 8% versus Costco’s almost 5%.
How much do consumers spend on Consumer Electronics?
When buying Consumer Electronics, the industry average price paid for these products is $284. However, the average amount spent at different retailers can vary. For example:
- Shoppers buying consumer electronics at Apple spend $704 on average.
- Shoppers at Amazon, on the other hand, spend about $198 on average.
What demographic is buying Consumer Electronics?
Just who buys Consumer Electronics? TraQline’s census-balanced respondent pool has given us insights like:
- Almost half of all purchasers are men shopping alone (49%).
- The South over-indexes on Consumer Electronics purchasers: 40% live in that region.
Consumer Electronics Market – Online Sales Trends:
With 43% of Consumer Electronics product purchases being made online, it’s a good idea to keep track of online sales trends. Here’s just some of the trends that TraQline has uncovered:
- 67% of buyers do at least some shopping for Consumer Electronics online.
- The average price paid for products at Apple is higher online than it is in-store.
Consumer Electronics Market Share Facts:
Curious about other information TraQline’s survey has uncovered? Here’s another preview for you:
- Walmart and Best Buy had the highest draw rates of all Consumer Electronics retailers.
- The average price paid for Consumer Electronics ($284) is up 2% compared to last year’s average price.
- When Consumer Electronics buyers shop both Sony and Samsung, Sony wins 54% of the time.
To see everything we’ve included on our infographic, fill out the form below and download your own copy:
Related blogs
Explore Our Data

Free Quarterly Dashboards
Explore category-level data dashboards, built to help you track category leaders, pricing dynamics, and consumer demand – with no subscription or fee.
Related blogs
Consumer Price Index: Durable and Personal Goods | January 2026
This is the February 2026 release of the OpenBrand Consumer Price Index (CPI) – Durable and…
Business Printer Hardware: 2025 Year-In-Review
Our Business Printers: Printer Hardware 2025 Year-in-Review report recaps product launch activity,…
Headphones: 2025 Year-In-Review
Our Headphones: 2025 Year-in-Review report recaps launches, placements, pricing and advertising and…
Refrigerators: 2025 Year-In-Review
Our Refrigerators: 2025 Year-in-Review report recaps product launches, placements, pricing and…


