


Inside Best Buy’s Q1 FY 2026 Earnings
Tariff Turbulence Impetus for Lowering Guidance
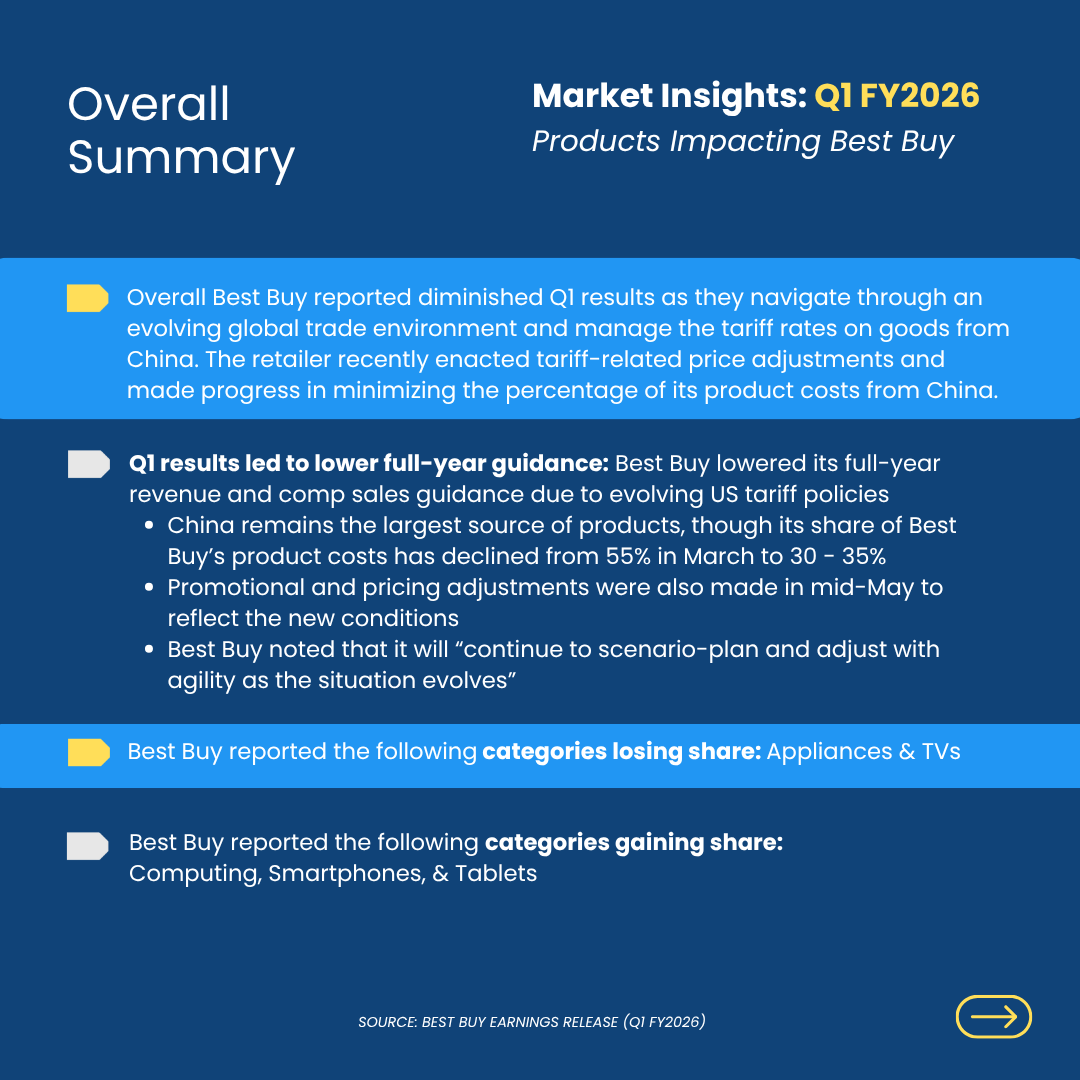
Best Buy made several strategic realignments following the Q1 FY 2026 earnings with the biggest result: lowering full-year guidance. Tariff pressures and slowing consumer demand are playing a key role in how many retailers are managing their overall businesses.
Key Q1 FY 2026 Best Buy Earnings Results
- Revenue: $8.8 B (-0.9% YoY)
- YOY Sales Growth: -0.9%
- YOY Comps: -0.7%
- Diluted EPS: $0.95
How did core durables categories impact Best Buy’s performance?
In this blog post, we focus on Best Buy’s market share across major appliances and consumer electronics, highlighting which products and brands impacted share as well as how tariff changes significantly influenced pricing and promotional strategies for the CE powerhouse. We also take a look at where they are breaking ground in the outdoor power equipment and power tools markets.
Best Buy Earnings
Q1 FY2026 Performance & Best Buy Market Share Trends
SWIPE TO SEE FULL REPORT, CLICK TO EXPAND SLIDES


Best Buy Earnings: Major Appliances Share
Discounts Were Not Enough
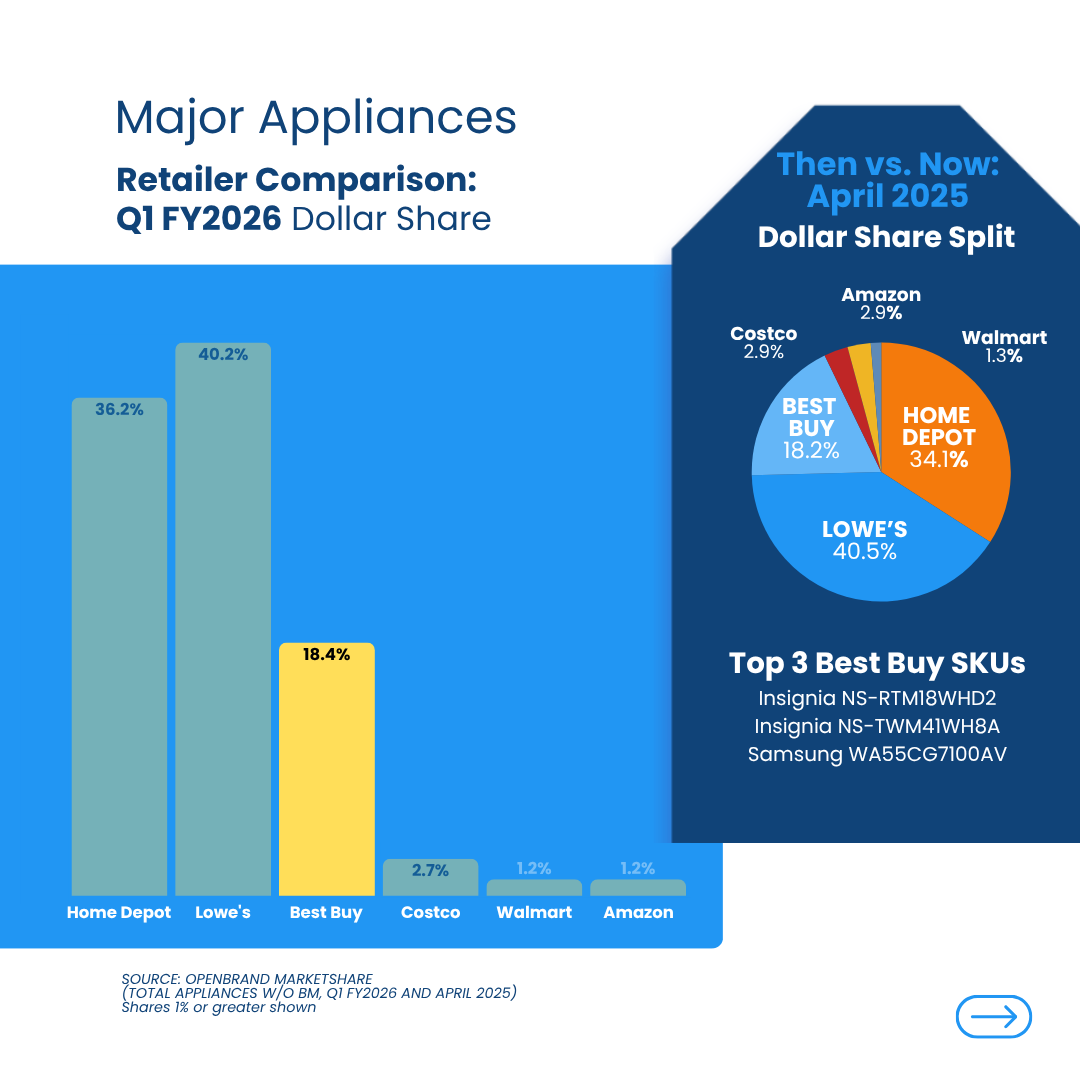
In Q1, Best Buy lost -2.1 ppt in dollar share and -1.0 ppt in unit share YOY in major appliances, despite the aggressive 8% average discount strategy maintained throughout the quarter.
Promotional levels remained consistent with 39% of the assortment on sale, but results were less than favorable.
Best Buy still holds the third place position behind home improvement big boxes Lowe’s and Home Depot with nearly an 18 ppt gap between them for dollar share for major appliances.
Top Major Appliance Retailers: Q1 2025 Dollar Share Split
- Lowe’s: 41.6%
- Home Depot: 36.1%
- Best Buy: 17.9%
- Amazon: 2.7%
- Walmart: 1.6%
Review of the top brands losing share for appliances at Best Buy, Whirlpool and GE saw the biggest declines overall across both unit and dollar share YOY.
While all but one product category lost unit and dollar share. The top product category performer in appliances at Best Buy in Q1 was bottom mount refrigerators.
Bottom mount refrigerators were the only standout performers, driving the largest share gains in both units (+0.9 ppt) and dollars (+0.6 ppt) YOY.
While top load washers underperformed in Q1 it’s worth noting they had the highest average discount YOY.
Key Takeaway
Best Buy’s Q1 appliance results reveal more than just a weak quarter but highlight a broader disconnect between promotional effort and consumer behavior. Despite steady discounting and a competitive assortment size, the retailer lost meaningful share, suggesting that shoppers weren’t persuaded by price alone.
With Whirlpool and GE seeing steep declines, it’s clear that even legacy brands could not offset soft demand and the macroeconomic impacts.
This seems to indicate a shift as consumers are becoming more selective, and increasingly expect value beyond the markdown. They are gravitating toward specific product formats (such as bottom mount refrigerators) that offer functional or premium appeal, rather than responding to promotional volume alone.
For brands, this might mean success will come from innovation and clarity in value proposition, not just presence on the shelf.
For Best Buy, it’s a signal to potentially rethink the appliance strategy, from pricing details to portfolio balance if there is any hope in closing the near 20-point share gap with Home Depot and Lowe’s.
Best Buy Earnings: Consumer Electronics Share
Share Held, Demand Faltered
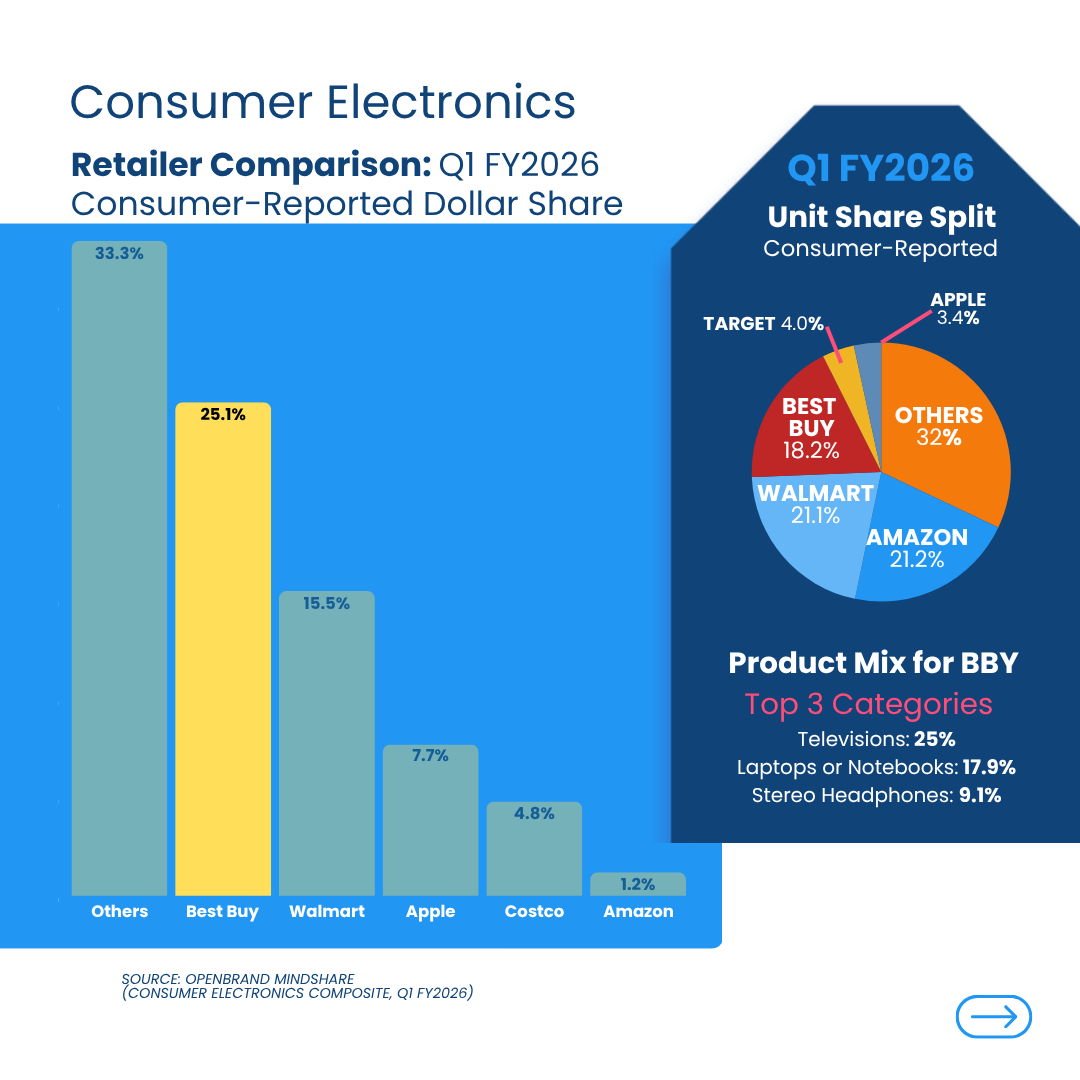
Best Buy retained 25.1% of consumer-reported CE dollar share, with leading categories like TVs, laptops, and stereo headphones. However, TVs saw no meaningful gains, despite increased promotions and a 20% average discount rate.
- Promotion Note: 64% of TV SKUs were on promo, up 10 ppt YOY
- Category Mix: 50% of SKUs priced under $1,000 with no change YOY
- Most major TV brands contributed to the increase in discounts, Insignia, Roku and Westinghouse were pushing the average higher with 5-7 point increases holding a 29% average discount.
Computing: Assortment-Led Strength
While TVs were down, computing was a bright spot for Best Buy in Q1, helping to drive overall growth for the retailer across CE. Best Buy holds the third-largest notebook assortment (11% of market) which increased +2 ppt year-over-year, focused on high-end SKUs. Despite growing concern around tariffs, notebooks saw a drop in average net price.
- Avg. Net Price: $1,437 (down 2% YoY)
- Promoted Assortment: 37% (down 11 ppt YoY)
- Discounts: Averaged 20%, down slightly
Key Takeaway
Best Buy is staying premium in this space, prioritizing value through model selection over aggressive pricing.
Smartphones: Destination
With 19% of U.S. smartphone SKUs (+7 ppt YOY), Best Buy is second only to carriers in assortment breadth.
This is a huge advantage for the retailer as they are among the top destinations for unlocked phones and one of the only retailers offering multiple postpaid carriers (plus prepaid options), making it a beacon for AT&T, Verizon, and open market buyers. Approximately 58% of SKUs, especially unlocked and postpaid deals, were on promotion in Q1.
- Price bands from $200-$799 saw the highest saturation of promotions this year, which was also true last year, but the premium price tiers seem to be where Best Buy is pulling back focus YOY, a move that could eventually drive flagship level buyers into carrier stores directly
- Avg. Net Price: $863 (up 4% YoY), vs. $207–$378 at Target/Walmart
- 20% off was average smartphone discount in Q1 2025 (the same as last year) still ~12 points behind other major nationals like Target and Walmart, reflecting its more premium product mix
Key Takeaway
Best Buy has solidified its role as a top destination for unlocked and postpaid smartphones, offering the second-broadest assortment in the U.S. behind carriers and catering to premium, open-market buyers. Its promotional strategy remains focused on mid-tier devices, while a pullback on flagship discounts may gradually shift high-end shoppers toward carrier stores.
Tablets: Premium Push Pays Off
Tablets were a positive driver overall for Best Buy. Best Buy leads the U.S. in tablet assortment representing about 13% of market, up +4 ppt overtaking Amazon for the broadest portfolio.
- Promo Share: 50% on promotion in Q1 (+2 ppt YoY) – well ahead of Amazon and mass merchants like Target and Walmart
- Premium Shift: While Best Buy devotes ~20% of shelf space to tablets under $299, but 24% of the assortment was between $1,000–$1,499 – up +8 ppt from 16% last year. Shifts in brands like Apple rose from 47% to 61% of BBY’s tablet mix
- Best Buy’s average discount was 21%, which was driven by more aggressive Asus, Google, and Lenovo deals which rose over +9 points YOY up to 35% off
Key Takeaway
Best Buy has overtaken Amazon as the U.S. leader in tablet assortment, with a strategic shift toward premium devices,especially Apple, driving growth. While half of its tablet SKUs were on promotion in Q1, deeper discounts on brands like Asus, Google, and Lenovo helped support a broader high-end mix and stronger market position.
Best Buy Earnings: Outdoor Power Equipment & Power Tools
Niche Wins Drive Growth
Outdoor Power Equipment
Though a small player at 1.1% share, Best Buy saw unit share gains in walk-behind mowers and pressure washers. Hedge trimmers also grew in units but slipped in dollars.
- Top SKUs: Greenworks GPW1900, Worx WG743
- Category Leaders: Lowe’s 41.9%, Home Depot 36.2%, Amazon 10.0%
Power Tools
Best Buy’s 0.5% market share in power tools is minor, but growth is visible in wet/dry vacuums and power drills, with SKUs from Stanley and Worx leading sales.
- Top SKUs: Stanley SL18116P, Worx WX240L
- Category Leaders: Home Depot 47.8%, Lowe’s 24.7%, Amazon 18.0%
Key Takeaways
While Best Buy remains a niche player in Outdoor Power Equipment and Power Tools, it is gaining early traction in select categories like walk-behind mowers, pressure washers, wet/dry vacuums, and drills, signaling strategic growth opportunities led by brands like Greenworks, Stanley, and Worx.
Where Brands & Retailers Should Focus Now
- For those brands partnering with Best Buy, Q1 results underscore the need to prioritize clarity, flexibility, and alignment with shifting shopper behaviors.
- As tariffs are reshaping cost structures and promotional strategies, brands and retailers must balance agility with transparency to maintain pricing credibilty.
- Essential-use products and value-tier SKUs should take precedence, as consumers continue to weigh necessity over novelty.
- Promotional strategies must remain agile, tailored not just to calendar moments, but to macro pressures like tariffs and sourcing shifts that shape demand in real-time.
- OPE and tools categories are growth opportunities for Best Buy, despite the small but growing presence in walk-behind mowers, pressure washers, and vacuums. Best Buy needs to continue overall category awareness for this space if they hope to make a move to gain share from those retailers leaders like Home Depot and Lowe’s.
Monitor Market Share Signals Beneath the Surface
Retailers need to listen closely to these signals, both the sales and the why behind the wins and losses.
At OpenBrand, that’s what we do. We help brands see beneath the surface: to identify where shopper intent is headed, which segments are heating up (or cooling down), and how to align your pricing and promo playbooks to market realities.
Request a custom review of the data available for your business to get started.