Lowe’s Earnings: Market Share Breakdown | Q4 2025
Inside the Q4 2025 Lowe’s Earnings Call
Lowe’s closed 2025 with positive growth YoY in Q4, despite ongoing economic issues and uncertainty in consumer demand. Lowe’s found growth opportunities and share gains in key product categories impacting overall results as they focused on strong brand performance and pricing strategies.
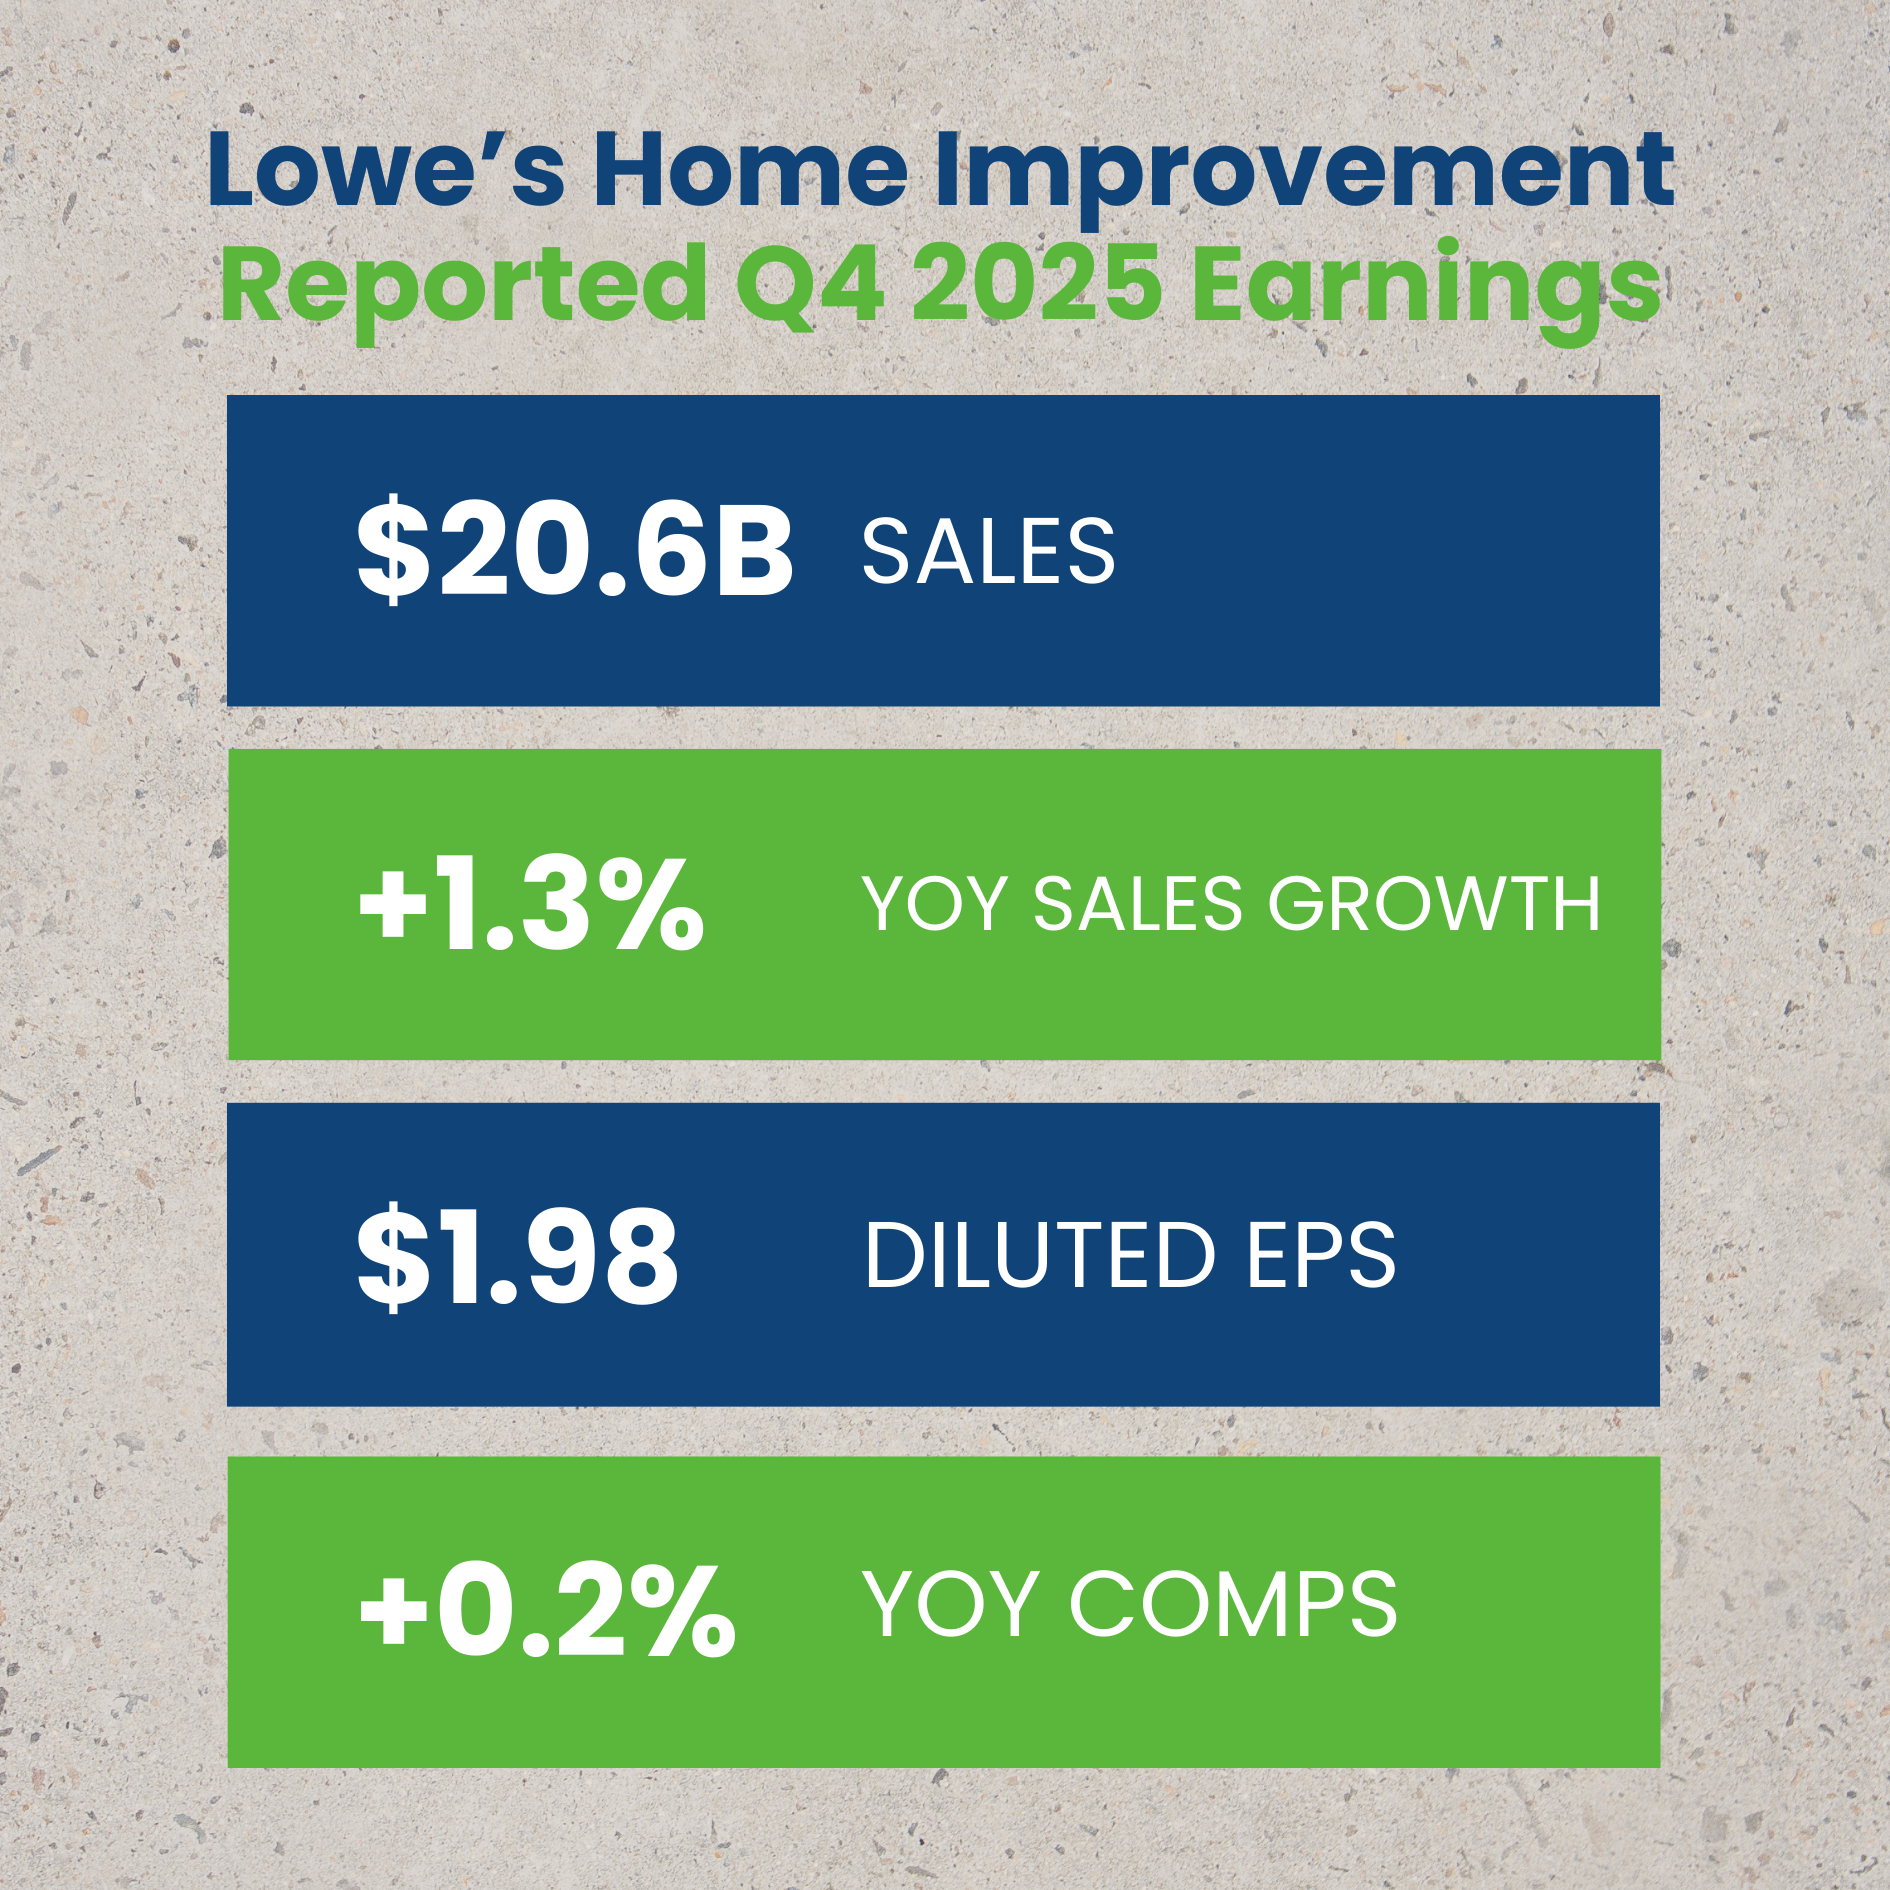
Key Q4 2025 Lowe’s Earnings Call Results
- Revenue: $20.6B
- YOY Sales Growth: +1.3%
- YOY Comps: +0.2
- Diluted EPS: $1.98
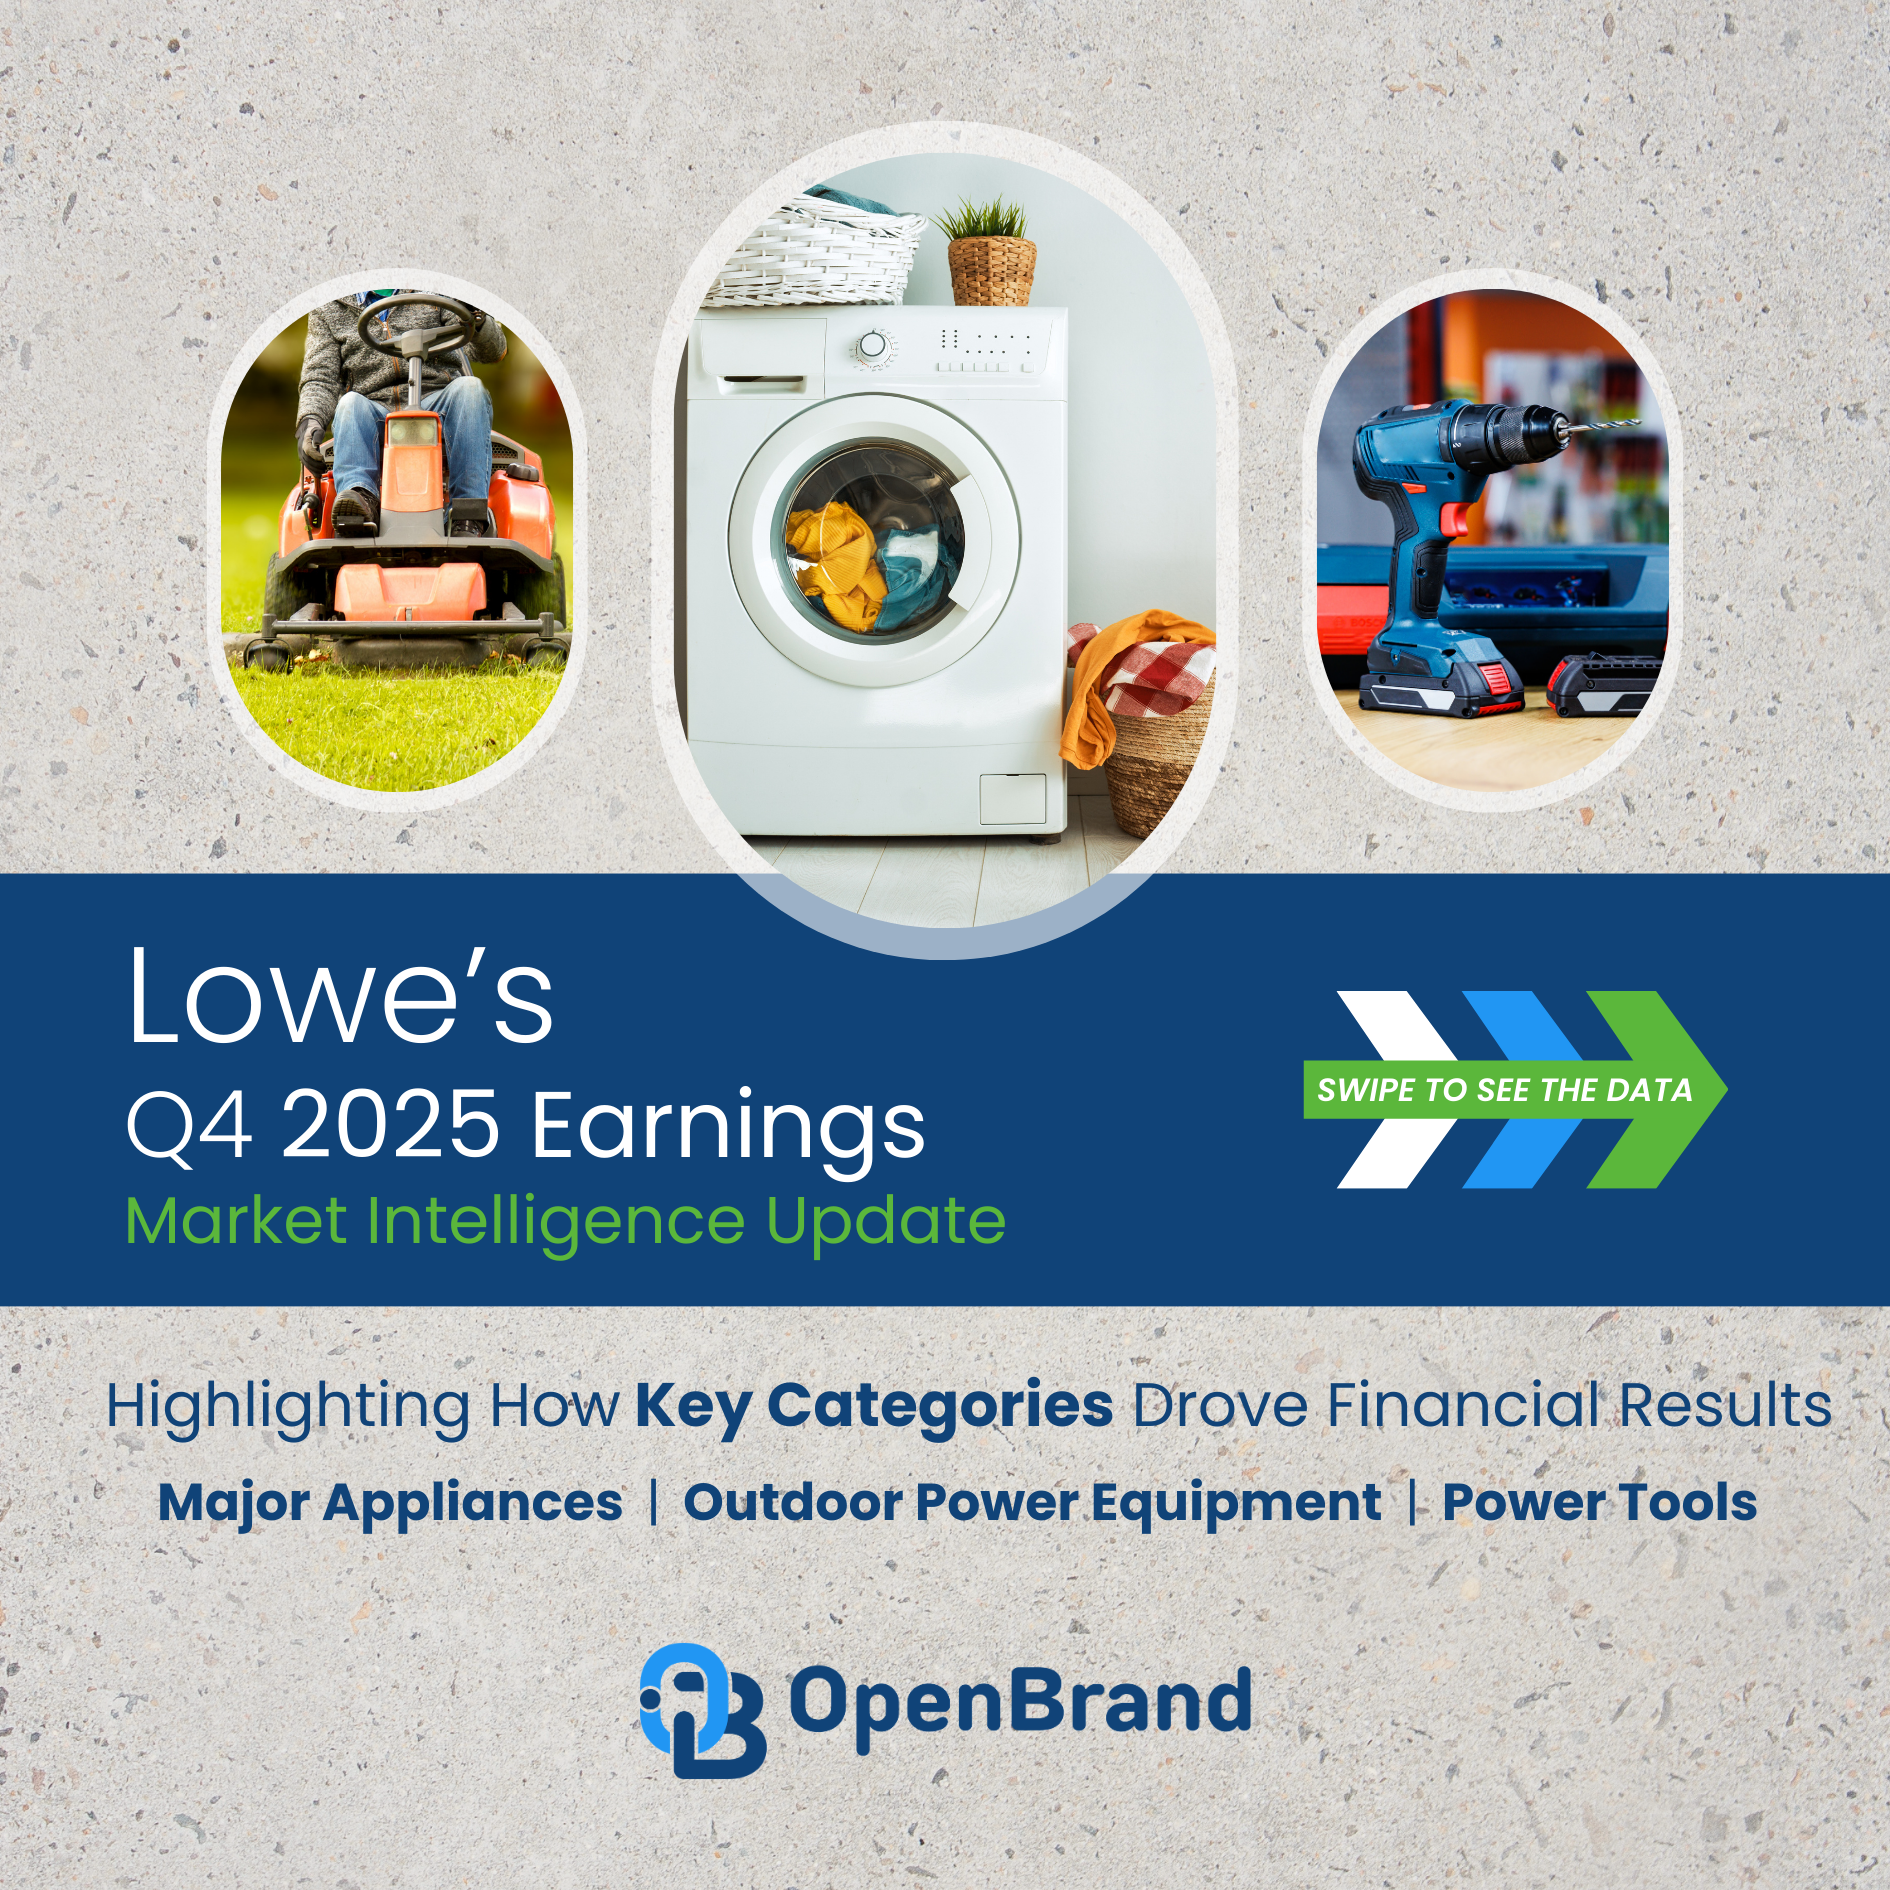
How did core durables categories shape Lowe’s performance?
In this blog post, we break down Lowe’s market share in major appliances, outdoor power equipment, and power tools, highlighting which products and brands helped boost share, where challenges persisted, and how consumer demand is evolving across the home improvement space. Check out the full report now and read our analysis of the data below.
Lowe's Earnings Call
Q4 2025 Performance & Lowe's Market Share Trends
SWIPE TO SEE FULL REPORT, CLICK TO EXPAND SLIDES


Lowe’s Earnings: Major Appliances Category Influence
Market Leadership Holds, despite declines for Q4 2025
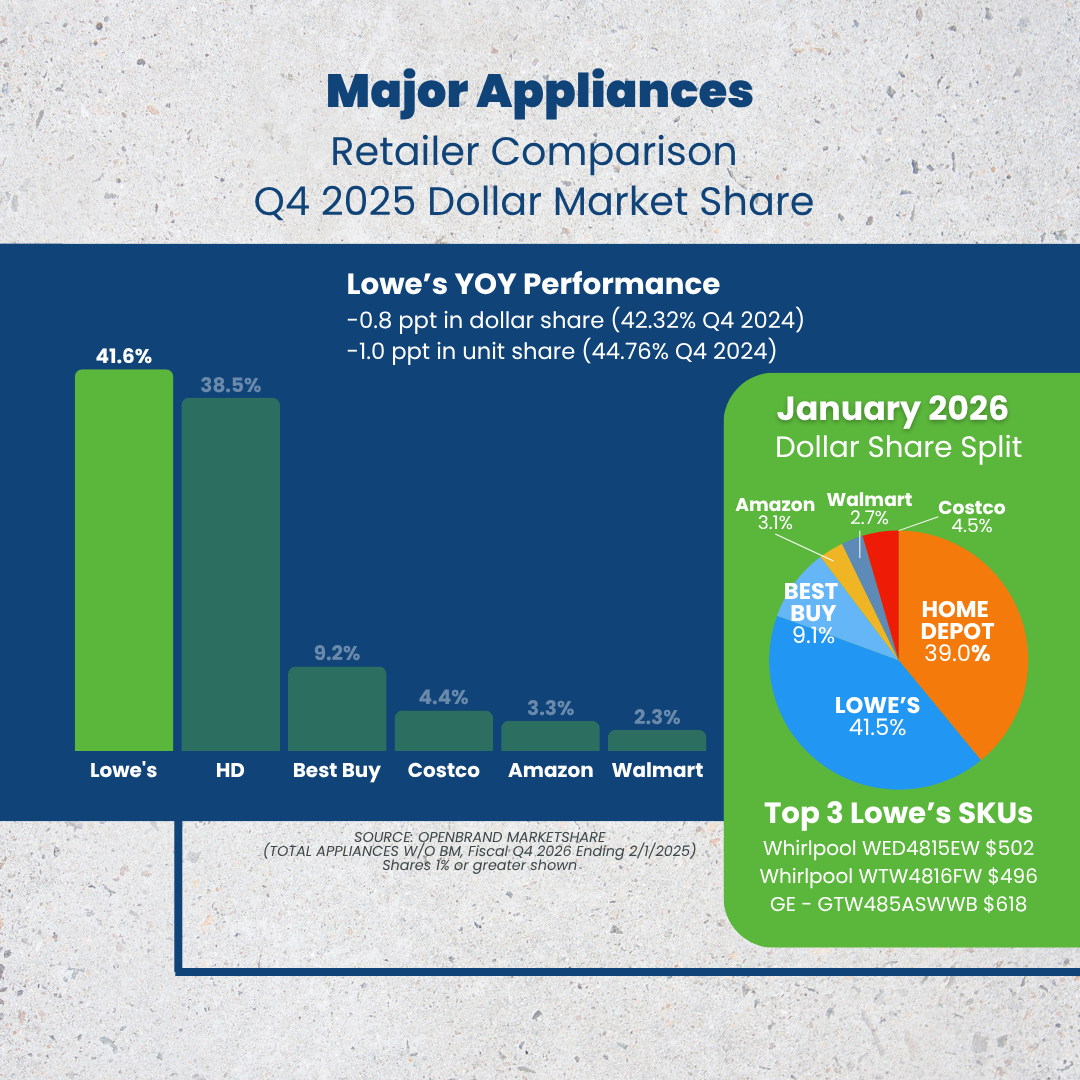
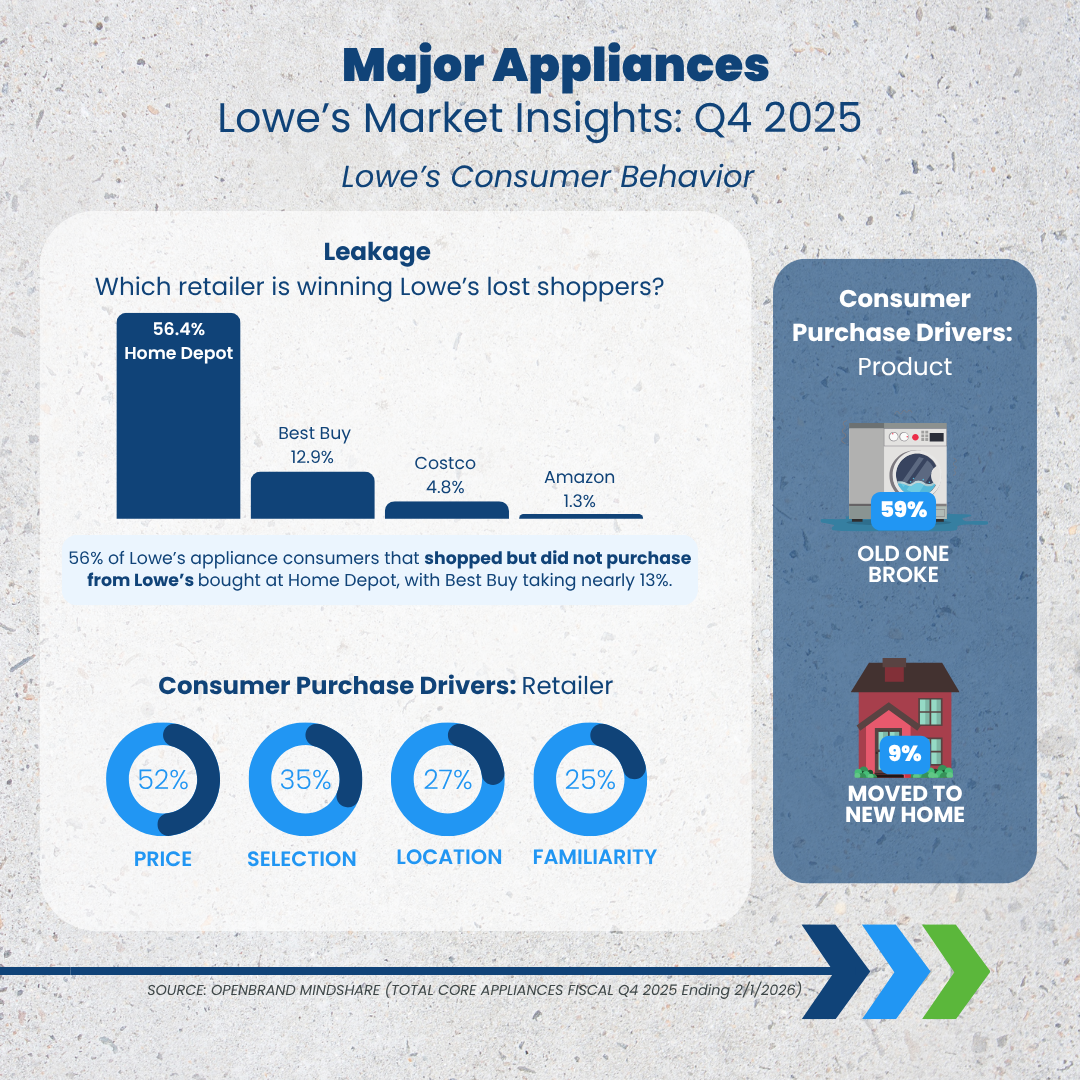
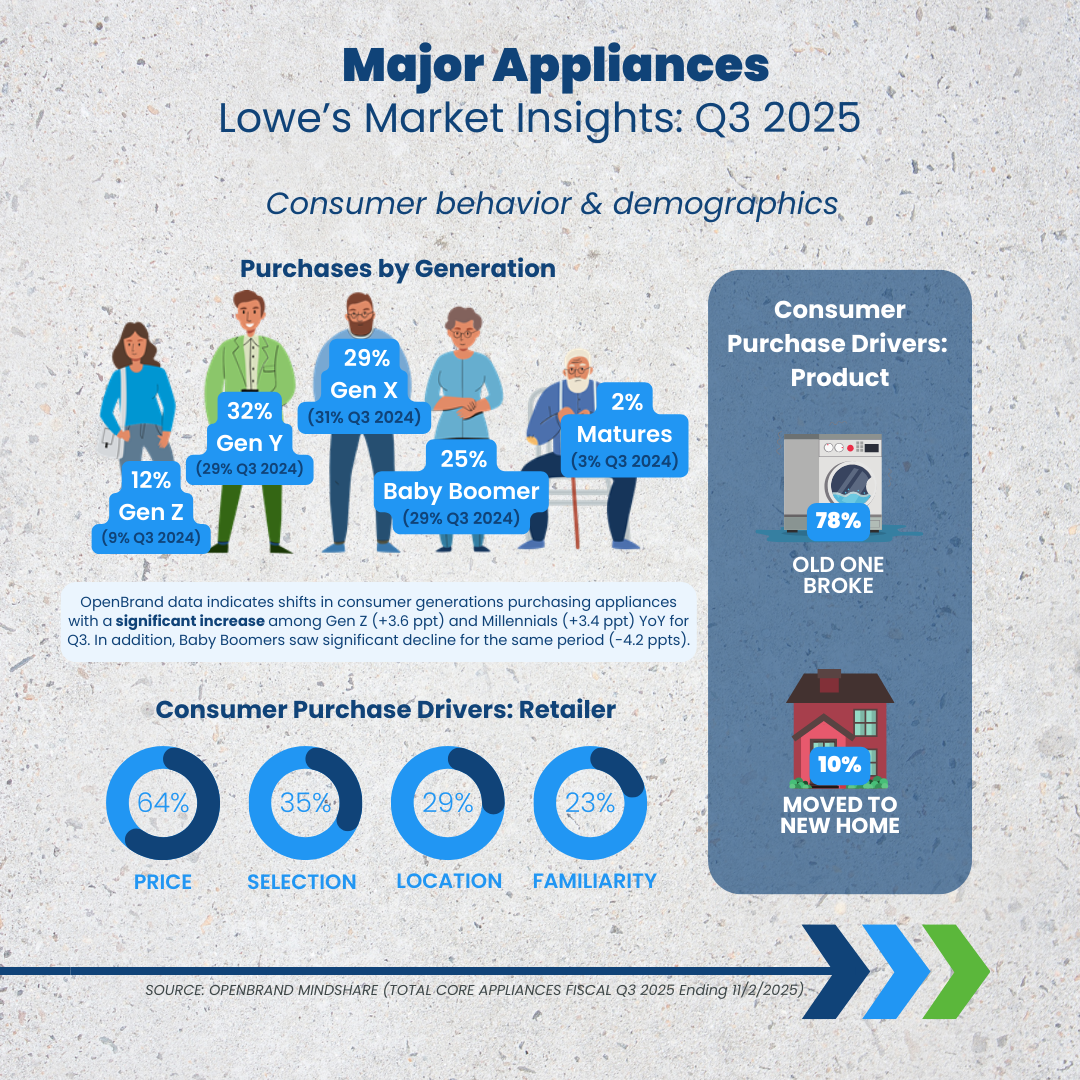
In Q4 2025, Lowe’s lost some traction in the major appliances category, decreasing dollar share slightly (-0.8 ppt) year-over-year (YOY), and unit share by -1.0 ppt. They remain market leader but Home Depot is gaining ground as they picked up +1.3 ppt of dollar share working to close the 3 ppt gap between these two appliance leaders. Leakage data also indicated 56% of Lowe’s appliances shoppers that shopped but did not purchase from Lowe’s bought at Home Depot.
Top Major Appliance Retailers: Q4 2025 Dollar Share Split
- Lowe’s: 41.6%
- Home Depot: 38.5%
- Best Buy: 9.2%
- Costco 4.4%
- Amazon: 3.3%
- Walmart: 3.0%
Here are the product categories that contributed to Lowe’s major appliance share in Q4.
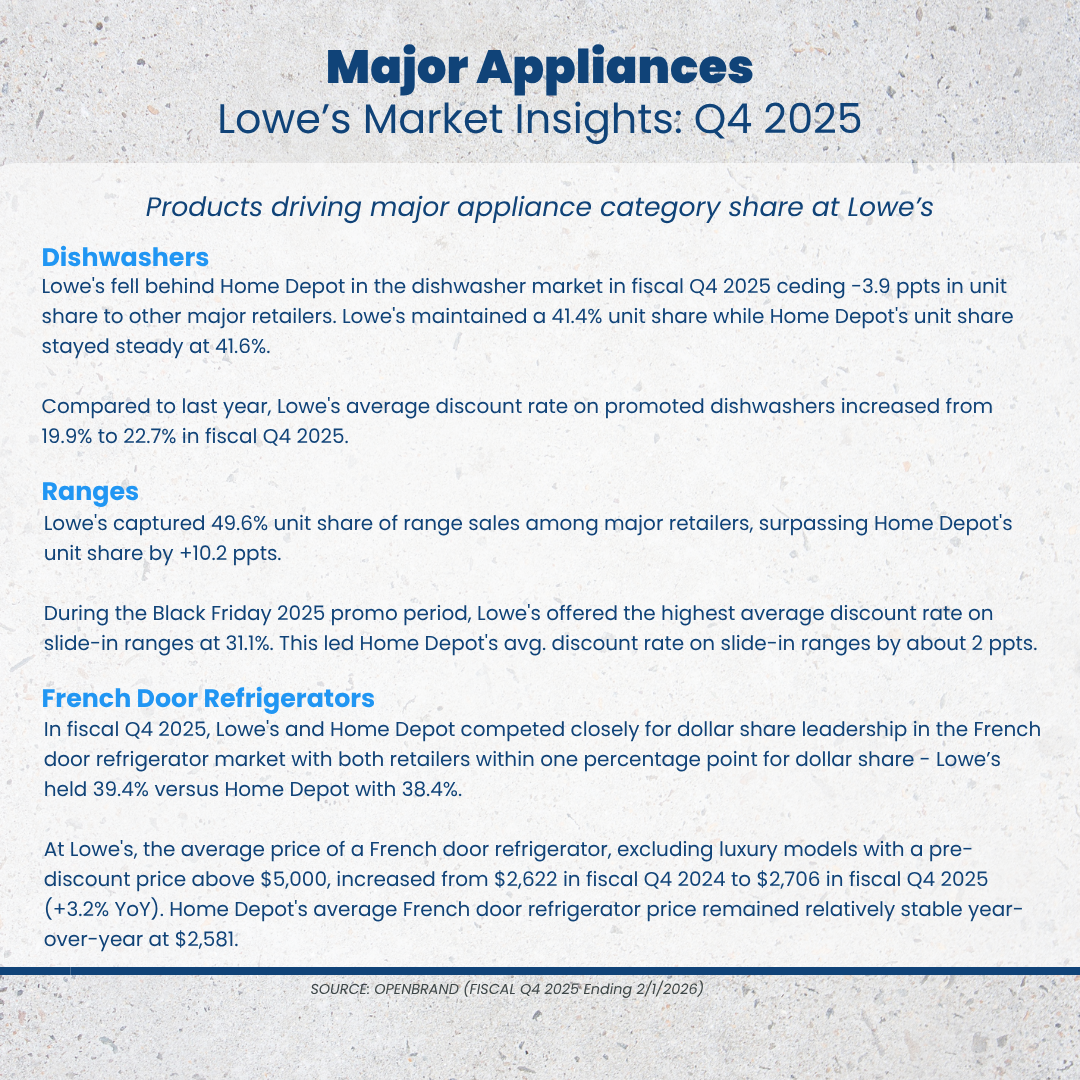
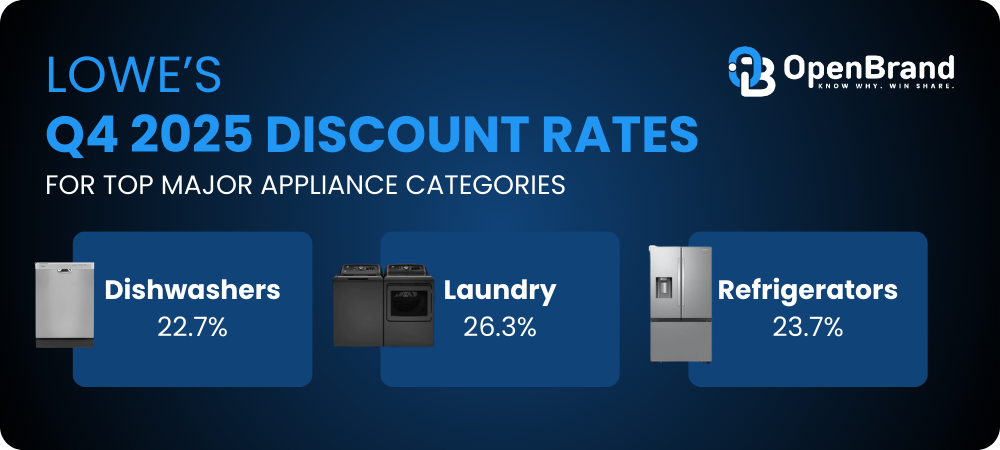
- Dishwashers: Lowe’s falls behind Home Depot in the dishwasher category for fiscal Q4 2025 losing nearly 4 ppts (-3.9 ppts) to other major retailers. Lowe’s held a 41.4% unit share while Home Depot was slightly ahead with 41.6%. Compared to last year, Lowe’s average discount rate on promoted dishwashers increased by 2.8 ppt with an average of 22.7%.
- Ranges: Lowe’s captured nearly half of the share with 49.6% unit share of ranges, surpassing Home Depot’s unit share by +10.2 ppts for the quarter. However, they did see a decline YoY for the quarter. During the Black Friday 2025 promo period, Lowe’s offered the highest average discount rate on slide-in ranges at 31.1%. This led Home Depot’s average discount by 2 ppts for slide-in ranges.
- French Door Refrigerators: In fiscal Q4 2025, Lowe’s and Home Depot competed closely for dollar share leadership in the French door refrigerator market holding a one point gap between them. Lowe’s still led as they gained by +0.9 ppt YoY with 39.4% dollar share while Home Depot had 38.4%.
- Pricing data reported Lowe’s average price of French door refrigerators (excluding luxury models with a pre-discount price above $5k) increased from $2,622 in fiscal Q4 2024 to $2,706 in fiscal Q4 2025 (+3.2% YoY). Home Depot’s average French door refrigerator price remained relatively stable year-over-year holding around $2,581.
OpenBrand’s Key Takeaway
While Lowe’s maintained its leadership in major appliances in Q4 (41.6% share), momentum is shifting as Home Depot continues to close the gap, gaining +1.3 pts and capturing 56% of shopper leakage. Performance across categories was mixed; strength in ranges and French door refrigerators helped defend share, but notable declines in dishwashers highlight emerging vulnerability. Increased promotional intensity, particularly in ranges, suggests Lowe’s is leaning on discounting to sustain volume, while rising price points in refrigerators indicate a push toward higher-value mix.
Lowe’s Earnings: Outdoor Power Equipment Category Influence
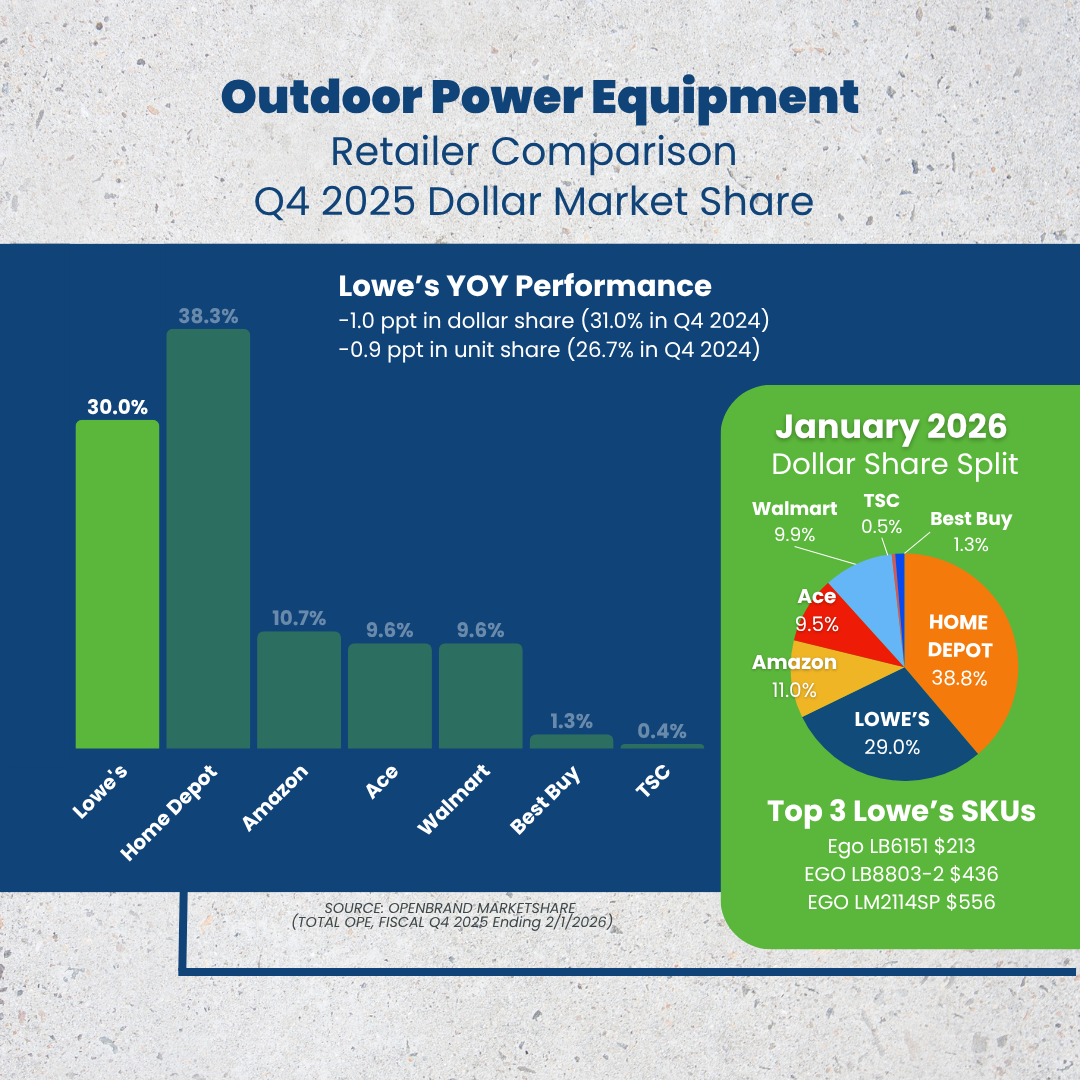
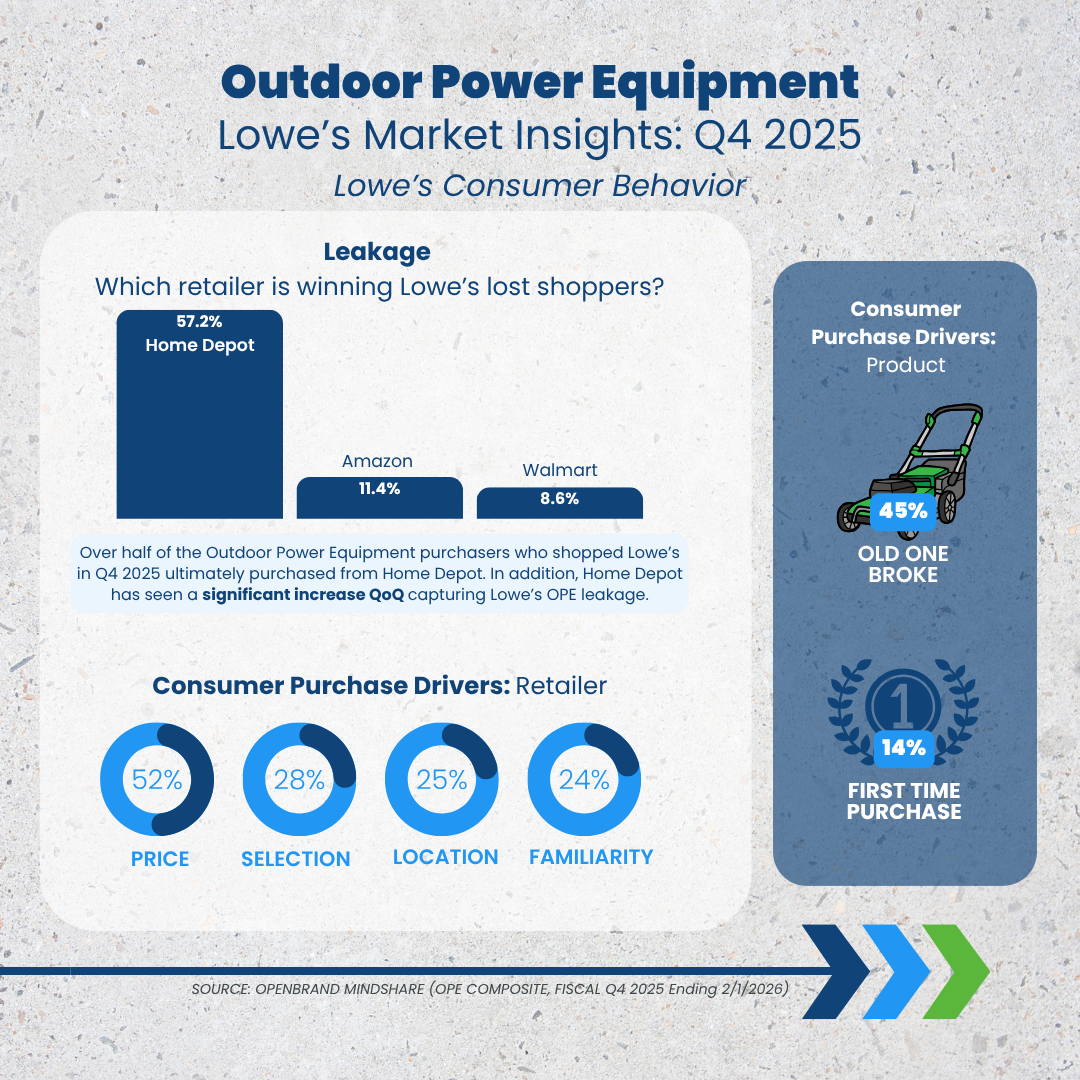
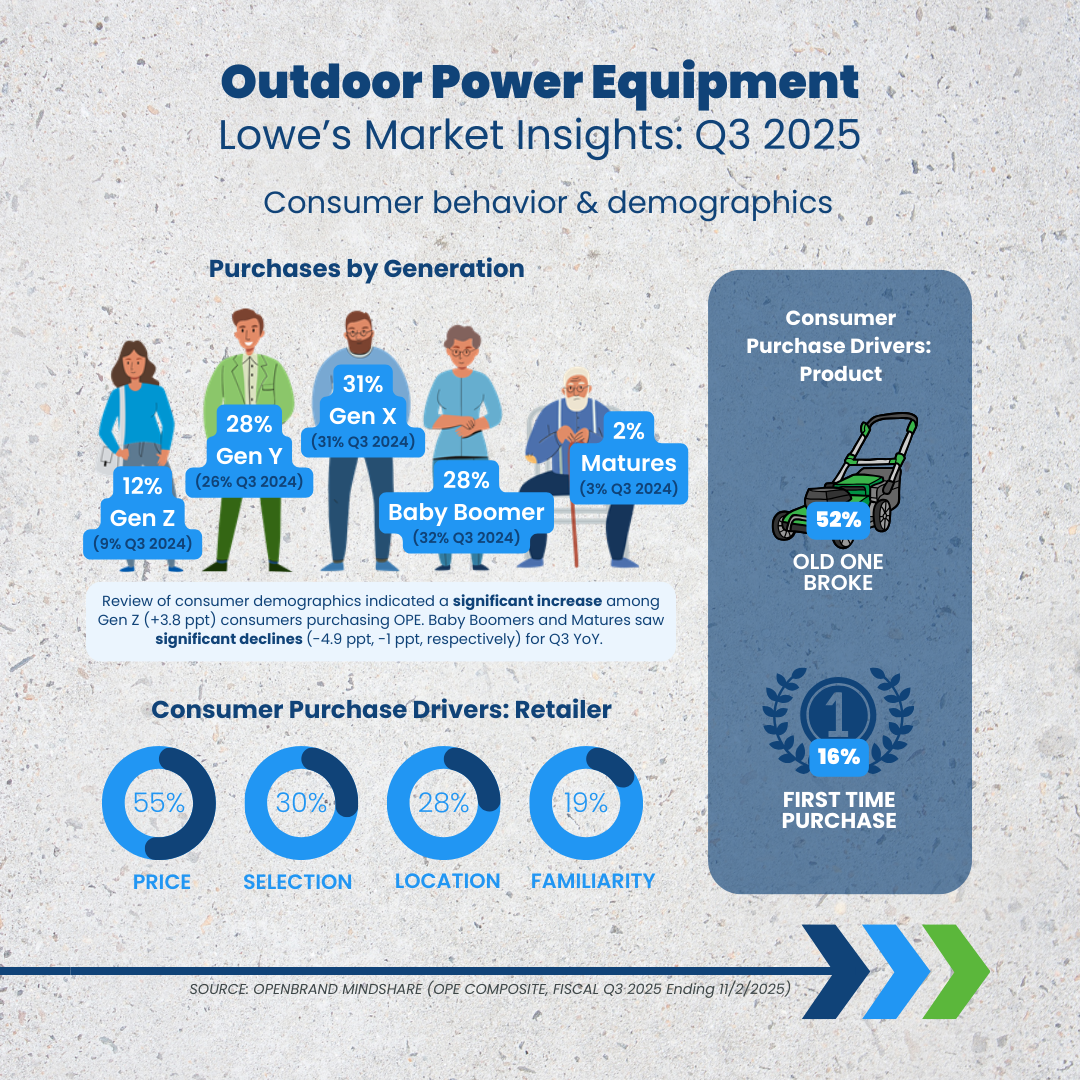
Lowe’s saw a slight decrease (-1.0 ppt) in dollar share for outdoor power equipment (OPE), closing fiscal Q4 2025 with 30.0% share. In addition, unit share declined slightly losing -0.9 ppt YoY. While Lowe’s saw a slight decline, Home Depot grew both unit and dollar share (+1.1 ppt & +3.0 ppt, respectively) and also captured Lowe’s OPE leakage QoQ with 57% of the OPE consumers who shopped Lowe’s but did not purchase at Lowe’s ultimately buying at Home Depot.
Top Outdoor Power Equipment Retailers: Q4 2025 Dollar Share Split
- Lowe’s: 30.0%
- Home Depot: 38.3%
- Amazon: 10.7%
- Ace: 9.6%
- Walmart 9.6%
- Best Buy: 1.3%
- TSC: 0.4%
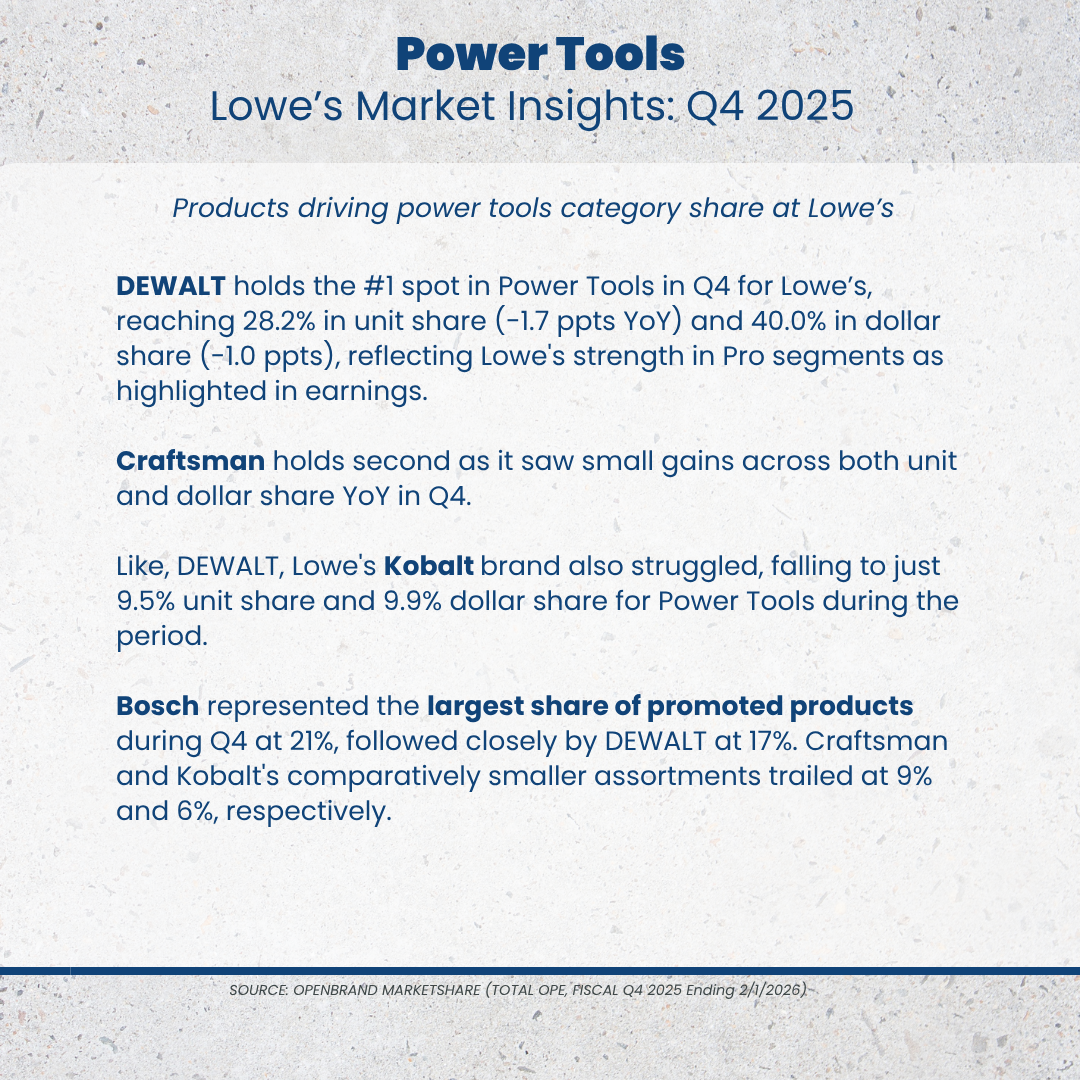
Here are the brands and product categories contributing to Lowe’s outdoor power equipment share.
- In general Lower’s reported “strong holiday gift-giving” as well as storm-related demand as the key factors driving positive results for outdoor living results.
- EGO held the number one position in OPE at Lowe’s for fiscal Q4 2025 with 27.7% dollar share, despite losing -1.9 ppt YoY. Craftsman maintained its unit share position for top spot with 30.0% and holding in second place for dollar share despite declines across both YoY.
- Lowe’s Kobalt brand held the third spot overall for unit and dollar share, 23.1% and 16.4%, respectively. Kobalt saw large gains increasing nearly 5 ppt across both units and dollars in Q4 2024.
- Handhelds overall saw a slight decline for Lowe’s losing -0.5 ppt in dollar share. Craftsman holds the top spot for unit share at Lowe’s despite declines YoY. Ego holds tight to dollar share and grew nearly 4 ppts YoY. Kobalt saw positive gains (~4 ppt across unit and dollar share) for the product group owning second place in unit share and third for dollar share. Kobalt captured 36% of the $100-$149 price band as well as 47% share of the $150 to $199 price band.
- Hedge Trimmers performed well, gaining unit (+1.6 ppt) and dollar (+0.7 ppt) share in Q4 for Lowe’s – likely at the expense of Home Depot’s losses across both measures.
OpenBrand’s Key Takeaway
Lowe’s saw modest declines in OPE in Q4, while Home Depot gained share and captured 57% of leakage, reinforcing a growing conversion gap. Within Lowe’s, performance was mixed — EGO remains the dollar share leader despite declines, while Kobalt and select categories like hedge trimmers showed strength.
Lowe’s Earnings: Power Tools Category Influence
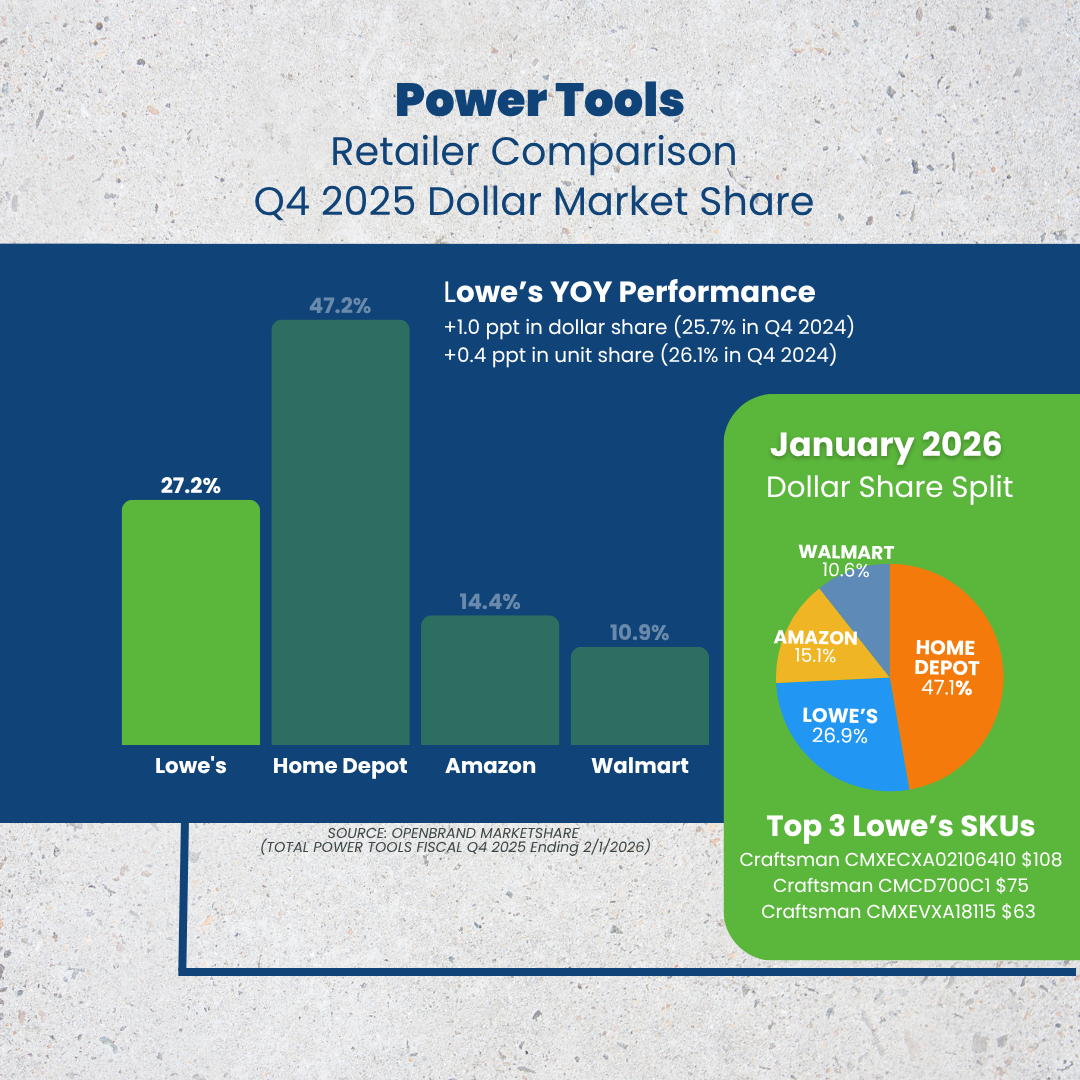
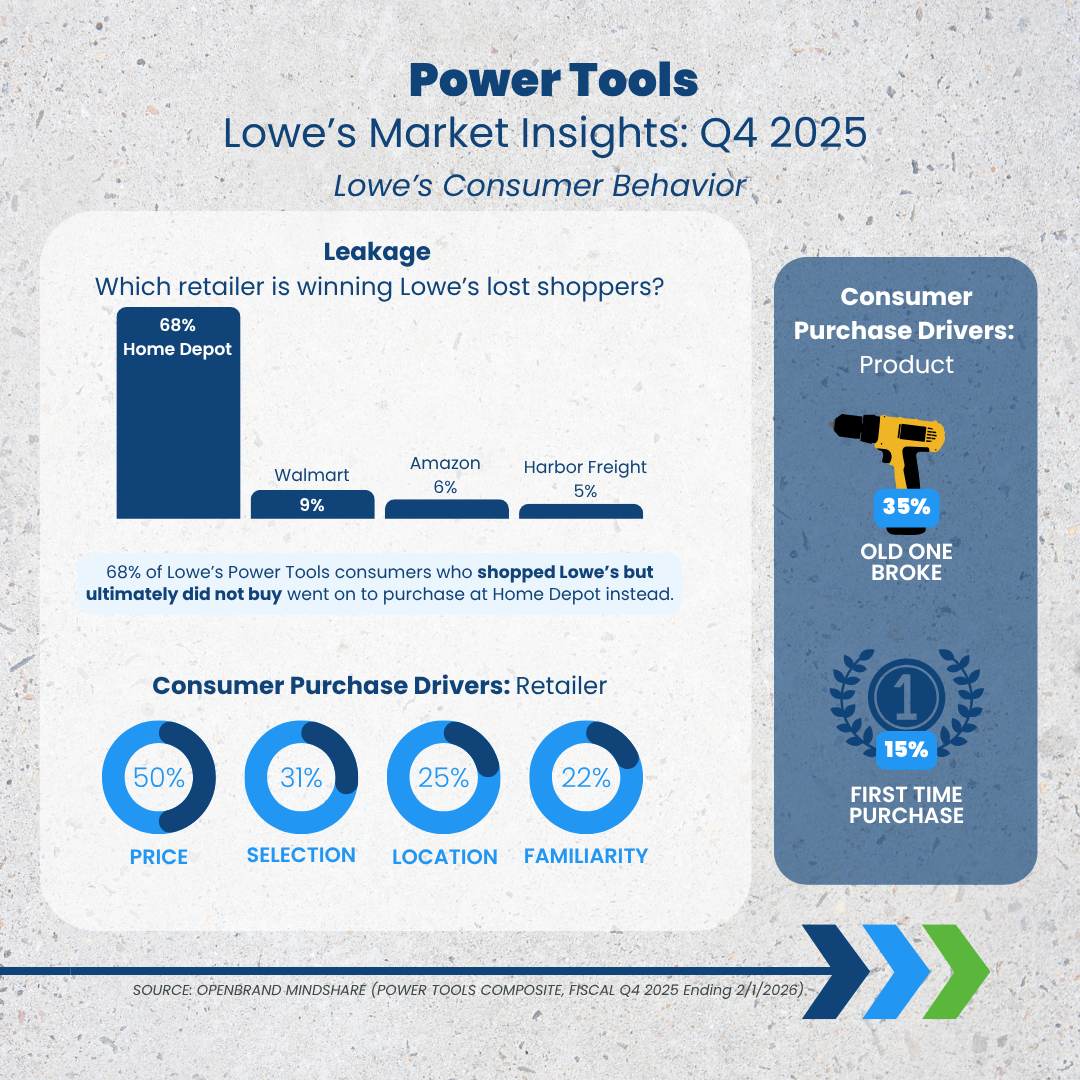
Q4 2025 saw positive gains for Lowe’s in the power tools category, with a +1.0 ppt increase in dollar share YOY and +0.4 ppt in unit share. Despite the positive results across power tools for Lowe’s, there continues to be a sizable gap (20 ppts) between Lowe’s and the market leader, Home Depot. In addtion, Home Depot saw a strong conversion of Lowe’s power tool shoppers who did not purchase at Lowe’s with 68% leakage to Home Depot.
Top Power Tools Retailers: Q4 2025 Dollar Share Split
- Home Depot: 47.2%
- Lowe’s: 27.2%
- Amazon: 14.4%
- Walmart: 10.9%
In Q4, Lowe’s saw positive comps in the tools division, also a result of consumers strong response to the holiday gift-giving assortments as well. Key brands playing a role in Lowe’s Q4 success include:
OpenBrand’s Key Takeaway
Lowe’s saw modest gains in power tools in Q4, but a 20-point gap to Home Depot remains — and more critically, Home Depot captured 68% of leakage, highlighting a significant conversion disadvantage. While brands like DEWALT continue to anchor the category and Craftsman shows momentum, private label (Kobalt) and overall execution lag. Promotional activity is also led by national brands, reinforcing their influence on shopper decisions.
Where Brands & Retailers Should Focus Now
Lowe’s Q4 2025 results highlight a critical shift across appliances, outdoor power equipment (OPE), and power tools: demand remains strong, but conversion is the defining battleground. OpenBrand’s real-time market intelligence reveals clear priorities for brands and retailers looking to win share.
Compete Aggressively on Price & Selection – the Top Drivers of Retail Choice
Across categories, price and product selection remain the primary factors influencing where consumers ultimately purchase. Even when shoppers begin their journey at Lowe’s, a significant share ultimately purchases elsewhere, most often at Home Depot underscoring the importance of competitive pricing and deep assortments to convert consideration into purchase.
Close the Conversion Gap to Capture Lost Demand
The most immediate opportunity is reducing shopper leakage. In Q4, 68% of power tool shoppers, 57% of OPE shoppers, and 56% of appliance shoppers who didn’t convert at Lowe’s purchased at Home Depot. Retailers must focus on in-stock availability, pricing precision, and in-store execution to convert demand already in their funnel.
Leverage Promotions Strategically — Not Just Tactically
Promotional intensity is playing a growing role in sustaining share, particularly in categories like appliances and power tools. However, leading brands are driving promotional effectiveness — suggesting retailers must be more targeted in how and where they discount to balance margin discipline with competitive positioning.
Align with Winning Brands to Drive Both Consideration & Conversion
National brands like DEWALT and EGO continue to outperform — leading in both consideration and conversion. Meanwhile, private label performance remains mixed. Retailers that better align with top-performing brands while strengthening their own offerings will be best positioned to capture both traffic and conversion.
Balance Value and Premium to Maximize Share
Category dynamics reinforce the importance of a balanced portfolio. Value brands drive unit volume, while premium, performance-driven products fuel dollar growth. Winning retailers will be those that effectively span both ends of the spectrum to meet evolving shopper expectations.
Reduce Shopper Leakage Through Stronger Conversion
OpenBrand consumer data shows a meaningful portion of Lowe’s shoppers ultimately purchase from competing retailers, particularly Home Depot. Improving conversion through sharper pricing, clearer value messaging, and stronger in-stock availability will be critical to capturing demand already entering the Lowe’s shopping funnel.
Monitor Market Share Signals Beneath the Surface
Lowe’s earnings in Q4 2025 reinforce that gaining market share is not just about carrying the right brands, but understanding exactly which products to promote, when to push value, and how to meet demand with precision.
If you’re looking to understand the nuances of your market, and get the data you need to effectively manage product mix, pricing, and inventory to grow market share, OpenBrand can help.
Contact us to get the conversation started.
What Lowe's Q4 2025 Earnings Say About Appliance Discounting
Discounting and Price Discipline Position Lowe's as Appliance Market Share Leader
As inflationary pressure, still-elevated interest rates, and cautious household spending reshape demand, consumers are gravitating toward two clear poles: products that minimize upfront spend and those that justify a premium through modern features.
For retailers in the durable goods market, this bifurcation is redefining pricing and promotion strategies. Winning in appliances specifically now requires more than broad market coverage, it demands price discipline in an increasingly competitive market.
Q4 2025 Earnings Analysis
Fourth quarter earnings reports from Home Depot and Lowe’s underscore this dynamic. Lowe’s, which called out a “disciplined approach to pricing and promotions” on its Q4 2025 earnings call, maintained its position as appliance market share leader over the holiday shopping season, while Home Depot lost share in a number of categories.
The average selling price of major appliances at Lowe’s is about $100 less than Home Depot’s average, according to major appliance data from OpenBrand. Meanwhile, the average discount on appliances at Lowe’s was 23% in the fourth quarter, compared to 22% at Home Depot.
These seemingly small discrepancies likely contributed to Lowe’s ability to maintain—and in some cases gain—unit share in the fourth quarter.
How Lowe’s Captures Market Share Across Major Appliance Categories
- In the fourth quarter, Lowe’s captured 43.8% of retailer dollar share in top load washing machines, well above Home Depot’s 31.4% share. Discounts during the Black Friday promotional period contributed to the share disparity, with Lowe’s offering an average discount of 28.6% and Home Depot an average discount of 26.4%.
- Side-by-side refrigerators at Lowe’s were priced about $25 less than Home Depot’s, which has helped Lowe’s maintain its 39.2% unit share, above 31.7% at Home Depot.
- Lowe’s maintained its lead in the dishwasher market in the fourth quarter despite ceding 1.8 percentage points to other major retailers. The average discount rate on dishwashers at Lowe’s increased from 19.9% to 22.7%, which may have helped it maintain unit share over Home Depot.
- In the range category, Lowe’s captured 48.3% unit share, surpassing Home Depot’s share by 11.3 percentage points. During the Black Friday promotional period, Lowe’s offered the highest average discount rate on slide-in ranges at 31.3%.
- The two retailers competed the most closely in the market for French door refrigerators, likely because it was one of few categories where Home Depot’s average price was slightly lower than Lowe’s.
Price Strategy is Key to Capturing and Sustaining Market Share
Despite Lowe’s emerging as the market leader in major appliances, OpenBrand’s data show Walmart continued to gain share in the fourth quarter. Walmart offers the lowest average selling price across appliances and has gained 1.2 ppt of dollar share, a reminder of consumers’ ongoing value discipline.
For Lowe’s and Home Depot, defending and growing share will hinge on competing effectively on price while clearly articulating differentiated value—through exclusive models, services, or financing. In an economy increasingly defined by trade-offs, precise price positioning is essential to sustained growth.
Get more insight into Major Appliance trends and how retailers win the market
Visit our Major Appliance industry page and our Retailer solutions page to learn more about the data we deliver – or contact our team below to start a conversation about your market data needs.

Lowe’s Earnings: Market Share Breakdown | Q3 2025
Inside the Q3 2025 Lowe’s Earnings Call
Lowe’s earnings for Q3 2025 reflect positive growth YoY, despite ongoing economic issues and uncertainty in consumer demand. Lowe’s found growth opportunities and share gains in key product categories impacting overall results as they focused on strong brand performance and pricing strategies.
Key Q3 2025 Lowe’s Earnings Call Results
- Revenue: $20.8B
- YOY Sales Growth: +3.2%
- YOY Comps: +0.14
- Diluted EPS: $2.88
How did core durables categories shape Lowe’s performance?
In this blog post, we break down Lowe’s market share in major appliances, outdoor power equipment, and power tools, highlighting which products and brands helped boost share, where challenges persisted, and how consumer demand is evolving across the home improvement space. Check out the full report now and read our analysis of the data below.
Lowe's Earnings Call
Q3 2025 Performance & Lowe's Market Share Trends
SWIPE TO SEE FULL REPORT, CLICK TO EXPAND SLIDES


Lowe’s Earnings: Major Appliances Category Influence
Market Leadership Holds, But Home Depot Gaining Ground
In Q3 2025, Lowe’s lost some traction in the major appliances category, decreasing dollar share slightly (-0.3 ppt) year-over-year (YOY), and unit share by -0.5 ppt. They remain market leader but Home Depot is gaining ground.
Top Major Appliance Retailers: Q3 2025 Dollar Share Split
- Lowe’s: 37.4%
- Home Depot: 35.6%
- Best Buy: 17%
- Amazon: 3.2%
- Walmart: 2.2%
Here are the product categories that contributed to Lowe’s major appliance share in Q3.
- Ranges: Lowe’s increased dollar share by +4.1 ppts YoY. GE led the range market adding +1.3 ppts categories success at the retailer. In general we are seeing a shift in Lowe’s range shoppers gravitating toward lower priced models.
- Side-by-side Refrigerators: Lowe’s captured nearly 36% unit share, a +4.2 ppts gain YoY trailing Home Depot by +7.7 ppts for the quarter.
- Top Mount Refrigerators: Lowe’s top mount refrigerator dollar share dropped from 43.4% in Q3 2024 to 39.8% in Q3 2025. Frigidaire lost -9.0 ppt in Q3 at Lowe’s as Home Depot picked up +5.4 ppts for the brand.
OpenBrand’s Key Takeaway
Lowe’s strengthened its #1 position in major appliances this quarter, driven by notable YoY gains in ranges and side-by-side refrigerators. As consumers shift toward more affordable models and brands rebalance their portfolios, Lowe’s is capturing disproportionate momentum where the market is moving.
Lowe’s Earnings: Outdoor Power Equipment Category Influence
Q3 saw a +1.0 ppt increase in dollar share for Lowe’s in outdoor power equipment, reaching 39.3%. However, unit share declined by -1.6 ppt YoY.
Top Outdoor Power Equipment Retailers: Q3 2025 Dollar Share Split
- Lowe’s: 39.3%
- Home Depot: 41.0%
- Amazon: 10.1%
- Walmart: 8.5%
- Best Buy: 1.0%
Here are the product categories and brands contributing to Lowe’s outdoor power equipment share. In general Lower’s reported mild weather was a key factor driving demand for outdoor projects.
- ZTR Mowers drove +2.7 ppts for units and +3.3 ppts for dollar share likely due in part to weather as well as strong brand contributions from Toro and Ariens sales in Q3.
- Handhelds continue to be the largest unit volume driver for OPE; Leaf Blowers with 27% and Line Trimmers 25% holding over half of the units sold in Q3.
- Line Trimmers increased dollar share by +4.5 ppts despite unit share remaining relatively flat. These results suggest more customers traded up for premium brands.
OpenBrand’s Key Takeaway
Even with softer unit trends, Lowe’s expanded its dollar share in OPE as consumers shifted toward higher-priced equipment. Strong gains in ZTR mowers and premium line trimmers, combined with continued dominance in handhelds, positioned Lowe’s as a key destination for both volume and value within the category.
Lowe’s Earnings: Power Tools Category Influence
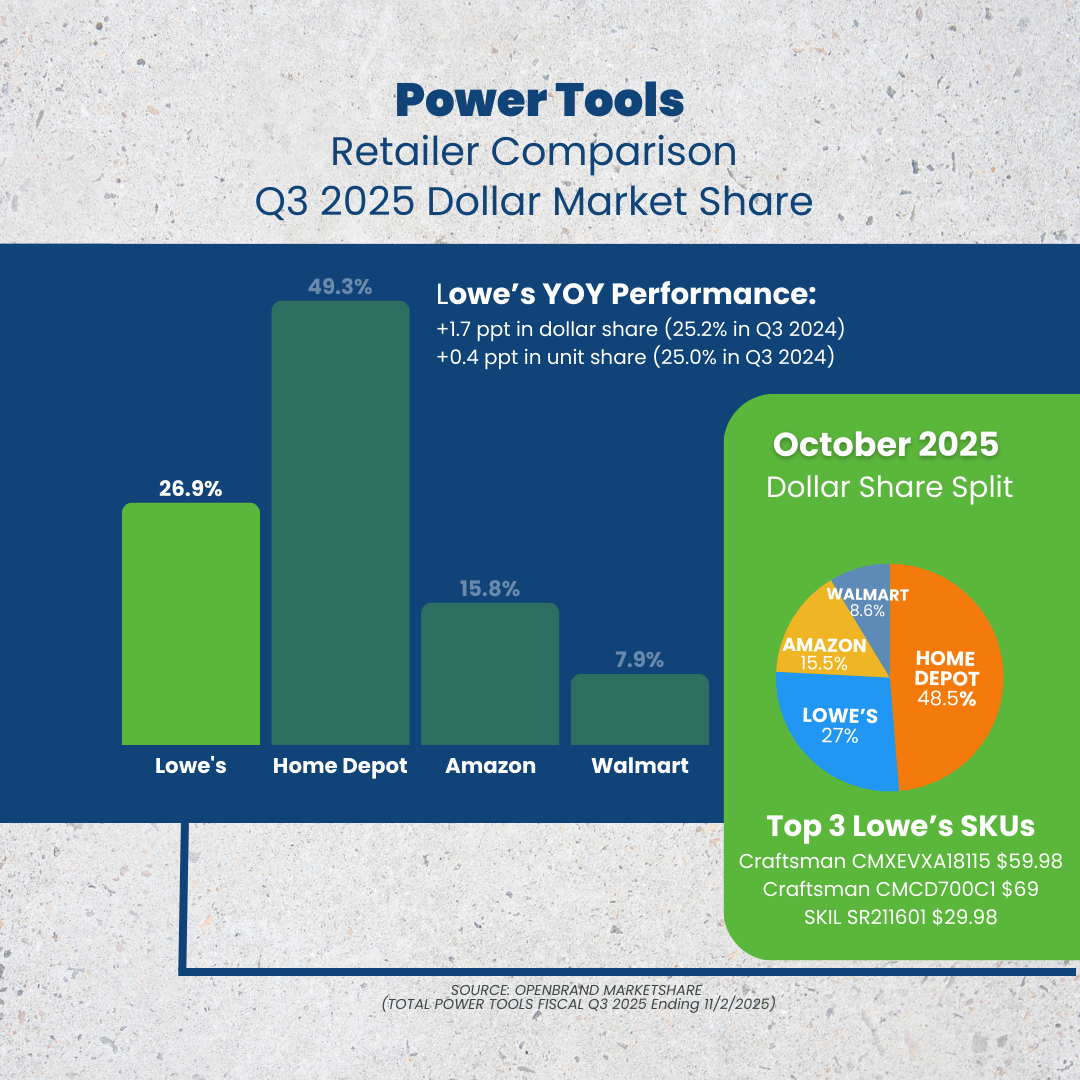
Q3 2025 saw slight gains for Lowe’s in the power tools category, with a +1.7 ppt increase in dollar share YOY and +0.4 ppt in unit share. Despite the positive results across power tools for Lowe’s, there continues to be a sizable gap (+22.4 ppts) between Lowe’s and the market leader, Home Depot.
Top Power Tools Retailers: Q3 2025 Dollar Share Split
- Home Depot: 49.3%
- Lowe’s: 26.9%
- Amazon: 15.8%
- Walmart: 7.9%
In Q3, Lowe’s saw positive comps in the Tools Division, driven primarily by Hand Tools and Tool Storage. Here are the product categories contributing to Lowe’s power tools share.
OpenBrand’s Key Takeaway
Despite the wide competitive gap with Home Depot, Lowe’s posted meaningful Q3 improvements in power tools, boosted by higher-value drill sales and strong comps in hand tools and storage. Heavy consumer response to DeWalt promotions and Craftsman’s leadership in both drills and shop vacs helped reinforce Lowe’s position as a key challenger in the category.
Where Brands & Retailers Should Focus Now
Lowe’s Q3 2025 results reveal how pricing dynamics, shifting consumer preferences, and brand execution shaped performance across major appliances, OPE, and power tools. For brands and retailers competing in the durables space, several clear priorities emerge:
- Win in Value-Driven Segments — Shoppers Are Trading Down in Appliances but Trading Up in OPE: Consumers are navigating inflation by selectively adjusting their spending. In appliances, shoppers gravitated toward lower-priced ranges, boosting share for GE and helping Lowe’s grow the category. Conversely, in OPE, shoppers traded up to premium line trimmers. Brands must align portfolios to support both ends of the value spectrum to maximize ROI.
-
Strengthen Category Fundamentals — Retailers Are Rewarded When Their Core Is Tight: Lowe’s appliance momentum came from strong alignment in high-velocity categories like ranges and side-by-sides, but underperformance in top-mount refrigerators shows how quickly share can shift when category coverage weakens.
Durables growth will depend on disciplined assortment planning and brand-retailer coordination. -
Prioritize Premium & High-Ticket Innovation — Especially Where Consumers Show Momentum: ZTR mowers and higher-priced drills outperformed, signaling that shoppers still spend on premium solutions when the performance delta is clear.
For brands, this means:-
Leaning into features that justify higher price points
-
Ensuring availability in the most in-demand premium tiers
-
Reinforcing value through promotional strategy, not just pricing
-
- Promotions Need Precision, Not Depth: Across categories, Lowe’s growth was supported by targeted promotions, especially in power tools where DeWalt captured 30% of instant-savings activity and drove strong unit share above $150. Strategic timeing around seasonal peaks are critical as well as clear value messaging. Avoid margin-eroding blanket discounts – promotions that are precise, not broad, continue to deliver the best results.
- Cordless & Battery Platforms Remain a Core Growth Engine: With OPE still shifting rapidly toward cordless models, performance in handheld units—like blowers and trimmers—continues to define category volume. Brands that expand battery ecosystems, cross-compatibility, and runtime differentiation will be best positioned to defend and grow share.
- Private Label & National Brands Both Matter: Craftsman remained a top performer in power tools and shop vacs, while Toro and Ariens were critical to OPE growth. At the same time, category softness for brands like Frigidaire in top-mount refrigerators highlights the risk of under-supported core categories. Retailers must nurture both owned and national brands to maintain category momentum and prevent costly leakage to competitors.
Monitor Market Share Signals Beneath the Surface
Lowe’s earnings in Q3 2025 reinforce that gaining market share is not just about carrying the right brands, but understanding exactly which products to promote, when to push value, and how to meet demand with precision.
If you’re looking to understand the nuances of your market, and get the data you need to effectively manage product mix, pricing, and inventory to grow market share, OpenBrand can help.
Request a custom review of the data available for your business to get started.

What Actually Won: Cyber Monday + Black Friday Insights 2025
The Category Moves That Mattered and the Data Behind Them
Most Black Friday and Cyber Monday reporting focuses on headlines and MSRP discounts. OpenBrand goes deeper, delivering real-time pricing and promotion intelligence across dozens of categories – from appliances to TVs, tablets and wearables to name a few.
As the 2025 holiday season winds down, we’ve compiled the standout themes from Black Friday and Cyber Monday, backed by OpenBrand’s data, analysts, and in-store audits.
The 2025 holiday kick-off delivered strong engagement across both Black Friday and Cyber Monday but performance diverged sharply by category, channel, and spend tier.
Here are the top three takeaways shaping the retail landscape:
- Black Friday drove in-store conversions and big-ticket wins across Appliances, Floor Care, Wearables and large TVs. Doorbusters and real-time signage execution separated top-performing retailers from the rest.
- Cyber Monday shifted toward self-upgrading and digital deal-hunting, winning with strength in Tablets, Smartphones and Desktops, especially in price bands under $500.
- Pricing precision and promo execution were critical. Retailers who nailed both - Lowe’s in Appliances and Best Buy in CE outperformed the competition relying on static signage or shallow discounts strategies.
Check out our 2025 Holiday Shopping Tracker and continue reading to see some of the category specifics showing up for Black Friday and Cyber Monday.
BLACK FRIDAY INSIGHTS 2025
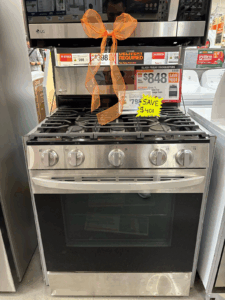
Appliances Made a Major Statement: Lowe’s Led on Price
Lowe’s had the deepest discount rates across major appliance categories during the week of Black Friday outperforming both Home Depot and Best Buy.
- Refrigerators: 28.1% at Lowe’s vs. 24.9% at Home Depot and 26.8% at Best Buy
- Washers/Dryers: 27.8% at Lowe’s vs. 25.9% at Home Depot and 25.0% at Best Buy
- Ranges: 26.2% at Lowe’s vs. 25.1% at Home Depot and 25.4% at Best Buy
These rates, combined with strong entrance placements and Black Friday doorbusters, positioned Lowe’s as the most aggressive among the big three.

Home Depot and Best Buy: Dropping the Ball on In-Store Execution?
Home Depot offered strong deals but suffered from signage mismatches, where printed in-store tags were higher than digital shelf tags across a variety of categories; ranges, laundry and refrigerators which was one of the most significant.
And while Best Buy improved YoY regarding discount depth, it also fell short in signage execution and top-end SKU coverage.
Appliance conversion remains heavily store-driven during Black Friday, but success increasingly depends on the full customer experience — including signage accuracy and in-store execution. While sharp pricing gets shoppers in the door, even small execution missteps can derail the sale.
At Home Depot, we heard from staff that signage updates were delayed or skipped entirely, while at Lowe’s we observed Black Friday tags placed on the wrong range models. These breakdowns highlight a bigger truth: human error can undermine even the best promotions.
For retailers and brands alike, ensuring price accuracy — both online and in-store is now a baseline requirement for winning in big-ticket durables.

Wearables Were the MVP: Led by Garmin and Walmart.com
Black Friday was a breakout moment for wearables, especially smartwatches.
Walmart.com emerged as the category’s top discounter, led by a massive surge in Garmin deals.
Garmin nearly doubled its promo count YoY, taking the top spot in deal volume across all brands. Walmart.com offered the highest average instant savings ($128) and the deepest average discount rate (27.9%), powered largely by Garmin’s “7X” series. Garmin’s average promo savings hit $157-off, outpacing Apple and Samsung.
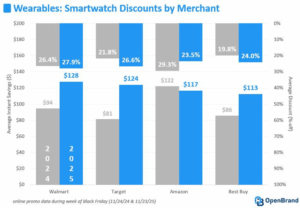
The $200–299 price band grew the fastest YoY, with OpenBrand tracking 299 smartwatch deals in this range.
Floor Care Surged on Black Friday: Especially Premium & Cordless Models
Consumers showed up ready to spend in this category. Floor care brands like Shark, Dyson, and Tineco captured outsized attention on Black Friday.

The $200–$299 band dominated in total promo count across robot vacuums and cordless stick vacs.
Retailers leaned into promo volume over deep discounting while average % off was steady YoY, there was a significant increase in SKUs on promotion, especially at Walmart and Amazon.
Premium cordless vacs outpaced legacy uprights, a shift OpenBrand attributes to growing consumer preference for flexibility and ease-of-use.
CYBER MONDAY INSIGHTS 2025
Appliance Momentum Cooled: Focus Shifted to Replenishment
Cyber Monday did not replicate Black Friday’s success in large appliances.
OpenBrand’s reporting confirms Black Friday as the primary conversion moment for big-ticket appliances, while Cyber Monday shifted toward small appliances, replenishment, and CE upgrades.
Conversion for large appliances declined post-weekend as shoppers pulled back on high-ticket purchases and redirected spend toward online-first tech categories.
Appliance performance on Cyber Monday was fragmented, with no clear merchant leader emerging.
Tablets Delivered Volume: But Not Deeper Discounts
Tablets performed well on Cyber Monday, driven by higher ASPs rather than deeper markdowns.
- Average discount rates held flat YoY at 22%, while average promo value rose to $128 (+10% YoY).
- Best Buy and Amazon led with targeted, model-specific deals.
- Walmart pulled back on depth, offering just $67 average savings (–7% YoY), driven by Fire and Onn assortment.
Promotional focus skewed toward replenishment and lower-to-mid tier SKUs, rather than aggressive premium discounting.
Desktops Gained Share: Mid-Tier Promotions Worked
Desktops gained traction on Cyber Monday through deeper discounts, particularly at Best Buy and Costco.
Lenovo emerged as a key share gainer by concentrating promotions on AIOs and mini desktops in the mid-price tier—balancing value without over-discounting flagship configurations.
Smartphones Became a Self-Upgrade Event
Cyber Monday smartphone demand skewed heavily toward self-purchasing rather than gifting.
- 54% of buyers shopped for themselves, not others.
- 27% spent over $500, showing premium SKUs still converted when paired with compelling offers.
This reinforced Cyber Monday’s role as a personal upgrade moment, rather than a traditional gifting peak.

Small Appliances Traded Down
Small appliance buyers shifted downmarket, with spend clustering in the $50–$150 range.
This trade-down behavior aligned with Cyber Monday’s broader theme: efficient, online-driven purchases rather than aspirational big-ticket spending.
Cyber Monday Bottom Line
Cyber Monday performed best in categories with high online elasticity and low in-store dependency — notably tablets, desktops, and smartphones.
While volume was strong, success hinged on precision promotions and SKU-level targeting, rather than broad-based discount depth.
What Retailers Should Avoid in 2026
- Price-only plays won’t win in CE if the discount rate does not move. Consumers increasingly notice percent savings, not just total dollars.
- Outdated in-store signage hurt multiple retailers, OpenBrand audits caught several examples at both Home Depot and Lowe’s.
- Undifferentiated SKU strategies underperformed. In CE and appliances alike, older models with generic price cuts lost ground to exclusives or hero SKUs promoted through endcap visibility.
Don’t see holiday highlights for your category? Connect with our category experts to request data for a specific brand, category, retailer, and more.
Where Openbrand’s Insights Come From
OpenBrand tracked every key moment across the promotion period, surfacing not just what was promoted, but what actually moved, who gained share, and where execution broke down.
Our category experts utilize pricing and promotion data directly sourced from OpenBrand’s Competitive Intelligence platform which captures daily online pricing and weekly in-store pricing for top retailers. Average discount rates and promotion values aggregate omnichannel pricing records on promoted products (i.e., all products that received a discount) throughout the Black Friday promotional period. In addition to leveraging the OpenBrand Competitive Intelligence Platform, analysts performed in store shops to verify shelf pricing during key events.
OpenBrand also implemented a Holiday Shopping MindShare Tracker (Nov. 19 - Dec. 4) focused on understanding discount and spend expectations, retailers consumers planned to shop versus actually shopped, categories shopped and purchased and much more, across Black Friday and Cyber Monday.
Track Key Events With OpenBrand
It’s Not Just Tracking Deals - It’s Telling You What Moved
Most Black Friday coverage focuses on headlines like “Apple dropped $100 off iPads.” But OpenBrand's platform goes deeper:
- Tracks exact discount depth, not MSRP-based fluff
- Differentiates between volume vs. value share
- Flags execution risks in real time (e.g., mismatched signage, promo inconsistencies)
- Maps trends by brand, retailer, subcategory, and price band
That’s how we can confidently say Garmin gained share, Cyber Monday didn’t deepen discounts, and retailers over-indexed on $200–$299 SKUs across multiple categories.
Connect with our team today to see how we can help you track the next key promotional period.
Home Depot Market Share Breakdown: Q3 2025 Earnings Call Analysis
Inside the Home Depot Q3 2025 Earnings Call
Home Depot’s Q3 2025 earnings call confirmed solid top-line growth in a cautious consumer environment, driven by seasonal strength and ongoing interest in small-scale home improvement projects.
Key Q3 2025 Home Depot Earnings Call Results
- Revenue: $41.4B
- YOY Sales Growth: +2.8%
- YOY Comps: 0.2%
- Diluted EPS: $3.62
As we review Q3 earnings we will dig deeper into what role did Home Depot’s core durables categories played in shaping this growth?
In this blog post, we analyze Home Depot’s market share across major appliances, outdoor power equipment, and power tools in order to highlight what is driving gains, where share is slipping, and how different products, brands, and promotions play into it all.
Check out the full report now and read our analysis of the data below.
Home Depot Earnings Call
Q3 2025 Performance & Home Depot Market Share Trends
SWIPE TO SEE FULL REPORT, CLICK TO EXPAND SLIDES


Home Depot Market Share: Major Appliances Category
Share Leadership Narrows the Gap
In Q3 2025, Home Depot’s market share saw a slight increase of +0.6 percentage points (ppt) year-over-year (YOY), winning 35% of consumer dollars. This maintains their second place position, behind Lowe’s, for leading retailer of major appliances; Lowe’s leads the major appliance market with 37.7% dollar share.
Top Major Appliance Retailers: Q3 2025 Dollar Share Split
- Lowe’s: 37.7%
- Home Depot: 35%
- Best Buy: 16.9%
- Amazon: 3.2%
- Walmart: 2.4%

Laundry played a vital role in Home Depot’s slight bump in share for Q3. Here are the product categories that contributed to Home Depot’s major appliance share in Q3.
- Washer/Dryer Combos: Home Depot captured 54% of the unit sales across major retailers with this +16 ppt YoY increase for washer/dryer combos. In Q3, Samsung offered an average discount rate of 28% on promoted all-in-one models surpassing Best Buy’s average discount rate of 23% on their Samsung all-in-ones.
- Front Load Washers: Home Depot closed the gap between it’s number one competitor, Lowe’s, up nearly +3 ppt and taking the lead with 35% dollar share for front load washers.
- Side-by-side: Home Depot saw a -4.6 ppt decline as Lowe’s picked up +3.1 ppts but they continue to hold an equal share of 35% for side-by-side refrigerators.
OpenBrand’s Key Takeaway
Home Depot tightened the race in the major appliances category in Q3 2025, narrowing the gap with Lowe’s as strategic wins in laundry drove meaningful share gains. Strong performance in washer/dryer combos fueled by aggressive Samsung promotions and renewed momentum in front-load washers helped Home Depot lift its dollar share to 35%. While they faced pressure in side-by-side refrigerators, their growth in high-impact laundry segments underscores how promotional strategy and category depth can shift competitive dynamics even in a tight, mature market.
Home Depot Market Share: Outdoor Power Equipment Category
Category Gains Secure Share Leader Position
Home Depot saw an increase in outdoor power equipment market share in Q3 2025, with +0.9 ppt in dollar share and +2.1 ppt in unit share YOY. The positive gains gave Home Depot their place as dollar share leader for outdoor power equipment, coming in ahead of Lowe’s with +1.7 ppt more share.
Top Outdoor Power Equipment Retailers: Q3 2025 Dollar Share Split
- Home Depot: 41.0%
- Lowe’s: 39.3%
- Amazon: 10.1%
- Walmart: 8.5%
- Best Buy: 1.0%
While Amazon is nearly 30 ppts behind either Home Depot or Lowe’s in market share they are continuing to make major traction for the category. So much so that review of the October data indicates Amazon has 13.2% dollar share .

Here are the product categories contributing to Home Depot’s outdoor power equipment share.
- Hedge Trimmers: Results indicated hedge trimmers had the strongest category growth eithin OPE. Ryobi held 50% unit share in Hedge Trimmers and Chainsaws, as well as dominated the $100-149 price band for both categories.
- Chain Saws: Ryobi was also strong across $150-199 price band for Chainsaws. Milwaukee took the lead for instant savings promotions for handhelds in Q3, holding 76% of offers captured. In addition, Milwaukee has the largest chainsaw assortment accounting for 19% of the SKUs tracked this quarter.
Takeaway
Home Depot solidified its leadership in the outdoor power equipment category in Q3 2025, posting gains in both dollar and unit share that pushed it nearly two points ahead of Lowe’s. The retailer’s momentum was fueled by outperformance in fast-growing segments like hedge trimmers and chainsaws, where Ryobi’s strength across key price bands helped drive significant share. While Amazon remains far behind the category leaders, its rapid uptick, reaching 13.2% dollar share in October, signals emerging competitive pressure that could reshape the landscape heading into 2026.
Home Depot Market Share: Power Tools Category
Power Tools Leadership Grows
Despite a slight decline in dollar share (-0.4 ppt), Home Depot maintains its hold over the power tools category for Q3 2025, winning 49% dollar share. Home Depot is clearly the share winner dominating the category over other key players with the category sited as a contributor to positie big-ticket sales which grew for the retailer 2.3% in Q3.
Power Tools Retailers: Q3 2025 Market Share Split
- Home Depot: 49%
- Lowe’s: 26.9%
- Amazon: 15.8%
- Walmart: 7.9%

Here are the product categories contributing to Home Depot’s power tools share.
- Share of power tools priced $200+ increased +3 ppt YoY for Home Depot with Dewalt the key driver as they saw a jump of $200+ priced tools from 20% to 30% YoY.
- Air Compressors: Air Compressors drove share in power tools across both units and dollars YoY (+5.8 ppts and +4.7 ppts, respectively).
- Circular Saws: Circular Saws had the most significant drop in dollar share YoY (-7.6 ppts) suggesting a shift towards cheaper models, deeper discounts on value-priced assortments and an increase in the competitive landscape for higher-end tiers across retailers.
Takeaway
Home Depot continues to dominate the power tools category, commanding 49% dollar share even amid a slight YoY dip. Strength in higher-priced tools, particularly $200+ models driven by Dewalt, as well as strong gains in air compressors helped offset softness in circular saws, where intensified competition and deeper discounting pressured share. Overall, the category remains a major contributor to Home Depot’s big-ticket performance, reinforcing its leadership position despite evolving market dynamics.
Where Brands & Retailers Should Focus Now
Home Depot’s earnings results reveal how consumer preferences and competitive dynamics are reshaping category performance – and how that performance can impact overall market share.
Here’s how these takeaways are applicable for competitive brands and retailers in the durables space:
- Double Down on High-Impact Growth Segments
- Calibrate Promotional Strategy to Consumer Expectations
- Strengthen Assortment in Value + Premium Price Bands
- Partner strategically to build differentiated category depth
- Monitor fast-moving competitors like Amazon, who are gaining traction through price and convenience
- Adopt real-time intelligence to respond quickly as market conditions shift
Monitor Market Share Signals Beneath the Surface
Home Depot’s results showed solid topline growth and operational consistency, but the category-level story reveals more nuance.
If you’re looking to understand the nuances of your market, and get the data you need to effectively manage product mix, pricing, and inventory to grow market share, OpenBrand can help.
Request a custom review of the data available for your business to get started.
Lowe’s Earnings: Market Share Breakdown | Q2 2025
Q2 2025 EARNINGS UPDATED 08/27/2025
Inside the Q2 2025 Lowe’s Earnings Call
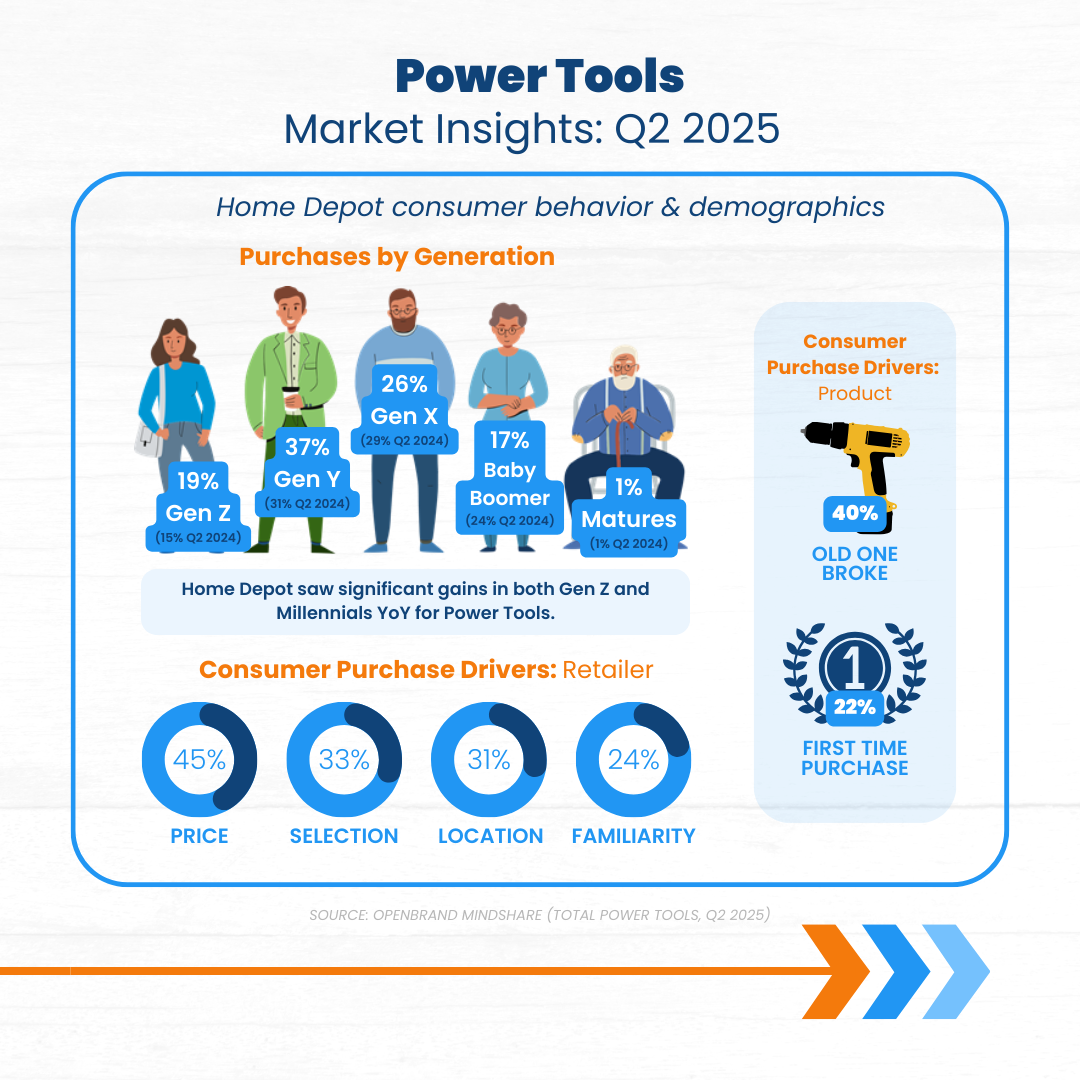
Lowe’s earnings for Q2 2025 reflect an upward trend, seeing growth despite ongoing economic issues and uncertainty in consumer demand. Lowe’s found growth opportunities and share gains in key product categories, leaning into strong brand performance and pricing strategies.
Key Q2 2025 Lowe’s Earnings Call Results
- Revenue: $24B
- YOY Sales Growth: +1.6%
- YOY Comps: +1.1%
- Diluted EPS: $4.27
How did core durables categories shape Lowe’s performance?
In this blog post, we break down Lowe’s market share in major appliances, outdoor power equipment, and power tools, highlighting which products and brands helped boost share, where challenges persisted, and how consumer demand is evolving across the home improvement space. Check out the full report now and read our analysis of the data below.
Lowe's Earnings Call
Q2 2025 Performance & Lowe's Market Share Trends
SWIPE TO SEE FULL REPORT, CLICK TO EXPAND SLIDES


Lowe’s Earnings: Major Appliances Category Influence
Market Leadership Holds, But Home Depot Gaining Ground
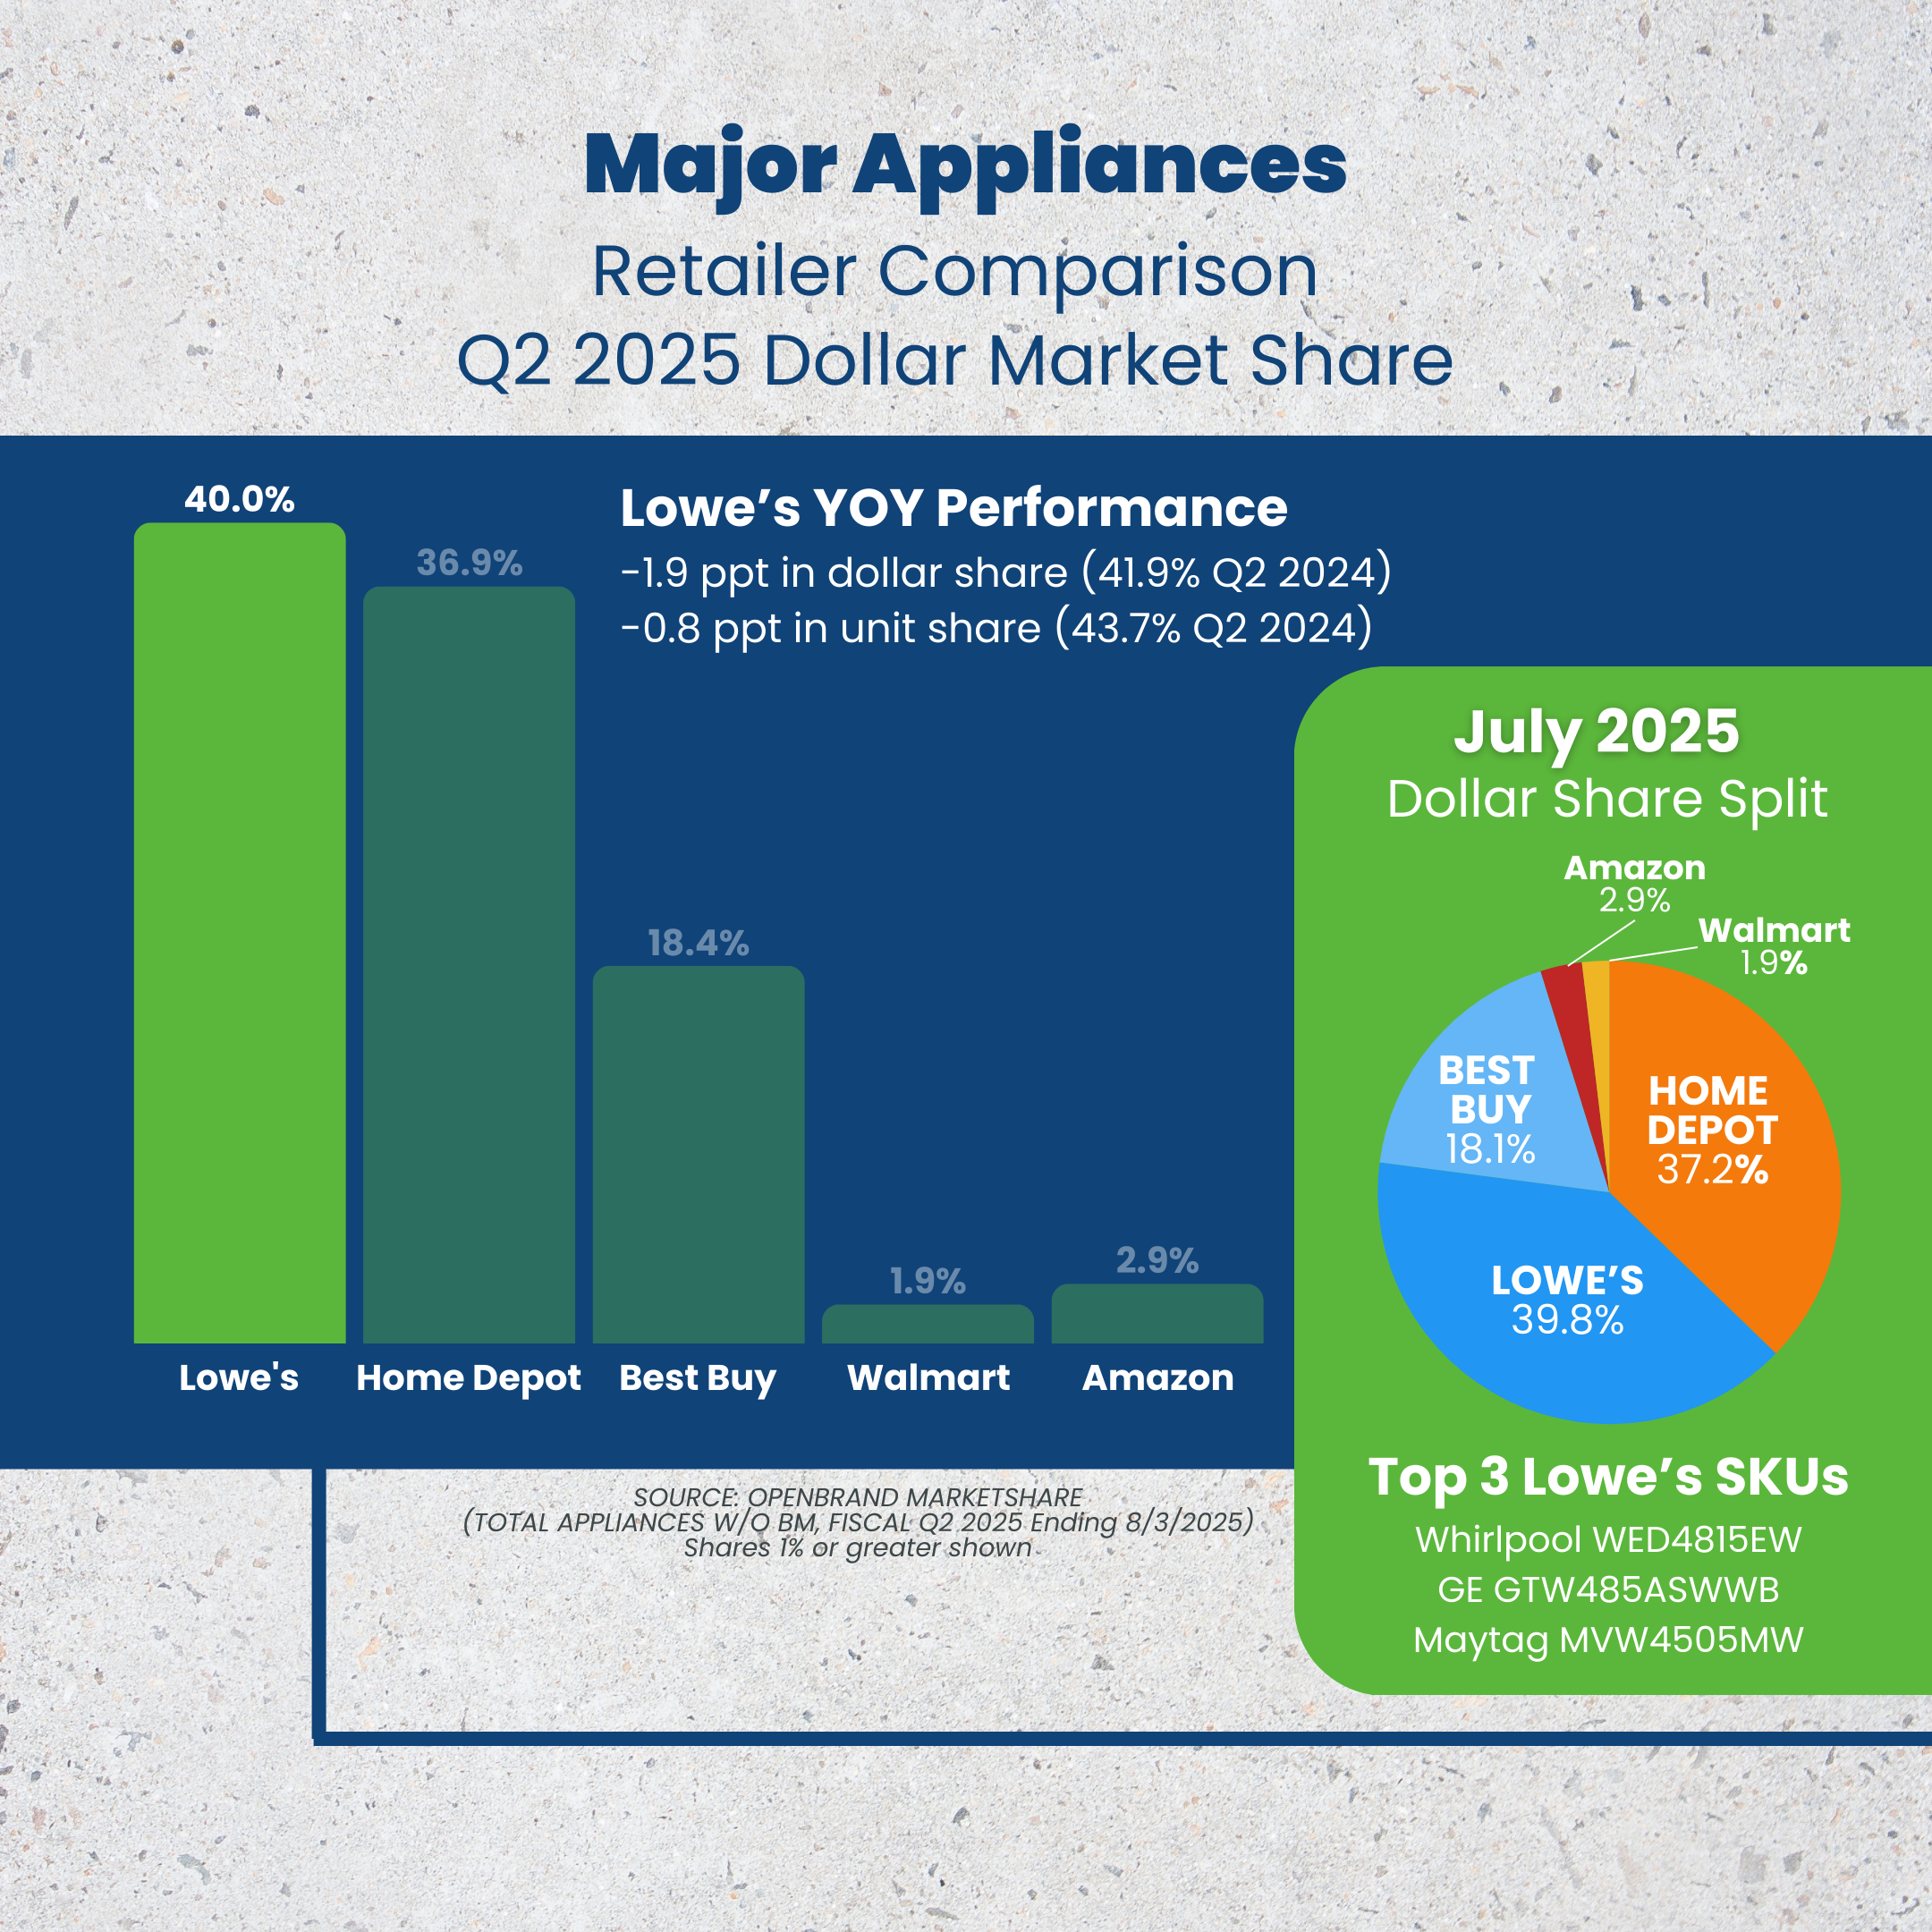
In Q2 2025, Lowe’s lost some traction in the major appliances category, decreasing dollar share by -2 percentage points (ppt) year-over-year (YOY), and unit share by -0.8 ppt. They remain market leader but Home Depot is gaining ground.
Top Major Appliance Retailers: Q1 2025 Dollar Share Split
- Lowe’s: 40%
- Home Depot: 36.9%
- Best Buy: 18.4%
- Amazon: 2.9%
- Walmart: 1.9%
Here are the product categories that contributed to Lowe’s major appliance share in Q2.
- Washer Dryer Combos: Lowe’s grew share by +2.6 pts YoY.
- Top Load Washers: Lowe’s captured 46% unit share, a ~14-pt lead over Home Depot.
- Ranges: GE remains #1, holding an ~11-pt unit-share lead over Samsung.
OpenBrand’s Key Takeaway
Lowe’s maintained leadership in top load washers with nearly half the market, supported by promotions on GE and Maytag. Gains in washer-dryer combos (+2.6 pts YoY) helped offset softer performance in ranges, but overall appliance share slipped as Home Depot closed the gap
Lowe’s Earnings: Outdoor Power Equipment Category Influence
Q2 saw lost ground for Lowe’s in outdoor power equipment, with dollar share decreasing 1.6 ppt YOY, reaching 40.8%.
Top Outdoor Power Equipment Retailers: Q1 2025 Dollar Share Split
- Lowe’s: 40.8%
- Home Depot: 39.2%
- Amazon: 13%
- Walmart: 8.9%
- Best Buy: 1.2%
Here are the product categories and brands contributing to Lowe’s outdoor power equipment share.
- Line Trimmers: Accounted for 37% of Lowe’s total OPE unit sales in Q2’25.
- Craftsman remained #1 brand at 32.6% unit share; EGO gained +4.6 pts YoY.
- Greenworks was the most promoted brand and made up 23% of Instant Savings promos; online OPE sales were +7.5% YoY.
OpenBrand’s Key Takeaway
Despite losing share YoY, Lowe’s held the top retailer position in OPE at 40.7% of dollar share. Growth came from cordless products and brands like EGO and Greenworks, even as Craftsman softened. With line trimmers driving over a third of OPE sales, Lowe’s leaned on online promotions to maintain momentum.
Lowe’s Earnings: Power Tools Category Influence
Q2 2025 saw slight gains for Lowe’s in the power tools category, with a +.01 ppt decline in dollar share YOY despite a -0.2 ppt drop in unit share. Notably there was a 22.3 ppt gap between Lowe’s and Home Depot, the market leader.
Top Power Tools Retailers: Q2 2025 Dollar Share Split
- Home Depot: 49.3%
- Lowe’s: 27%
- Amazon: 16.5%
- Walmart: 6.9%
- Best Buy: >1%
Here are the product categories contributing to Lowe’s power tools share.
OpenBrand’s Key Takeaway
Lowe’s saw robust Q2 demand for power tools, with DeWalt surging to the #1 brand at 38.6% of unit share. Craftsman slipped but remained strong, while promotions and circular saws boosted performance. Discount activity peaked late in July, underscoring the importance of well-timed deals.
Where Brands & Retailers Should Focus Now
Lowe’s Q2 2025 results highlight how category strategy, brand performance, and consumer behavior combine to influence share outcomes. For brands and retailers competing in the durables space, several priorities stand out:
-
Assortment strength in core formats is critical: Lowe’s appliance leadership remains tied to top load washers and growing washer-dryer combos, but underperformance in ranges shows how quickly share can shift without tight category alignment.
-
Promotions must be deliberate and targeted: Lowe’s leveraged deeper discounts in appliances and BOGO-style offers in power tools to maintain momentum. Well-timed events, like Independence Day and late-July promotions, proved essential for driving traffic and conversion.
-
Cordless is shaping the future of OPE: With 58% of OPE units sold coming from cordless models, brands must continue innovating in battery-powered platforms to capture growth and avoid erosion in gas-powered lines.
-
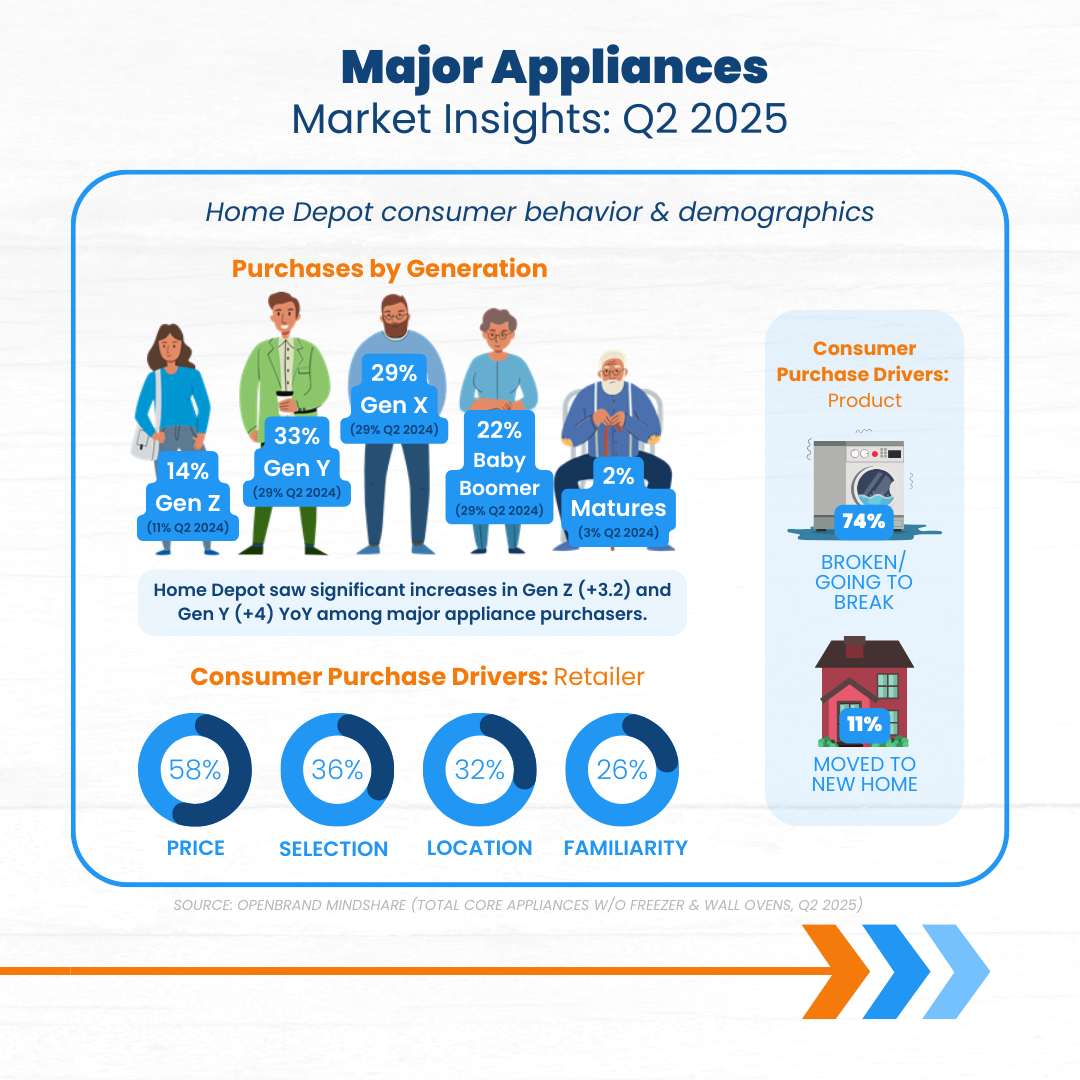
Consumers remain necessity-driven: Across categories, replacement purchases dominate. For appliances, 77% of sales were triggered by a broken or failing unit, underscoring that upgrade-driven demand is secondary.
-
National and private brands both need support: DeWalt’s surge in power tools and Greenworks’ heavy promotional push online illustrate how single-brand execution can move share. Meanwhile, Craftsman’s slip in both OPE and tools signals the need for stronger brand positioning and retailer backing.
Monitor Market Share Signals Beneath the Surface
Lowe’s earnings in Q2 2025 reinforce that gaining market share is not just about carrying the right brands, but understanding exactly which products to promote, when to push value, and how to meet demand with precision.
If you’re looking to understand the nuances of your market, and get the data you need to effectively manage product mix, pricing, and inventory to grow market share, OpenBrand can help.
Request a custom review of the data available for your business to get started.
Home Depot Market Share Breakdown: Q2 2025 Earnings Call Analysis
Q2 RESULTS UPDATED ON 08/27/2025
Inside the Home Depot Q2 2025 Earnings Call
Home Depot’s Q2 2025 earnings call confirmed solid top-line growth in a cautious consumer environment, driven by seasonal strength and ongoing interest in small-scale home improvement projects.
Key Q2 2025 Home Depot Earnings Call Results
- Revenue: $45.3B
- YOY Sales Growth: +4.9%
- YOY Comps: 1.0%
- Diluted EPS: $4.58
Digging deeper, what role did Home Depot’s core durables categories play in shaping this growth?
In this blog post, we analyze Home Depot’s market share across major appliances, outdoor power equipment, and power tools in order to highlight what is driving gains, where share is slipping, and how different products, brands, and promotions play into it all.
Check out the full report now and read our analysis of the data below.
Home Depot Earnings Call
Q2 2025 Performance & Home Depot Market Share Trends
SWIPE TO SEE FULL REPORT, CLICK TO EXPAND SLIDES
Home Depot Market Share: Major Appliances Category
Share Leadership Gap Shrinks
In Q2 2025, Home Depot’s market share saw a slight increase of +3.1 percentage points (ppt) year-over-year (YOY), winning 36.9% of consumer dollars. This maintains their place as second leading retailer for major appliances, coming in behind Lowe’s, who leads the major appliance market with 40% dollar share.
Top Major Appliance Retailers: Q2 2025 Dollar Share Split
- Lowe’s: 40%
- Home Depot: 36.9%
- Best Buy: 18.4%
- Amazon: 2.9%
- Walmart: 1.9%

Here are the product categories that contributed to Home Depot’s major appliance share in Q2.
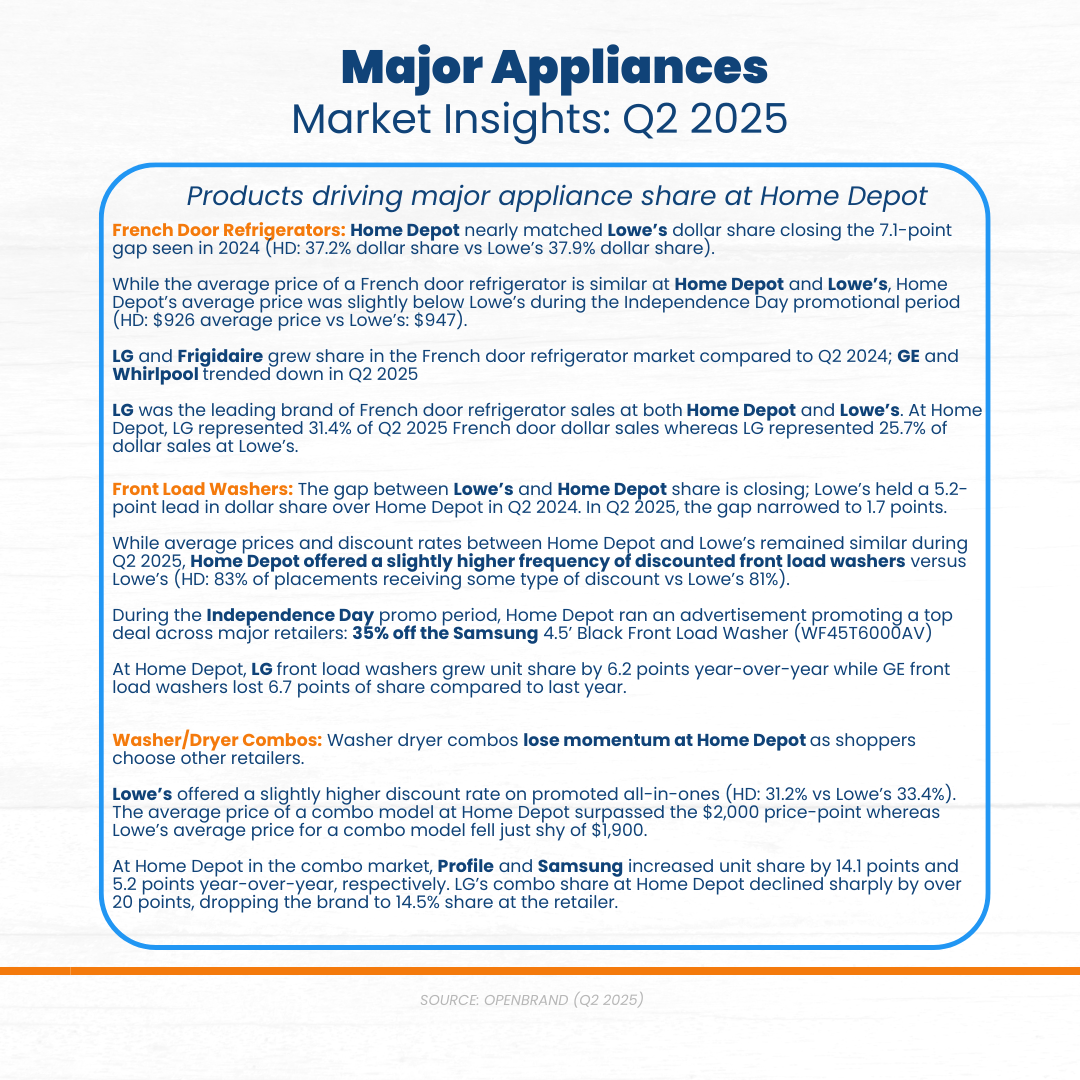
- French Door Refrigerators: Home Depot nearly tied Lowe’s on dollar share in Q2’25—37.2% vs 37.9%, closing last year’s 7.1-pt gap to just 0.7 pt.
- Front Load Washers: The Lowe’s lead shrank — gap narrowed to 1.7 pts (from 5.2 pts in Q2’24).
- Washer/Dryer Combos: Momentum softened at Home Depot; LG’s combo share fell 20+ pts to 14.5%, even as Profile and Samsung gained.
OpenBrand’s Key Takeaway
Home Depot strengthened its appliance position in Q2, closing share gaps with Lowe’s in front load washers and French door refrigerators through aggressive promotions and strong LG sales. While washer-dryer combos underperformed, gains in higher-demand formats lifted overall unit and dollar share growth.
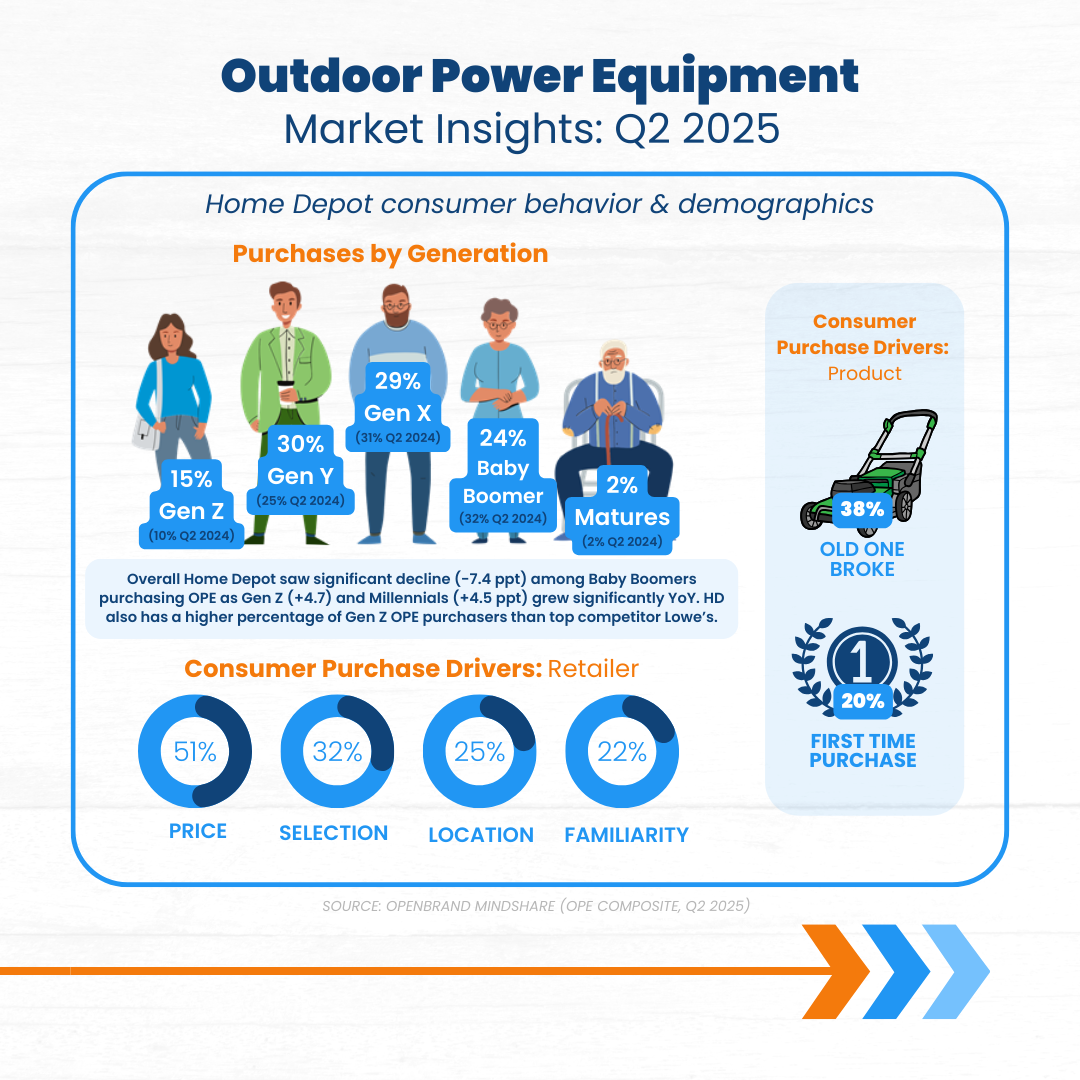
Home Depot Market Share: Outdoor Power Equipment Category
Category Gains, But Share Leader Position Lost
Home Depot saw a slight decline in outdoor power equipment market share in Q2 2025, seeing +1.8 ppt in dollar share and +0.7 ppt in unit share YOY.
Despite these gains, Home Depot lost their place as dollar share leader for outdoor power equipment, coming in just below Lowe’s with 1.6 ppt less share.
Top Outdoor Power Equipment Retailers: Q2 2025 Dollar Share Split
- Home Depot: 39.2%
- Lowe’s: 40.8%
- Amazon: 8.9%
- Walmart: 13%
- Best Buy: 1.2%
Despite being up in Q1 by 1 ppt YOY, Amazon saw a decrease in share quarter-over-quarter from Q1 to Q2.

Here are the product categories contributing to Home Depot’s outdoor power equipment share.
- ZTR Mowers: Home Depot’s ZTR unit share rose 9+ pts YoY to 39.5%, remaining the top retailer for ZTRs in the panel (53.6% unit share).
- Pressure Washers: Ryobi dominates at Home Depot with 61% unit share, despite a modest –3 pt YoY dip.
Takeaway
Home Depot held its ground in OPE despite overall category softness, gaining share in ZTR mowers and sustaining dominance in pressure washers through Ryobi. While Lowe’s still leads in ZTRs, strong gains from Cub Cadet and Westinghouse show Home Depot’s ability to stay competitive in high-value segments
Home Depot Market Share: Power Tools Category
Power Tools Leadership Grows
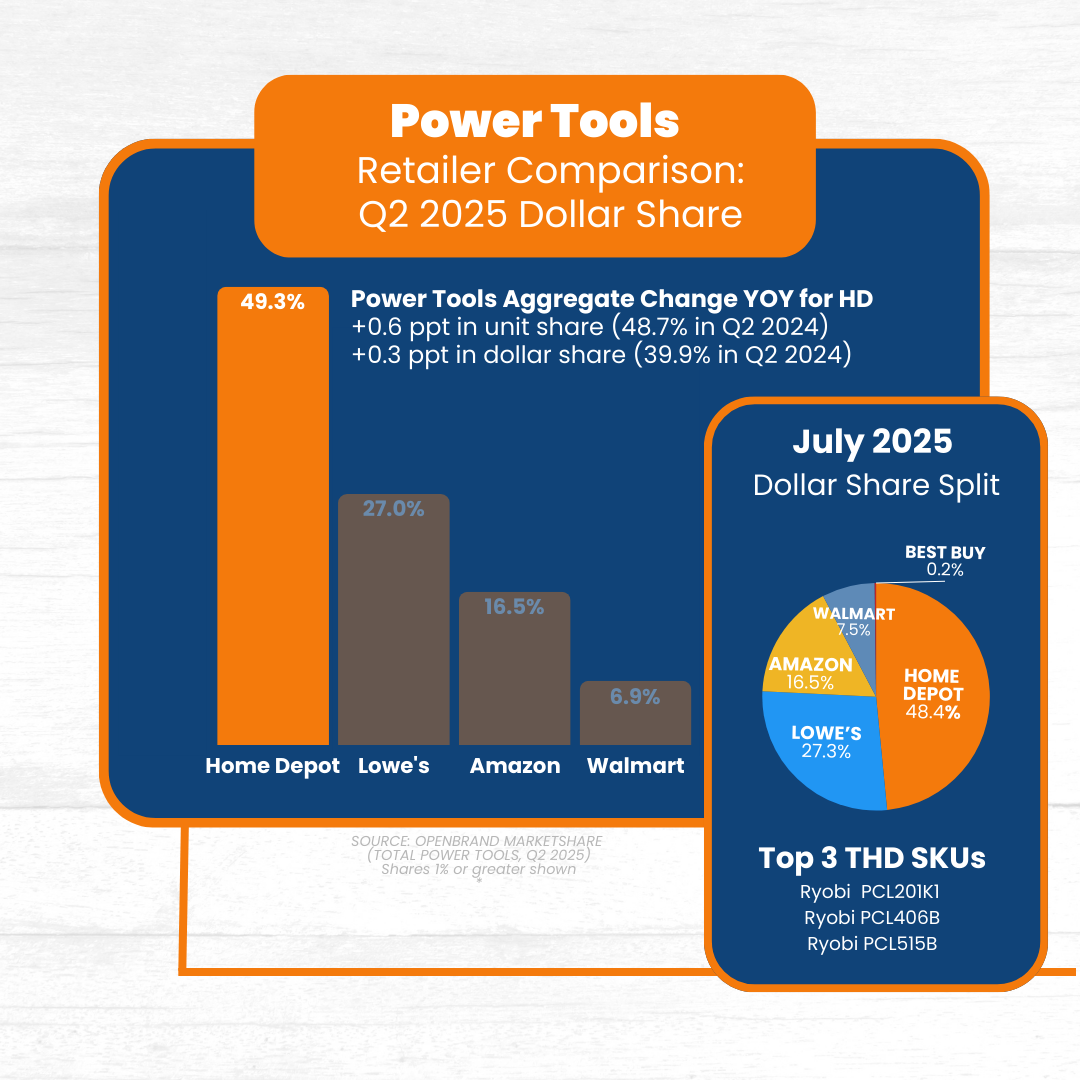
Home Depot maintained leadership in the power tools category in Q2 2025, winning a dominant 49.3% dollar share. Despite signs of pressure in Q1, Home Depot is clearly the share winner, with slight gains (0.3 ppt in dollars and 0.6 ppt in units) YOY.
Power Tools Retailers: Q2 2025 Market Share Split
- Home Depot: 49.3%
- Lowe’s: 27%
- Amazon: 16.5%
- Walmart: 6.9%
- Best Buy: >1%

Here are the product categories contributing to Home Depot’s power tools share.
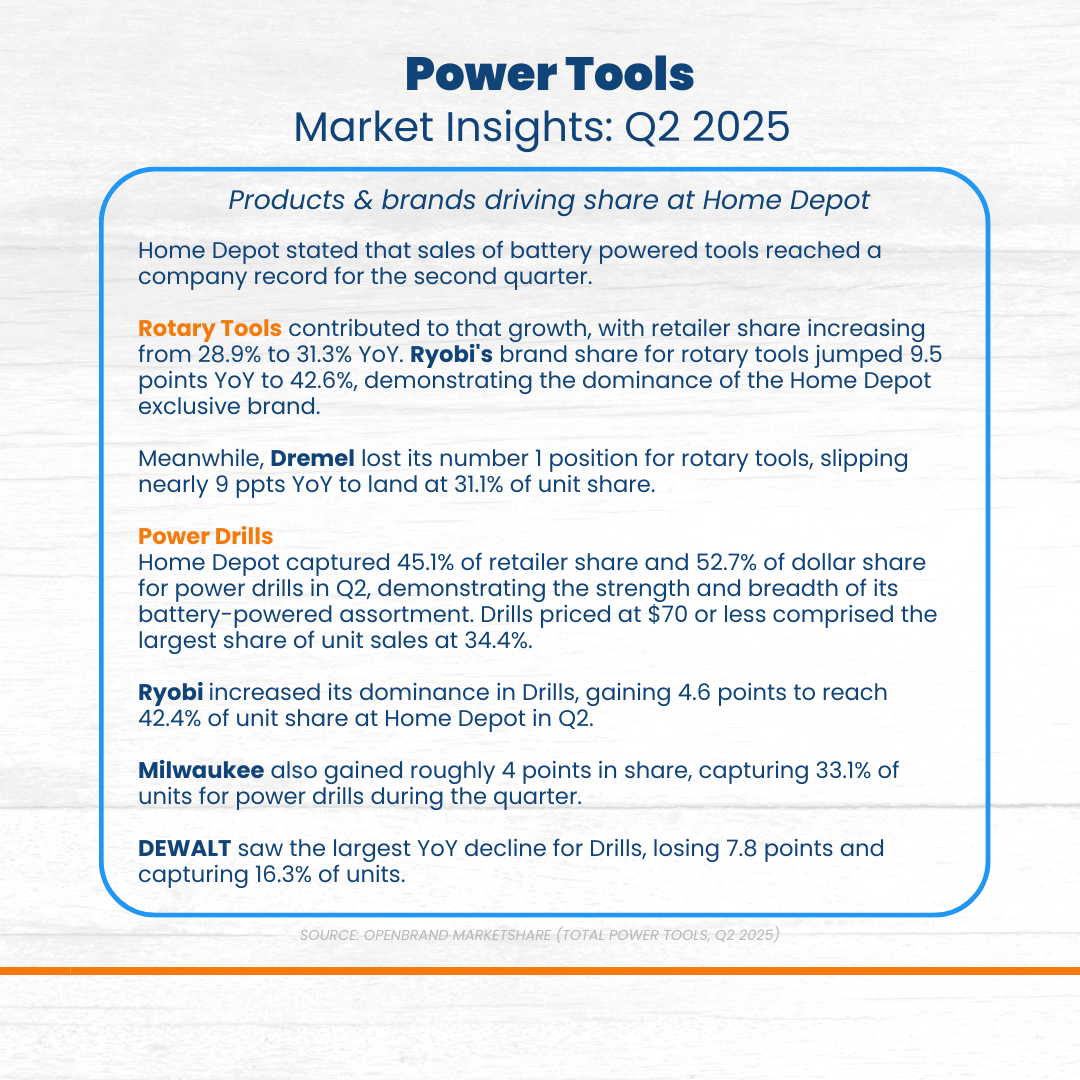
- Rotary Tools: Home Depot’s rotary-tools share grew from 28.9% to 31.3% YoY, buoyed by Ryobi’s strength.
- Power Drills: Home Depot dominated drills with 52.7% dollar share (45.1% unit share) in Q2’25.
Takeaway
Home Depot extended its leadership in Power Tools, setting a new record for battery-powered tool sales. Share gains in rotary tools and drills were fueled by Ryobi and Milwaukee, offsetting declines from DEWALT. Affordable drill pricing and exclusive brand strength reinforced Home Depot’s dominant position.
Where Brands & Retailers Should Focus Now
Home Depot’s earnings results reveal how consumer preferences and competitive dynamics are reshaping category performance – and how that performance can impact overall market share.
Here’s how these takeaways are applicable for competitive brands and retailers in the durables space:
- Private label and exclusivity matter
- Pay attention to performance at the category-level, success depends on product-level positioning as well as brand-level
- Targeted pricing is only effective when paired with demand
- Battery-powered products are winning in power tools and OPE
- Based on purchase driver data, consumers are driven by necessity, not aspiration as they replace rather than upgrade
- Know what to stock as well as when, where, and why it resonates with value-conscious consumers
Monitor Market Share Signals Beneath the Surface
Home Depot’s results showed solid topline growth and operational consistency, but the category-level story reveals more nuance.
If you’re looking to understand the nuances of your market, and get the data you need to effectively manage product mix, pricing, and inventory to grow market share, OpenBrand can help.
Request a custom review of the data available for your business to get started.

Best Buy Earnings: Market Share Breakdown | Q1 FY 2026
Inside Best Buy’s Q1 FY 2026 Earnings
Tariff Turbulence Impetus for Lowering Guidance
Best Buy made several strategic realignments following the Q1 FY 2026 earnings with the biggest result: lowering full-year guidance. Tariff pressures and slowing consumer demand are playing a key role in how many retailers are managing their overall businesses.
Key Q1 FY 2026 Best Buy Earnings Results
- Revenue: $8.8 B (-0.9% YoY)
- YOY Sales Growth: -0.9%
- YOY Comps: -0.7%
- Diluted EPS: $0.95
How did core durables categories impact Best Buy’s performance?
In this blog post, we focus on Best Buy’s market share across major appliances and consumer electronics, highlighting which products and brands impacted share as well as how tariff changes significantly influenced pricing and promotional strategies for the CE powerhouse. We also take a look at where they are breaking ground in the outdoor power equipment and power tools markets.
Best Buy Earnings
Q1 FY2026 Performance & Best Buy Market Share Trends
SWIPE TO SEE FULL REPORT, CLICK TO EXPAND SLIDES


Best Buy Earnings: Major Appliances Share
Discounts Were Not Enough
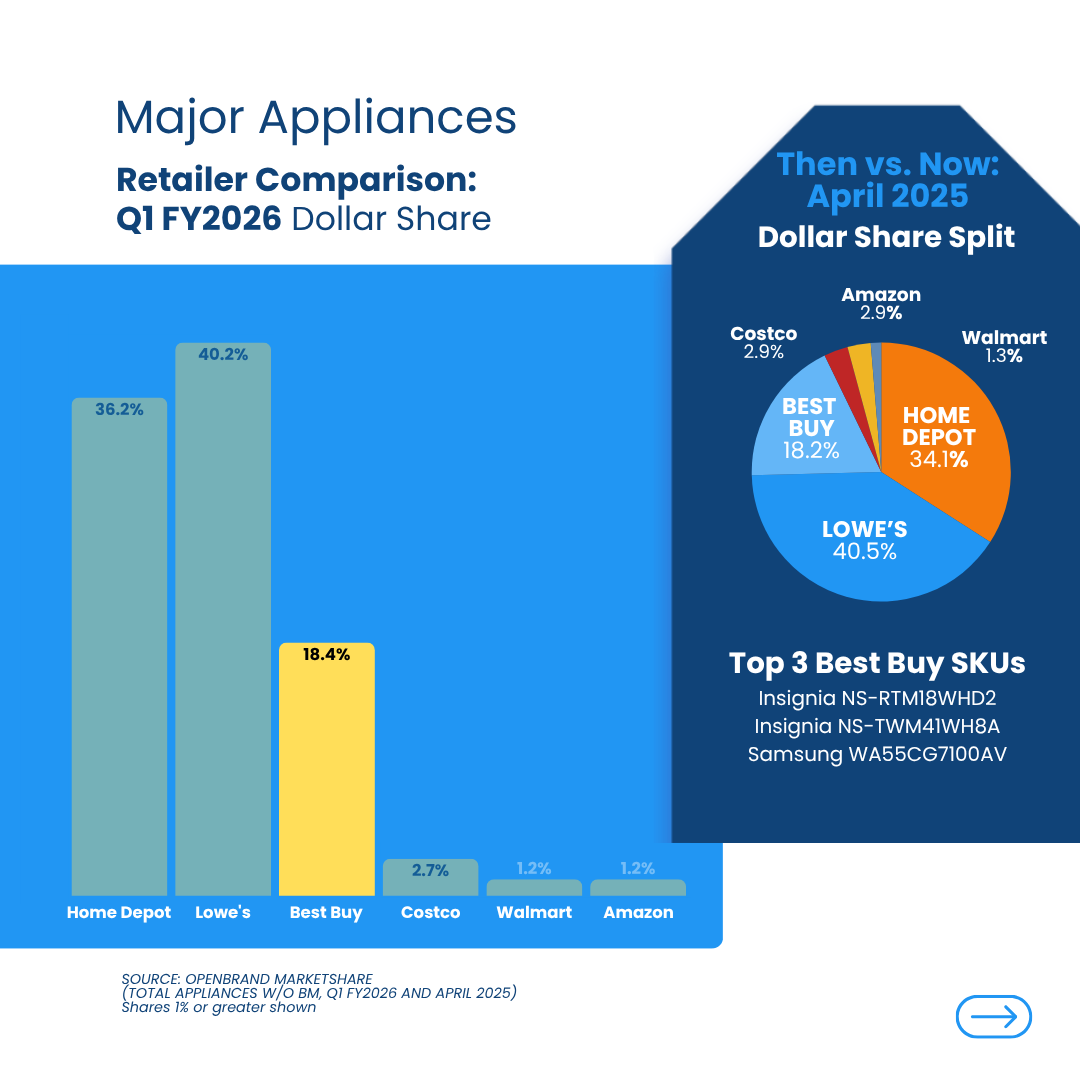
In Q1, Best Buy lost -2.1 ppt in dollar share and -1.0 ppt in unit share YOY in major appliances, despite the aggressive 8% average discount strategy maintained throughout the quarter.
Promotional levels remained consistent with 39% of the assortment on sale, but results were less than favorable.
Best Buy still holds the third place position behind home improvement big boxes Lowe’s and Home Depot with nearly an 18 ppt gap between them for dollar share for major appliances.
Top Major Appliance Retailers: Q1 2025 Dollar Share Split
- Lowe’s: 41.6%
- Home Depot: 36.1%
- Best Buy: 17.9%
- Amazon: 2.7%
- Walmart: 1.6%
Review of the top brands losing share for appliances at Best Buy, Whirlpool and GE saw the biggest declines overall across both unit and dollar share YOY.
While all but one product category lost unit and dollar share. The top product category performer in appliances at Best Buy in Q1 was bottom mount refrigerators.
Bottom mount refrigerators were the only standout performers, driving the largest share gains in both units (+0.9 ppt) and dollars (+0.6 ppt) YOY.
While top load washers underperformed in Q1 it’s worth noting they had the highest average discount YOY.
Key Takeaway
Best Buy’s Q1 appliance results reveal more than just a weak quarter but highlight a broader disconnect between promotional effort and consumer behavior. Despite steady discounting and a competitive assortment size, the retailer lost meaningful share, suggesting that shoppers weren’t persuaded by price alone.
With Whirlpool and GE seeing steep declines, it’s clear that even legacy brands could not offset soft demand and the macroeconomic impacts.
This seems to indicate a shift as consumers are becoming more selective, and increasingly expect value beyond the markdown. They are gravitating toward specific product formats (such as bottom mount refrigerators) that offer functional or premium appeal, rather than responding to promotional volume alone.
For brands, this might mean success will come from innovation and clarity in value proposition, not just presence on the shelf.
For Best Buy, it’s a signal to potentially rethink the appliance strategy, from pricing details to portfolio balance if there is any hope in closing the near 20-point share gap with Home Depot and Lowe’s.
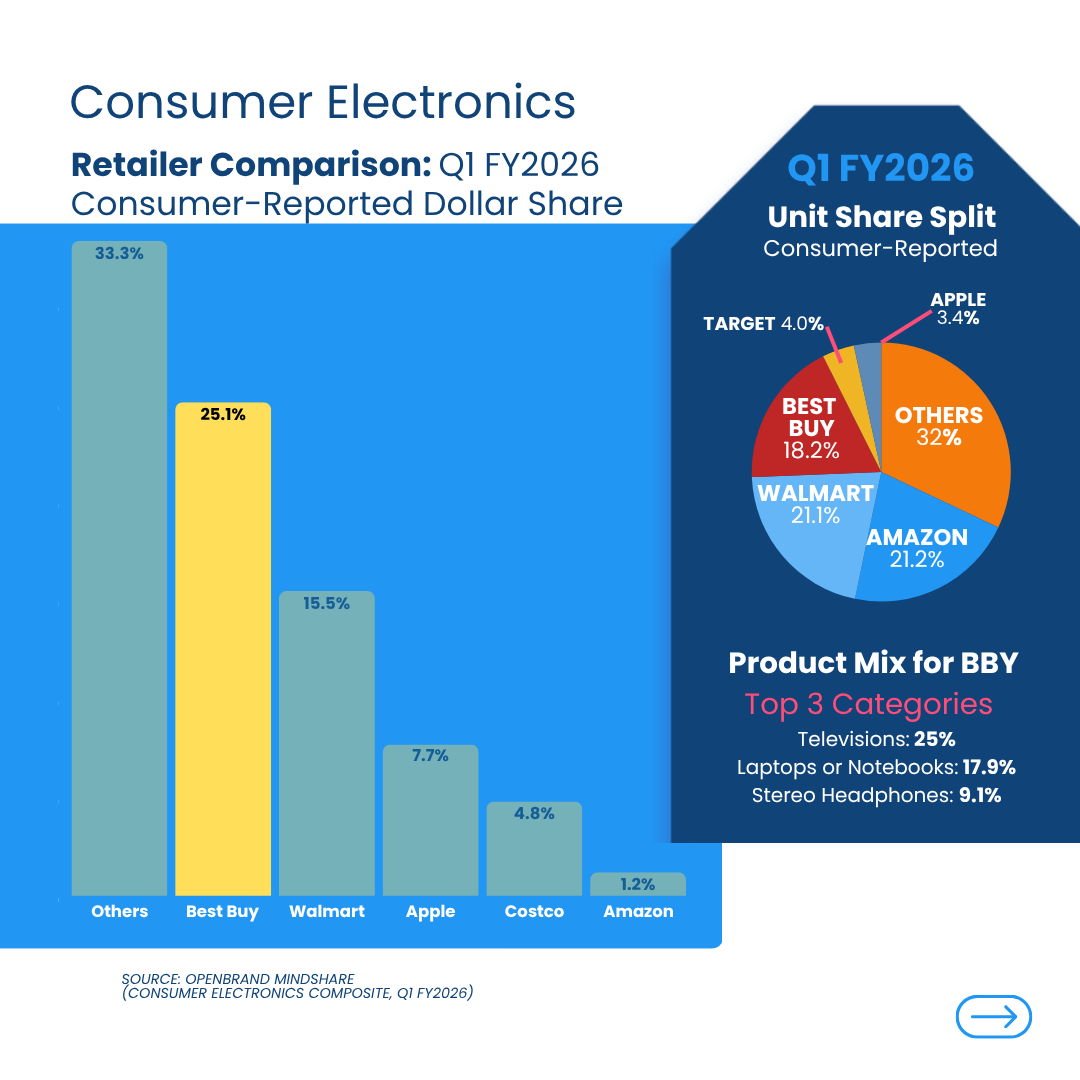
Best Buy Earnings: Consumer Electronics Share
Share Held, Demand Faltered
Best Buy retained 25.1% of consumer-reported CE dollar share, with leading categories like TVs, laptops, and stereo headphones. However, TVs saw no meaningful gains, despite increased promotions and a 20% average discount rate.
- Promotion Note: 64% of TV SKUs were on promo, up 10 ppt YOY
- Category Mix: 50% of SKUs priced under $1,000 with no change YOY
- Most major TV brands contributed to the increase in discounts, Insignia, Roku and Westinghouse were pushing the average higher with 5-7 point increases holding a 29% average discount.
Computing: Assortment-Led Strength
While TVs were down, computing was a bright spot for Best Buy in Q1, helping to drive overall growth for the retailer across CE. Best Buy holds the third-largest notebook assortment (11% of market) which increased +2 ppt year-over-year, focused on high-end SKUs. Despite growing concern around tariffs, notebooks saw a drop in average net price.
- Avg. Net Price: $1,437 (down 2% YoY)
- Promoted Assortment: 37% (down 11 ppt YoY)
- Discounts: Averaged 20%, down slightly
Key Takeaway
Best Buy is staying premium in this space, prioritizing value through model selection over aggressive pricing.
Smartphones: Destination
With 19% of U.S. smartphone SKUs (+7 ppt YOY), Best Buy is second only to carriers in assortment breadth.
This is a huge advantage for the retailer as they are among the top destinations for unlocked phones and one of the only retailers offering multiple postpaid carriers (plus prepaid options), making it a beacon for AT&T, Verizon, and open market buyers. Approximately 58% of SKUs, especially unlocked and postpaid deals, were on promotion in Q1.
- Price bands from $200-$799 saw the highest saturation of promotions this year, which was also true last year, but the premium price tiers seem to be where Best Buy is pulling back focus YOY, a move that could eventually drive flagship level buyers into carrier stores directly
- Avg. Net Price: $863 (up 4% YoY), vs. $207–$378 at Target/Walmart
- 20% off was average smartphone discount in Q1 2025 (the same as last year) still ~12 points behind other major nationals like Target and Walmart, reflecting its more premium product mix
Key Takeaway
Best Buy has solidified its role as a top destination for unlocked and postpaid smartphones, offering the second-broadest assortment in the U.S. behind carriers and catering to premium, open-market buyers. Its promotional strategy remains focused on mid-tier devices, while a pullback on flagship discounts may gradually shift high-end shoppers toward carrier stores.
Tablets: Premium Push Pays Off
Tablets were a positive driver overall for Best Buy. Best Buy leads the U.S. in tablet assortment representing about 13% of market, up +4 ppt overtaking Amazon for the broadest portfolio.
- Promo Share: 50% on promotion in Q1 (+2 ppt YoY) – well ahead of Amazon and mass merchants like Target and Walmart
- Premium Shift: While Best Buy devotes ~20% of shelf space to tablets under $299, but 24% of the assortment was between $1,000–$1,499 – up +8 ppt from 16% last year. Shifts in brands like Apple rose from 47% to 61% of BBY’s tablet mix
- Best Buy’s average discount was 21%, which was driven by more aggressive Asus, Google, and Lenovo deals which rose over +9 points YOY up to 35% off
Key Takeaway
Best Buy has overtaken Amazon as the U.S. leader in tablet assortment, with a strategic shift toward premium devices,especially Apple, driving growth. While half of its tablet SKUs were on promotion in Q1, deeper discounts on brands like Asus, Google, and Lenovo helped support a broader high-end mix and stronger market position.
Best Buy Earnings: Outdoor Power Equipment & Power Tools
Niche Wins Drive Growth
Outdoor Power Equipment
Though a small player at 1.1% share, Best Buy saw unit share gains in walk-behind mowers and pressure washers. Hedge trimmers also grew in units but slipped in dollars.
- Top SKUs: Greenworks GPW1900, Worx WG743
- Category Leaders: Lowe’s 41.9%, Home Depot 36.2%, Amazon 10.0%
Power Tools
Best Buy’s 0.5% market share in power tools is minor, but growth is visible in wet/dry vacuums and power drills, with SKUs from Stanley and Worx leading sales.
- Top SKUs: Stanley SL18116P, Worx WX240L
- Category Leaders: Home Depot 47.8%, Lowe’s 24.7%, Amazon 18.0%
Key Takeaways
While Best Buy remains a niche player in Outdoor Power Equipment and Power Tools, it is gaining early traction in select categories like walk-behind mowers, pressure washers, wet/dry vacuums, and drills, signaling strategic growth opportunities led by brands like Greenworks, Stanley, and Worx.
Where Brands & Retailers Should Focus Now
- For those brands partnering with Best Buy, Q1 results underscore the need to prioritize clarity, flexibility, and alignment with shifting shopper behaviors.
- As tariffs are reshaping cost structures and promotional strategies, brands and retailers must balance agility with transparency to maintain pricing credibilty.
- Essential-use products and value-tier SKUs should take precedence, as consumers continue to weigh necessity over novelty.
- Promotional strategies must remain agile, tailored not just to calendar moments, but to macro pressures like tariffs and sourcing shifts that shape demand in real-time.
- OPE and tools categories are growth opportunities for Best Buy, despite the small but growing presence in walk-behind mowers, pressure washers, and vacuums. Best Buy needs to continue overall category awareness for this space if they hope to make a move to gain share from those retailers leaders like Home Depot and Lowe’s.
Monitor Market Share Signals Beneath the Surface
Retailers need to listen closely to these signals, both the sales and the why behind the wins and losses.
At OpenBrand, that’s what we do. We help brands see beneath the surface: to identify where shopper intent is headed, which segments are heating up (or cooling down), and how to align your pricing and promo playbooks to market realities.
Request a custom review of the data available for your business to get started.

5 Metrics to Watch in Your Next Line Review
A product line review is designed to help you validate that your merchandising plan aligns with the overall goals of your organization. Comprehensive, data-driven metrics are essential for ensuring the accuracy of your line review. Here is a look at 5 key metrics to watch closely in your next product line review.
Online vs. In-Store Shopping and Buying
One of the key purposes of a line review is for retailers and manufacturers to understand how consumers shop for their products. Naturally, this makes understanding where your customers buy essential. Online retail is growing increasingly popular with the convenience and ease it provides. However, it still cannot overcome the key benefits of buying in-store, such as the ability to try products in real-time, avoiding shipping costs, and having immediate access to consumer purchases.
The constant tug of war between online and in-store buying makes this metric a key point to watch in your retailer line review. By better understanding where your customers are buying, you can assure retailers that consumers find the products they’re looking for in the places they’re most likely to look.
This metric can also help you appeal to new retail markets and ensure your product is featured where customers shop the most. For example, say your line review reveals customers are most interested in buying your products online. You can use this information as leverage to expand your share of the digital market and highlight your value to online retailers.
Brand & Retailer Market Share and Sales
How does your business stack up against the competition?
Knowing your market share and sales (as well as your competitors’) can help you better make the case that you and your products have a valuable place on retail shelves.
As you use your line review to help inform essential business decisions, this can also help you gain market share in your industry.
Why Customers Buy
Uncovering why customers buy products or services in your industry can help you appeal to that purchase motivation.
As such, it is essential to explore purchase motivation in your line review. Some common purchase motivators include price, brand loyalty, availability, features, and more. When you clearly display the customer need that your product meets, you give retailers a reason to prioritize your product on their shelves.
Understanding the consumer why is best done through data that reflects the opinions and mindset of your real buyers.
Product Feature Trends
Are you keeping up with the latest trends in your industry? This line review metric can be one of the most revealing in terms of your projected success. Consumers often want the latest and greatest products available to them. If your available features are falling behind, you will need to compensate in another area of buying motivation—such as price. Otherwise, you will find your business relying entirely on brand loyalty.
Retailers want compelling products to attract and retain customers. By keeping track of product feature trends in your line review, you can ensure your products fill unmet needs. Being unique and progressive can make your business an asset to retailers while keeping you ahead of the market.
Competitive Insights
Line reviews are designed to help you retain your place within retail stores and to defend potential competitor threats. Before you can protect your business from trouble, you have to identify where that trouble is coming from. That is where a line review comes in. Line reviews can help you measure and track:
- New brands encroaching on your sales
- Competitive pricing threats
- New competitors entering your retail space
- And so many others
Once you identify these threats, your line review will help you create a data-driven plan of action to keep your business ahead. How is your business different from the competition? What helps you stand out on in-store and online retail shelves? You can improve and hone in on these benefits your business holds and communicate them clearly to retailers in your industry.
Prepare for Your Line Review with OpenBrand
Preparing your line review is easy with the right information on your side. OpenBrand offers all of the metrics, data, and insight you need to prepare for your line review. We provide some of the top businesses in the country with market share data, research, and statistics. Ready to get started? You can schedule a free OpenBrand demo to learn more today!

How to Prepare for a Product Line Review
What is a Product Line Review?
A product line review (PLR) is a retailer’s category checkpoint to confirm the right assortment, pricing, promotions, and merchandising plan for specific customer and sales goals.
A PLR works as a validation process for retailers to confirm their merchandising plan is in line with the overall goals of the organization (e.g., drive traffic, increase sales, create brand loyalty). The primary objective for most retailers is to have the optimal assortment in a product category to meet the needs of the customers they seek to serve. Retailers want to ensure that the products, promotions, pricing, merchandising, and services they offer to customers are the best available – and that they are what their target customers want.
During a PLR, it is your responsibility as the manufacturer and product expert to educate retailers on why your products reflect what the current market wants and why those products are the best offerings for the retailer’s clients. One longtime TraQline client cited data as the primary component for their PLR decisions; “The foundation to every single one of our line reviews was data and how we apply the findings to our product design, pricing, positioning, and market plan while keeping the retailer and its needs at the forefront.”
Retailers may be concerned about a product category or a product’s performance. For example, a retailer may want to understand the market share of Retailer X for a product category such as grills. As a manufacturer, you can provide detailed and nuanced specifics around Manufacturer Y’s share of charcoal grills, percent of grills sold for over $150 at Retailer X, and whether or not buyers favor BOPIS (Buy Online, Pick Up In-Store).
How do I prepare for a Product Line Review?
While PLRs vary from retailer to retailer, many merchants or buyers will provide you with a template to populate with critical category insights. In fact, depending on the retailer, you may go through multiple steps to submit specific pieces of information before a face-to-face meeting. The meeting would then focus on the data you have provided which explains why you are best positioned to work with the retailer. Your actual product line review, which will typically run anywhere from 30 to 90 minutes, will allow you to present the following 4 key elements:
- Your Company Profile
- How your products fit into the market
- What benefits your products will bring to the retailer
- Your marketing plan for the product
The 4 topics you’ll need to present on at a Product Line Review
These meetings often have a hard stop, so you need to ensure you have the following topics prepared to discuss during your review:
1) Your Company profile
Introduce yourself and your team. Explain who your company is and what you do. If you have never worked with this retailer before, you will also need to highlight what products your brand offers, how you’re positioned in the market, and highlight your unique strengths. If you can demonstrate the value of your category knowledge or your supply chain and manufacturing capabilities or expertise in eCommerce, these are important factors for retailers to weigh when selecting manufacturer partners.
2) An overview of the market
While retailers tend to have a good overview of the basics, it is best to come prepared. You should be able to share key elements such as:
- Market size
- Your share of the market
- Your competitors’ shares
- Their competitors’ shares
- Their competitor’s weak spots
Additionally, in presenting competitor shares and weaknesses, be sure to tactfully address how all major retailers are performing in the market (where both their strengths and weaknesses lie). Have their current and historical share sizes on hand. It is also a good idea to have any other key notes about the market as it pertains to your specific product category.
If you are already an OpenBrand client, you will be able to pull much of this data. Furthermore, the interactive analysis gives you many options on how to view the available data. Here are some useful reports that may assist you:
- Draw/close (for retailers) or consideration/close (for brands): Include walk rate and leakage analysis
- Your brand’s market share
- Retailer’s market share + competition
- Product Feature Trends
- Online vs Brick and Mortar
- Brand Penetration for competition
- Competitive Pricing & Promotions Intelligence
- Head to head analysis: Provide gaps in price range, demographics, and features and where you product may serve to fill those gaps
3) Your product information
How is your product different from other products on the market? You need to explain why your product deserves a place on the retailer’s shelves—both in brick and mortar stores and online. You should clearly define how the retailer will benefit from merchandising your products at their stores. This could include one or more of the following reasons:
- Your product fills a gap in their offerings that consumers are seeking
- Your product is positioned directly to compete with a winner at another retailer (via price point, buyer demographics, feature set, etc.)
- Your product is a premium brand with strong consumer loyalty
- Your product is new and innovative and will drive store traffic and grow the category
- Your product’s features improve on what currently exists in the market
Look for the “white space” – your analysis of OpenBrand’s data may reveal that your product fits nicely into a price point not represented by the retailer’s current product offerings. Additionally, your products may command respect due to your brand name, and the retailer can leverage that to attract a larger pool of consumers. These are just a few examples of how you can partner with the retailer to drive their sales overall.
If you have any analyses of POS data, or additional research you’ve conducted yourself or with a research partner, this is the time to highlight it! This may include such topics as why consumers prefer your brand or forward-looking research describing where the market is headed and how your product fills that need. Do not assume that the retailer will already know this information. They may have limitations on what data is available to them
4) A Marketing Plan
Explain how your product will bring new customers to the business and keep repeat customers coming back. This is also a good time to indicate whether you will train sales associates on the new products, and what those training sessions might look like. You may also want to provide examples of possible displays or signage options to catch shoppers’ attention.
Be prepared to discuss whether your model (or further, your brand) will be exclusive to that retailer and for how long. Some merchants prefer exclusivity due to the lure of specific brand names or product features your brand offers.
Make sure your plan includes specifics on how you will help the retailer achieve its sales goals with your brand’s offerings. Don’t be afraid to be creative with coop dollars, product development, longer terms, etc.
What happens after the line review?
After you have completed your presentation, you will work with the retailer to review their options and start designing and implementing the strategy outlined in your product line review and marketing plan. The retailer will provide feedback so you can both decide on the final assortment of products they will sell, along with the retail price of those products. You may also need to decide which SKUs in your current set will need to be removed to accommodate your new products. While the logistics are getting ironed out, you and your retail partner can also review the marketing plan to finalize details such as signage, advertising, or training for sales associates.
Product Line Review FAQs
What do retailers evaluate during a product line review?
Retailers typically evaluate how well your assortment fits their shoppers, how your pricing lands versus competitors, what your promotional plan looks like, which features are trending, and how your products can support traffic, conversion, and loyalty.
What should a manufacturer bring to a product line review?
Bring a clear story backed by data, including market size, your share, competitor benchmarks, key price tiers, channel trends (online vs in-store, BOPIS), and a simple explanation of the gap your lineup fills for the retailer.
How long is a typical product line review meeting?
Most product line review meetings run about 30 to 90 minutes, so it helps to prioritize the highest-impact insights and keep supporting details ready as backup.
What data matters most in a line review?
The most persuasive data connects shopper behavior to retailer outcomes, including market and retailer share, draw and close rates, price bands, feature trends, channel mix, and customer or demographic signals that explain who buys and why.
How do you present competitor insights without sounding combative?
Use objective benchmarks and focus on opportunity. Frame competitor data as “where the retailer can win” by highlighting assortment gaps, pricing whitespace, and unmet shopper needs rather than criticizing other brands or retailers.
What is “white space” in assortment strategy?
White space is an unmet opportunity in the current assortment, such as a missing price point, feature set, style, or customer segment that shoppers want and your product can serve.
Product Line Review and Research Support at OpenBrand
A product line review does not need to be an overwhelming process – preparation and quality data are key. You can access your OpenBrand subscription to help build and support your line review, which will enable you to provide actionable insights that benefit both your business and your retail partner’s bottom line. By coming prepared with actionable data, such as the data you can access as an OpenBrand client, you are well on your way to establishing the value you and your products can provide to your retail partners. Do you have more questions about the best reports to bring to your next line review? Contact the OpenBrand team today to learn more about how our reporting will make your review stress-free.