

Inside the Home Depot Q3 2025 Earnings Call
Home Depot’s Q3 2025 earnings call confirmed solid top-line growth in a cautious consumer environment, driven by seasonal strength and ongoing interest in small-scale home improvement projects.
Key Q3 2025 Home Depot Earnings Call Results
- Revenue: $41.4B
- YOY Sales Growth: +2.8%
- YOY Comps: 0.2%
- Diluted EPS: $3.62
As we review Q3 earnings we will dig deeper into what role did Home Depot’s core durables categories played in shaping this growth?
In this blog post, we analyze Home Depot’s market share across major appliances, outdoor power equipment, and power tools in order to highlight what is driving gains, where share is slipping, and how different products, brands, and promotions play into it all.
Check out the full report now and read our analysis of the data below.
Home Depot Earnings Call
Q3 2025 Performance & Home Depot Market Share Trends
SWIPE TO SEE FULL REPORT, CLICK TO EXPAND SLIDES


Home Depot Market Share: Major Appliances Category
Share Leadership Narrows the Gap
In Q3 2025, Home Depot’s market share saw a slight increase of +0.6 percentage points (ppt) year-over-year (YOY), winning 35% of consumer dollars. This maintains their second place position, behind Lowe’s, for leading retailer of major appliances; Lowe’s leads the major appliance market with 37.7% dollar share.
Top Major Appliance Retailers: Q3 2025 Dollar Share Split
- Lowe’s: 37.7%
- Home Depot: 35%
- Best Buy: 16.9%
- Amazon: 3.2%
- Walmart: 2.4%

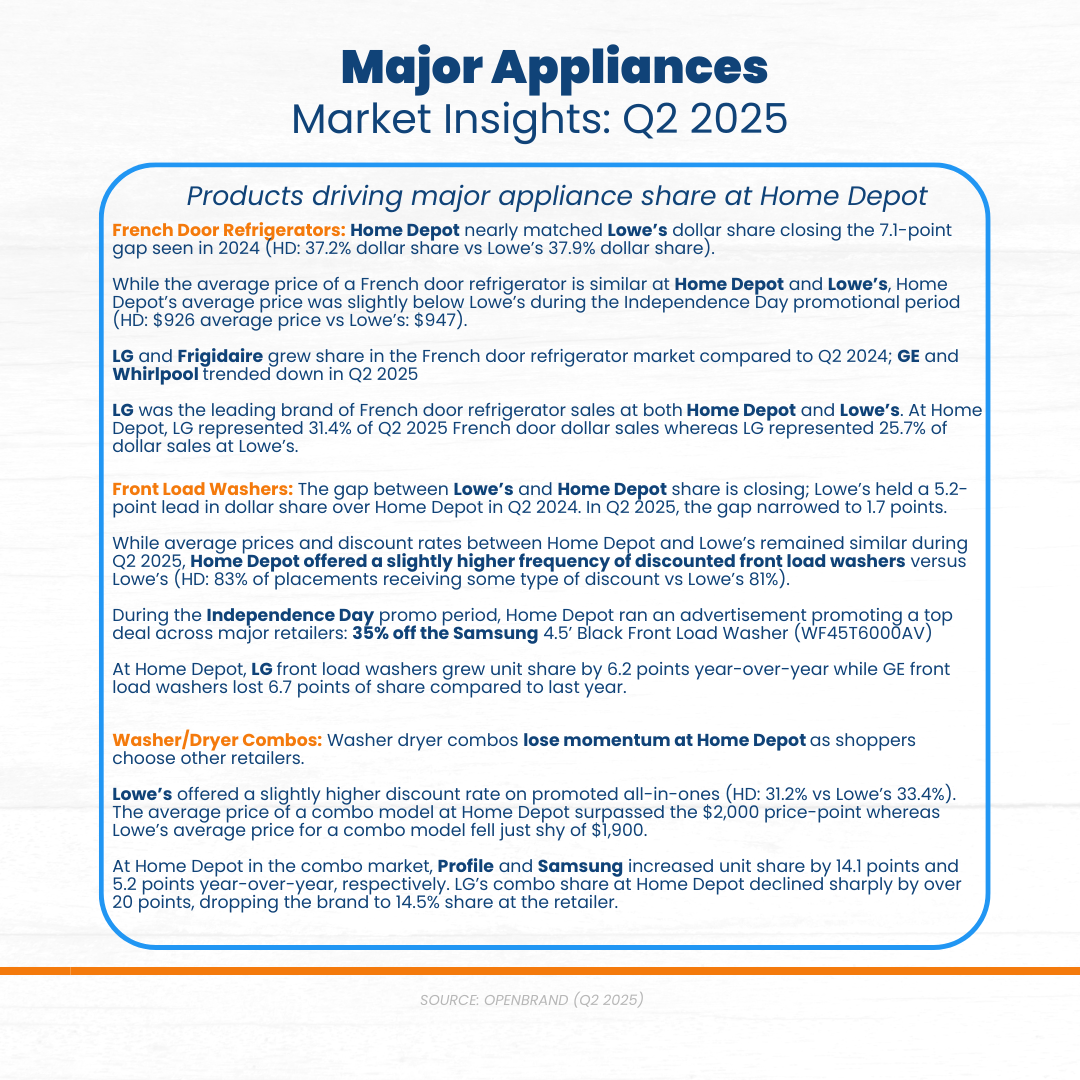
Laundry played a vital role in Home Depot’s slight bump in share for Q3. Here are the product categories that contributed to Home Depot’s major appliance share in Q3.
- Washer/Dryer Combos: Home Depot captured 54% of the unit sales across major retailers with this +16 ppt YoY increase for washer/dryer combos. In Q3, Samsung offered an average discount rate of 28% on promoted all-in-one models surpassing Best Buy’s average discount rate of 23% on their Samsung all-in-ones.
- Front Load Washers: Home Depot closed the gap between it’s number one competitor, Lowe’s, up nearly +3 ppt and taking the lead with 35% dollar share for front load washers.
- Side-by-side: Home Depot saw a -4.6 ppt decline as Lowe’s picked up +3.1 ppts but they continue to hold an equal share of 35% for side-by-side refrigerators.
OpenBrand’s Key Takeaway
Home Depot tightened the race in the major appliances category in Q3 2025, narrowing the gap with Lowe’s as strategic wins in laundry drove meaningful share gains. Strong performance in washer/dryer combos fueled by aggressive Samsung promotions and renewed momentum in front-load washers helped Home Depot lift its dollar share to 35%. While they faced pressure in side-by-side refrigerators, their growth in high-impact laundry segments underscores how promotional strategy and category depth can shift competitive dynamics even in a tight, mature market.
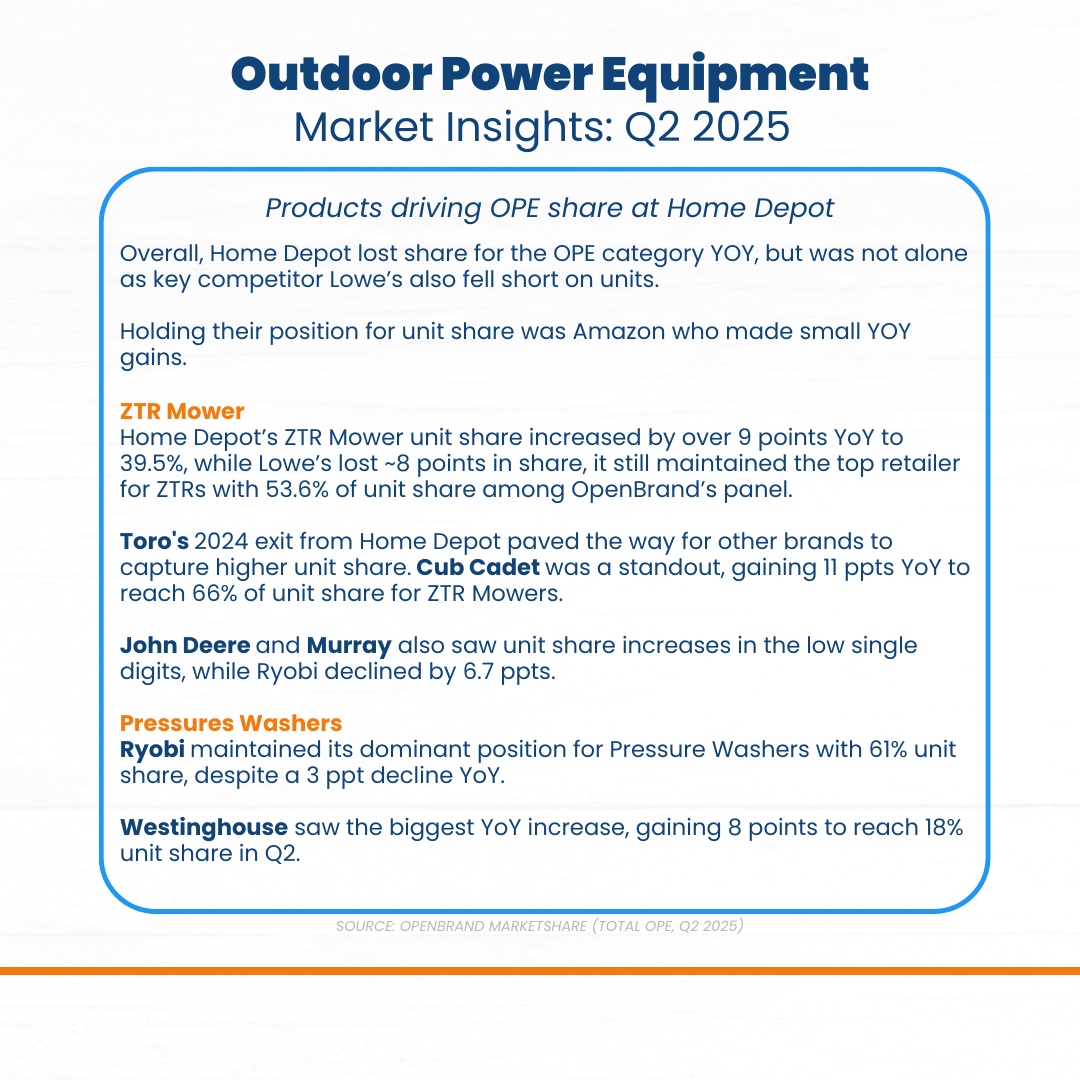
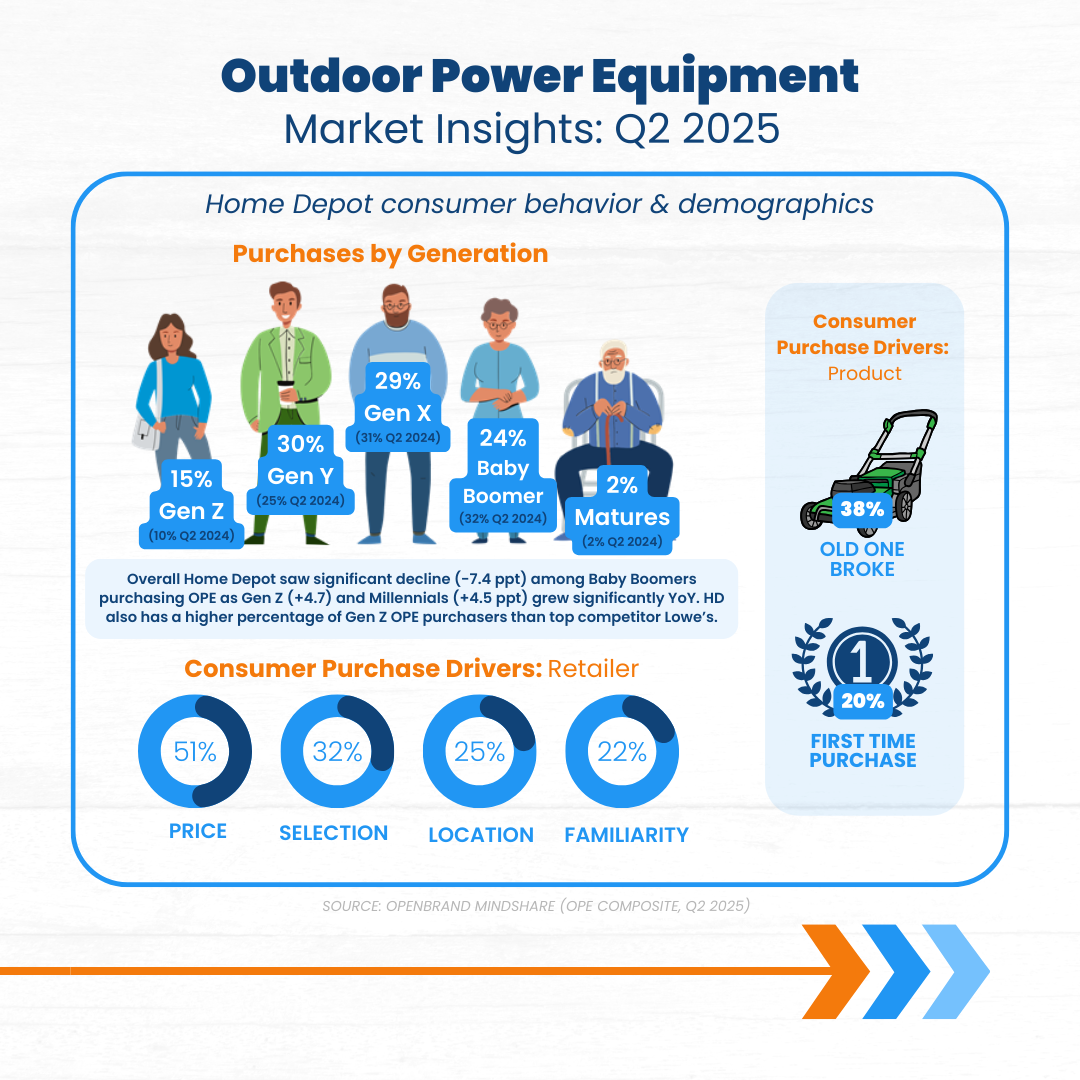
Home Depot Market Share: Outdoor Power Equipment Category
Category Gains Secure Share Leader Position
Home Depot saw an increase in outdoor power equipment market share in Q3 2025, with +0.9 ppt in dollar share and +2.1 ppt in unit share YOY. The positive gains gave Home Depot their place as dollar share leader for outdoor power equipment, coming in ahead of Lowe’s with +1.7 ppt more share.
Top Outdoor Power Equipment Retailers: Q3 2025 Dollar Share Split
- Home Depot: 41.0%
- Lowe’s: 39.3%
- Amazon: 10.1%
- Walmart: 8.5%
- Best Buy: 1.0%
While Amazon is nearly 30 ppts behind either Home Depot or Lowe’s in market share they are continuing to make major traction for the category. So much so that review of the October data indicates Amazon has 13.2% dollar share .

Here are the product categories contributing to Home Depot’s outdoor power equipment share.
- Hedge Trimmers: Results indicated hedge trimmers had the strongest category growth eithin OPE. Ryobi held 50% unit share in Hedge Trimmers and Chainsaws, as well as dominated the $100-149 price band for both categories.
- Chain Saws: Ryobi was also strong across $150-199 price band for Chainsaws. Milwaukee took the lead for instant savings promotions for handhelds in Q3, holding 76% of offers captured. In addition, Milwaukee has the largest chainsaw assortment accounting for 19% of the SKUs tracked this quarter.
Takeaway
Home Depot solidified its leadership in the outdoor power equipment category in Q3 2025, posting gains in both dollar and unit share that pushed it nearly two points ahead of Lowe’s. The retailer’s momentum was fueled by outperformance in fast-growing segments like hedge trimmers and chainsaws, where Ryobi’s strength across key price bands helped drive significant share. While Amazon remains far behind the category leaders, its rapid uptick, reaching 13.2% dollar share in October, signals emerging competitive pressure that could reshape the landscape heading into 2026.
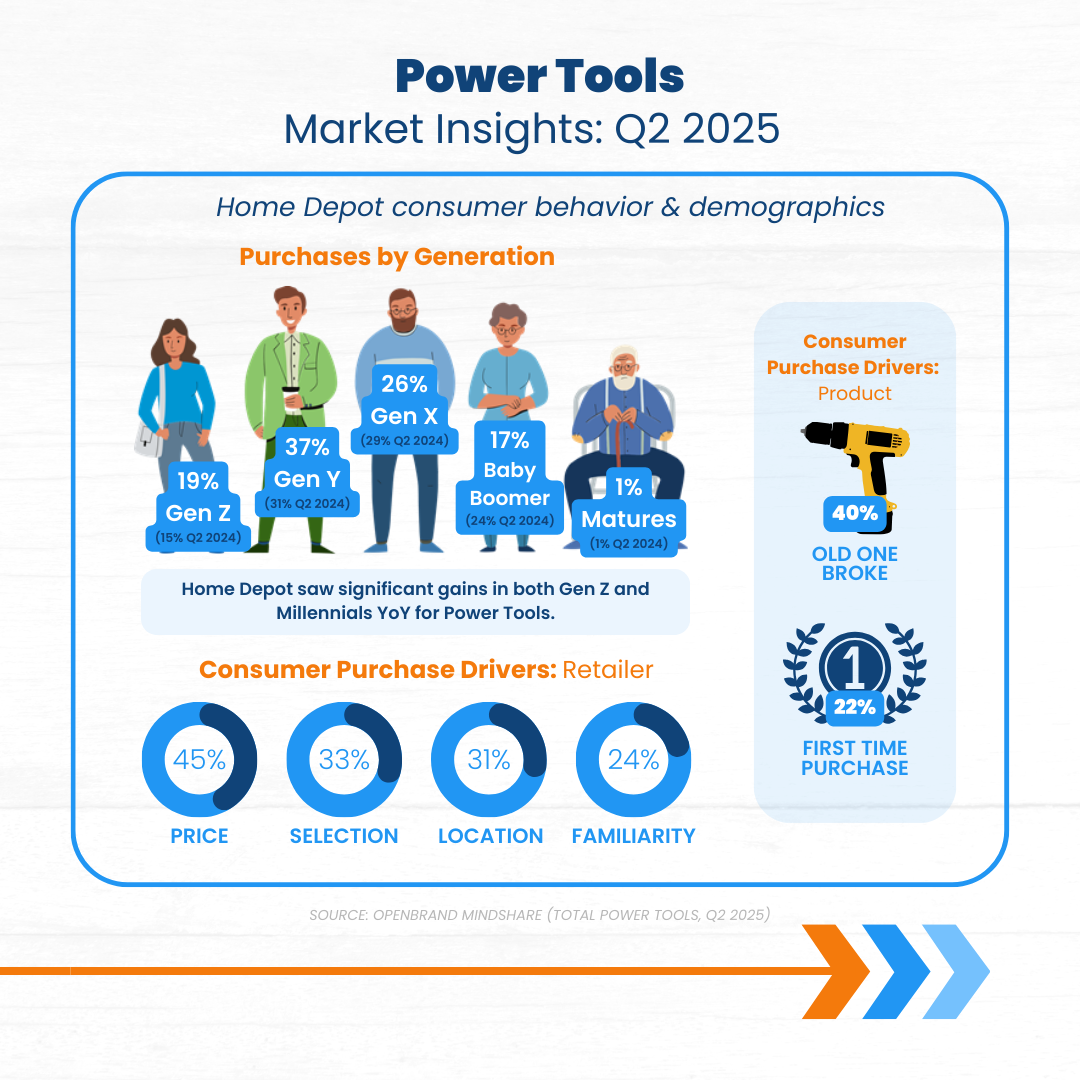
Home Depot Market Share: Power Tools Category
Power Tools Leadership Grows
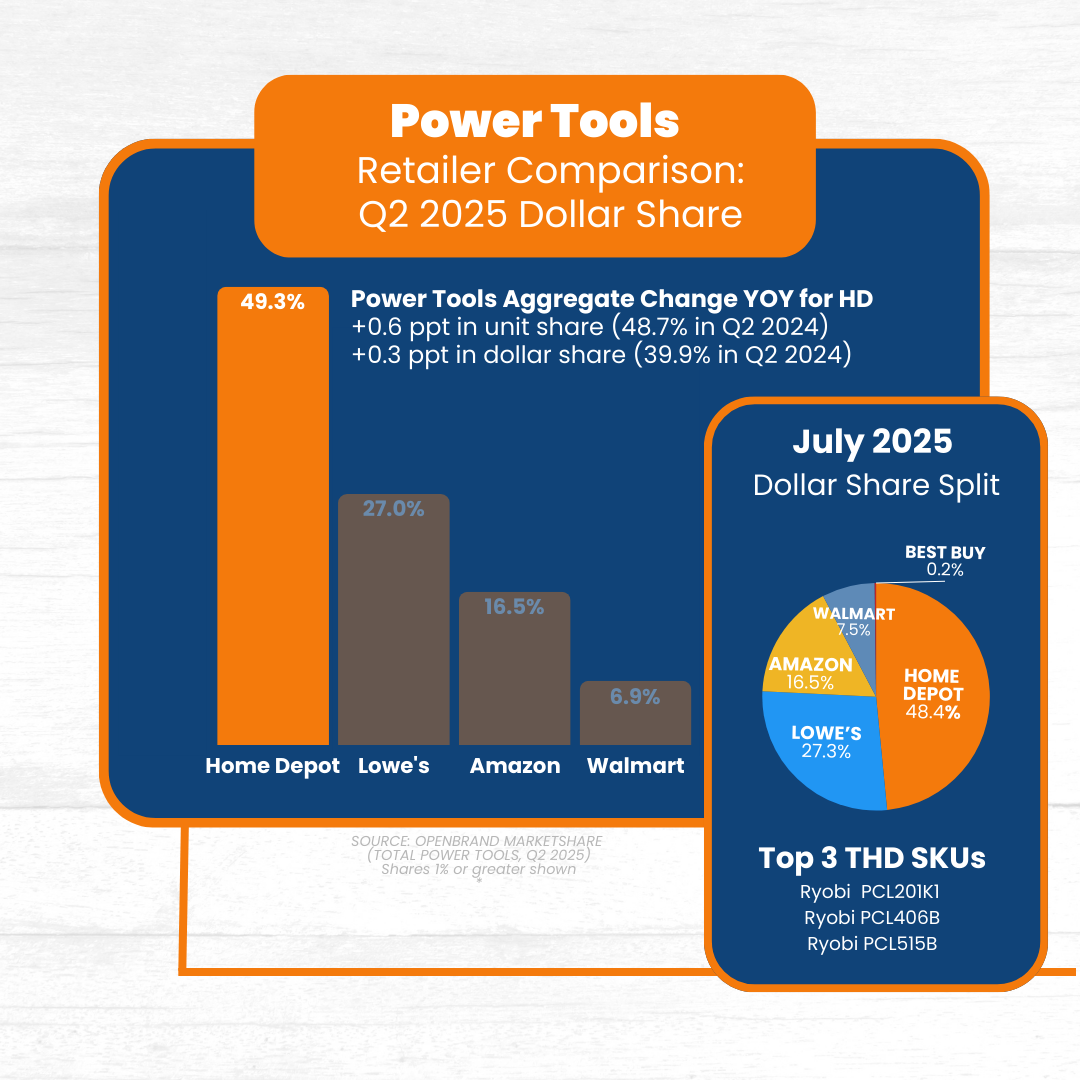
Despite a slight decline in dollar share (-0.4 ppt), Home Depot maintains its hold over the power tools category for Q3 2025, winning 49% dollar share. Home Depot is clearly the share winner dominating the category over other key players with the category sited as a contributor to positie big-ticket sales which grew for the retailer 2.3% in Q3.
Power Tools Retailers: Q3 2025 Market Share Split
- Home Depot: 49%
- Lowe’s: 26.9%
- Amazon: 15.8%
- Walmart: 7.9%

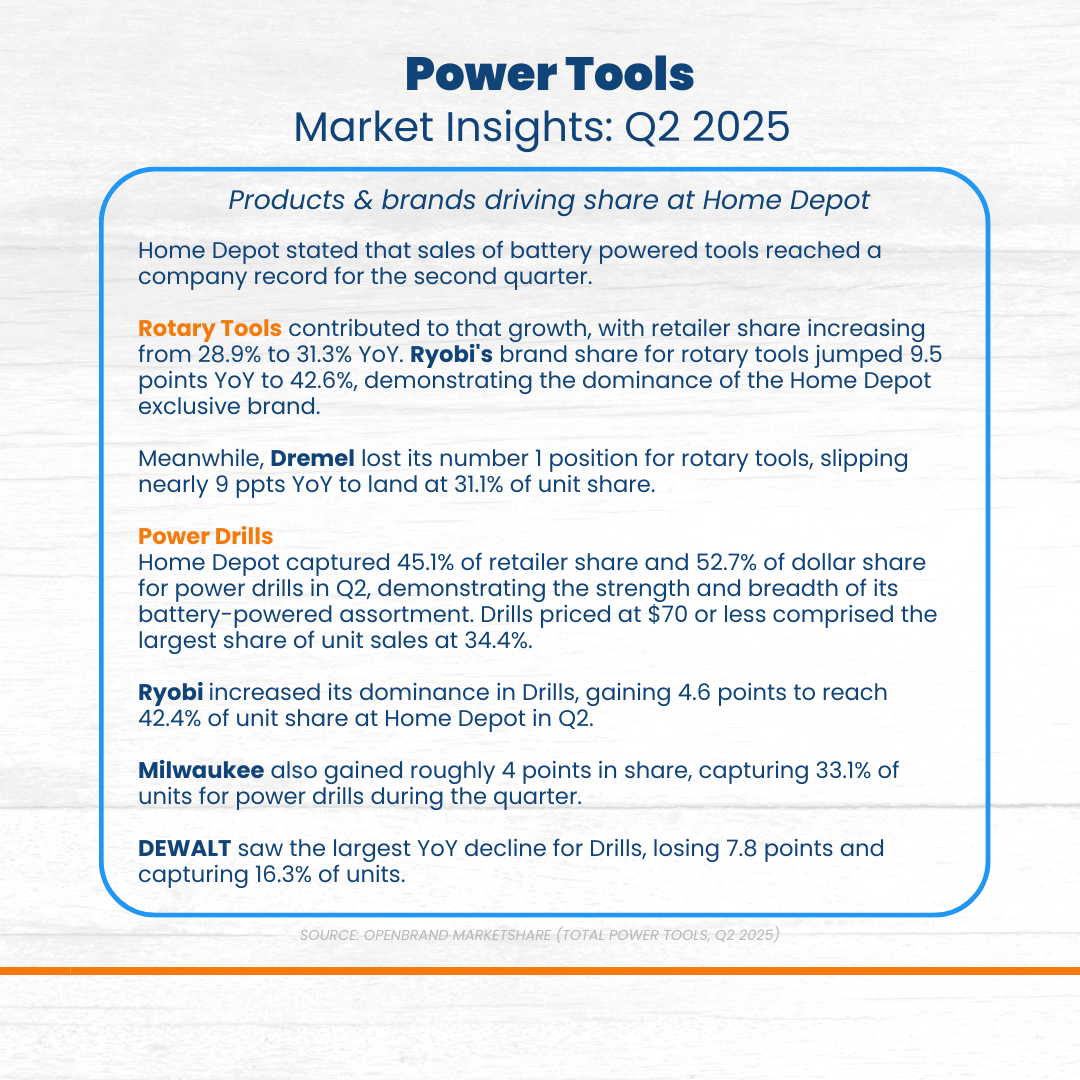
Here are the product categories contributing to Home Depot’s power tools share.
- Share of power tools priced $200+ increased +3 ppt YoY for Home Depot with Dewalt the key driver as they saw a jump of $200+ priced tools from 20% to 30% YoY.
- Air Compressors: Air Compressors drove share in power tools across both units and dollars YoY (+5.8 ppts and +4.7 ppts, respectively).
- Circular Saws: Circular Saws had the most significant drop in dollar share YoY (-7.6 ppts) suggesting a shift towards cheaper models, deeper discounts on value-priced assortments and an increase in the competitive landscape for higher-end tiers across retailers.
Takeaway
Home Depot continues to dominate the power tools category, commanding 49% dollar share even amid a slight YoY dip. Strength in higher-priced tools, particularly $200+ models driven by Dewalt, as well as strong gains in air compressors helped offset softness in circular saws, where intensified competition and deeper discounting pressured share. Overall, the category remains a major contributor to Home Depot’s big-ticket performance, reinforcing its leadership position despite evolving market dynamics.
Where Brands & Retailers Should Focus Now
Home Depot’s earnings results reveal how consumer preferences and competitive dynamics are reshaping category performance – and how that performance can impact overall market share.
Here’s how these takeaways are applicable for competitive brands and retailers in the durables space:
- Double Down on High-Impact Growth Segments
- Calibrate Promotional Strategy to Consumer Expectations
- Strengthen Assortment in Value + Premium Price Bands
- Partner strategically to build differentiated category depth
- Monitor fast-moving competitors like Amazon, who are gaining traction through price and convenience
- Adopt real-time intelligence to respond quickly as market conditions shift
Monitor Market Share Signals Beneath the Surface
Home Depot’s results showed solid topline growth and operational consistency, but the category-level story reveals more nuance.
If you’re looking to understand the nuances of your market, and get the data you need to effectively manage product mix, pricing, and inventory to grow market share, OpenBrand can help.
Request a custom review of the data available for your business to get started.
Related blogs
Explore Our Data
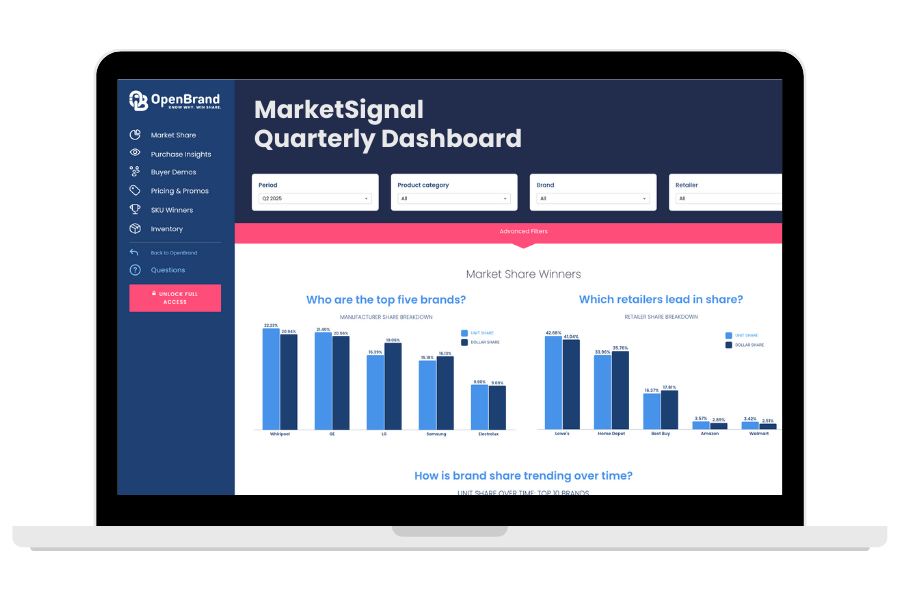
Free Quarterly Dashboards
Explore category-level data dashboards, built to help you track category leaders, pricing dynamics, and consumer demand – with no subscription or fee.
Related blogs

Consumer Price Index: Durable Goods | May 2026
This is the June 2026 release of the OpenBrand Consumer Price Index (CPI) – Durable Goods…

Winning Seasonal Promotions: Real-Time Pricing Intelligence Playbook
How Pricing and Insights Teams Use OpenBrand’s Real-Time Intelligence to Win Seasonal…

Outdoor Cooking Market Insights: Top Grill Brands, Share & Retail Trends
As consumers head into another grilling season, the outdoor cooking market continues to evolve…

Outdoor Power Equipment Market Share: Q4 2025 Trends & Rankings
The Outdoor Power Equipment (OPE) market closed out 2025 with noticeable shifts in how share is won…