


Q2 RESULTS UPDATED ON 08/27/2025
Inside the Home Depot Q2 2025 Earnings Call
Home Depot’s Q2 2025 earnings call confirmed solid top-line growth in a cautious consumer environment, driven by seasonal strength and ongoing interest in small-scale home improvement projects.
Key Q2 2025 Home Depot Earnings Call Results
- Revenue: $45.3B
- YOY Sales Growth: +4.9%
- YOY Comps: 1.0%
- Diluted EPS: $4.58
Digging deeper, what role did Home Depot’s core durables categories play in shaping this growth?
In this blog post, we analyze Home Depot’s market share across major appliances, outdoor power equipment, and power tools in order to highlight what is driving gains, where share is slipping, and how different products, brands, and promotions play into it all.
Check out the full report now and read our analysis of the data below.
Home Depot Earnings Call
Q2 2025 Performance & Home Depot Market Share Trends
SWIPE TO SEE FULL REPORT, CLICK TO EXPAND SLIDES


Home Depot Market Share: Major Appliances Category
Share Leadership Gap Shrinks
In Q2 2025, Home Depot’s market share saw a slight increase of +3.1 percentage points (ppt) year-over-year (YOY), winning 36.9% of consumer dollars. This maintains their place as second leading retailer for major appliances, coming in behind Lowe’s, who leads the major appliance market with 40% dollar share.
Top Major Appliance Retailers: Q2 2025 Dollar Share Split
- Lowe’s: 40%
- Home Depot: 36.9%
- Best Buy: 18.4%
- Amazon: 2.9%
- Walmart: 1.9%

Here are the product categories that contributed to Home Depot’s major appliance share in Q2.
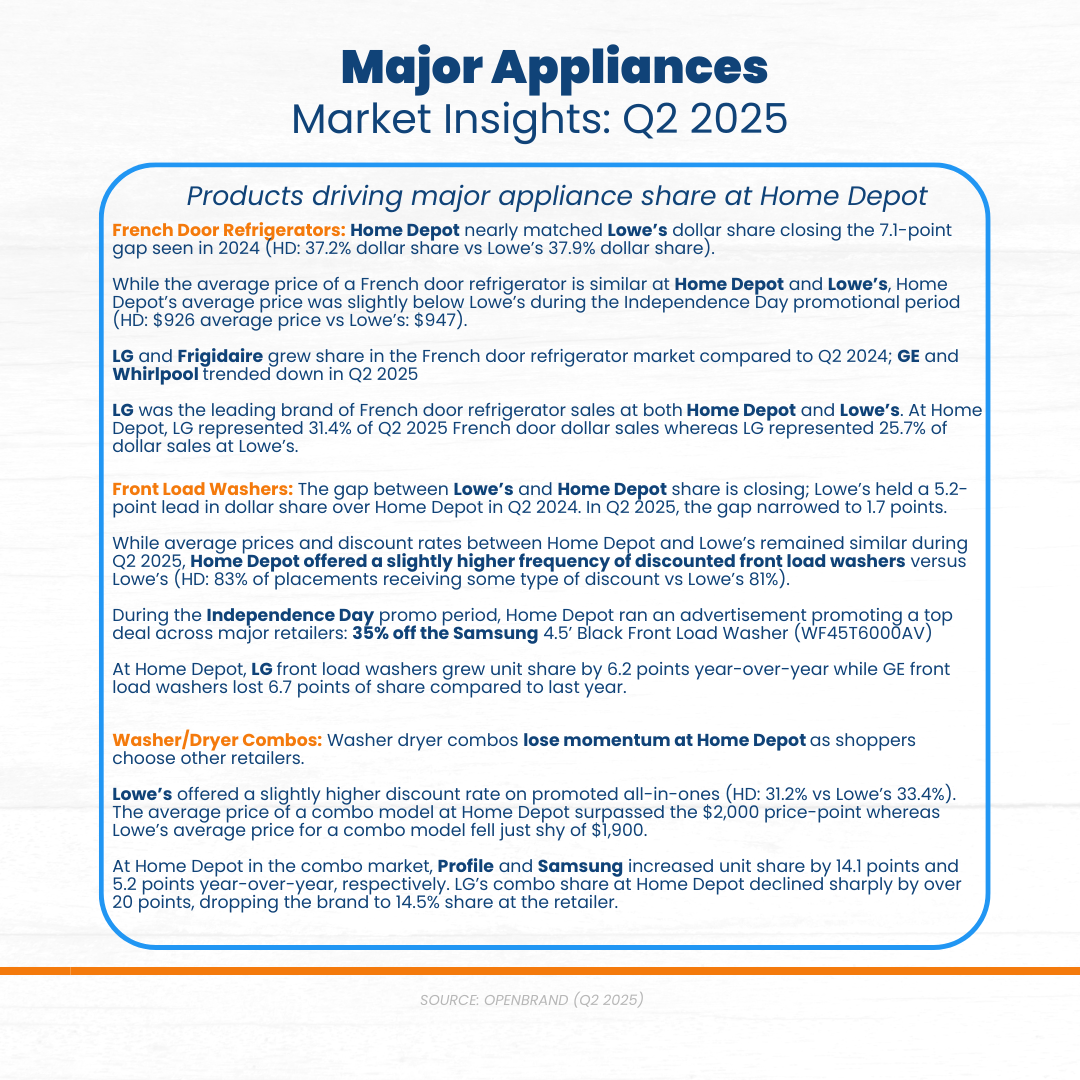
- French Door Refrigerators: Home Depot nearly tied Lowe’s on dollar share in Q2’25—37.2% vs 37.9%, closing last year’s 7.1-pt gap to just 0.7 pt.
- Front Load Washers: The Lowe’s lead shrank — gap narrowed to 1.7 pts (from 5.2 pts in Q2’24).
- Washer/Dryer Combos: Momentum softened at Home Depot; LG’s combo share fell 20+ pts to 14.5%, even as Profile and Samsung gained.
OpenBrand’s Key Takeaway
Home Depot strengthened its appliance position in Q2, closing share gaps with Lowe’s in front load washers and French door refrigerators through aggressive promotions and strong LG sales. While washer-dryer combos underperformed, gains in higher-demand formats lifted overall unit and dollar share growth.
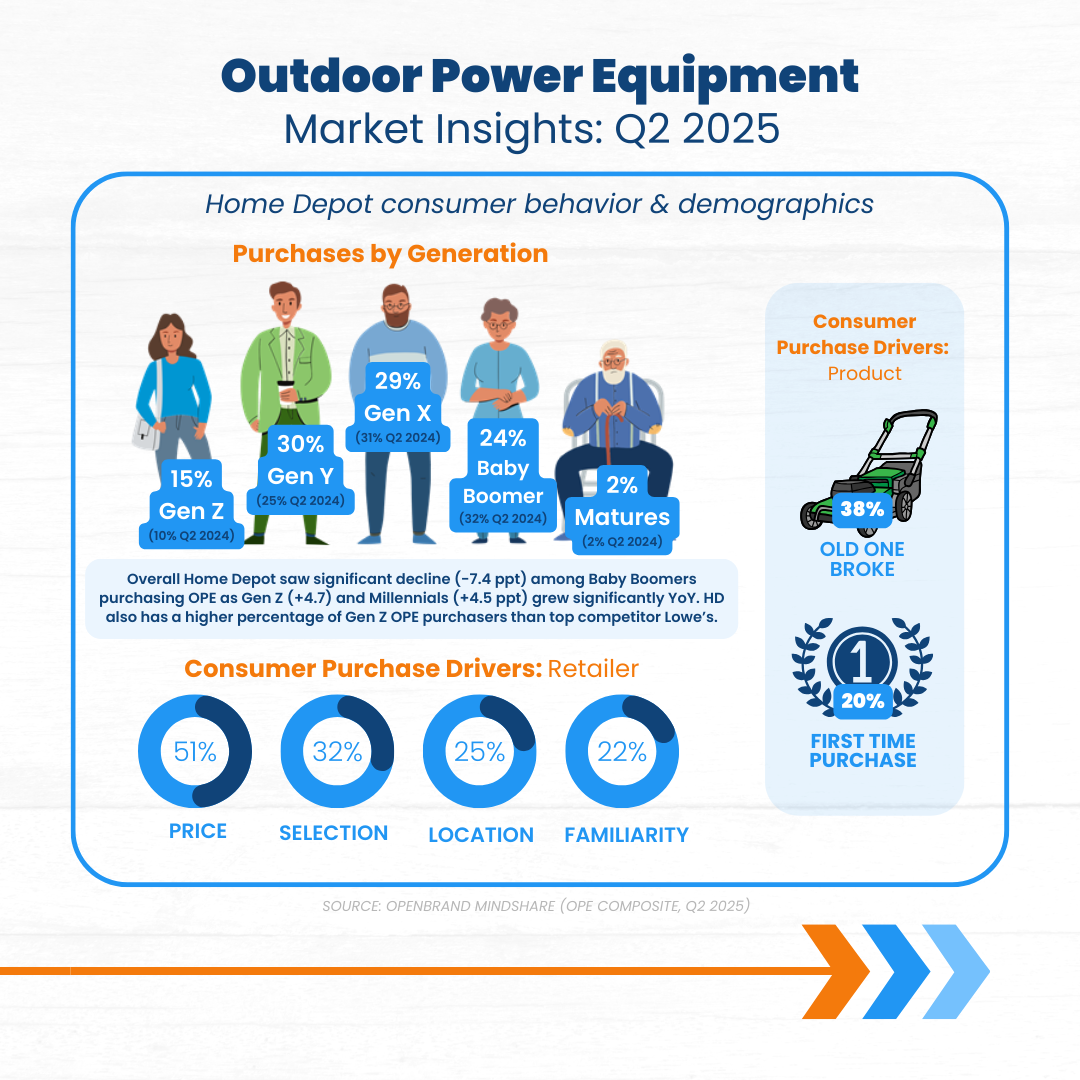
Home Depot Market Share: Outdoor Power Equipment Category
Category Gains, But Share Leader Position Lost
Home Depot saw a slight decline in outdoor power equipment market share in Q2 2025, seeing +1.8 ppt in dollar share and +0.7 ppt in unit share YOY.
Despite these gains, Home Depot lost their place as dollar share leader for outdoor power equipment, coming in just below Lowe’s with 1.6 ppt less share.
Top Outdoor Power Equipment Retailers: Q2 2025 Dollar Share Split
- Home Depot: 39.2%
- Lowe’s: 40.8%
- Amazon: 8.9%
- Walmart: 13%
- Best Buy: 1.2%
Despite being up in Q1 by 1 ppt YOY, Amazon saw a decrease in share quarter-over-quarter from Q1 to Q2.

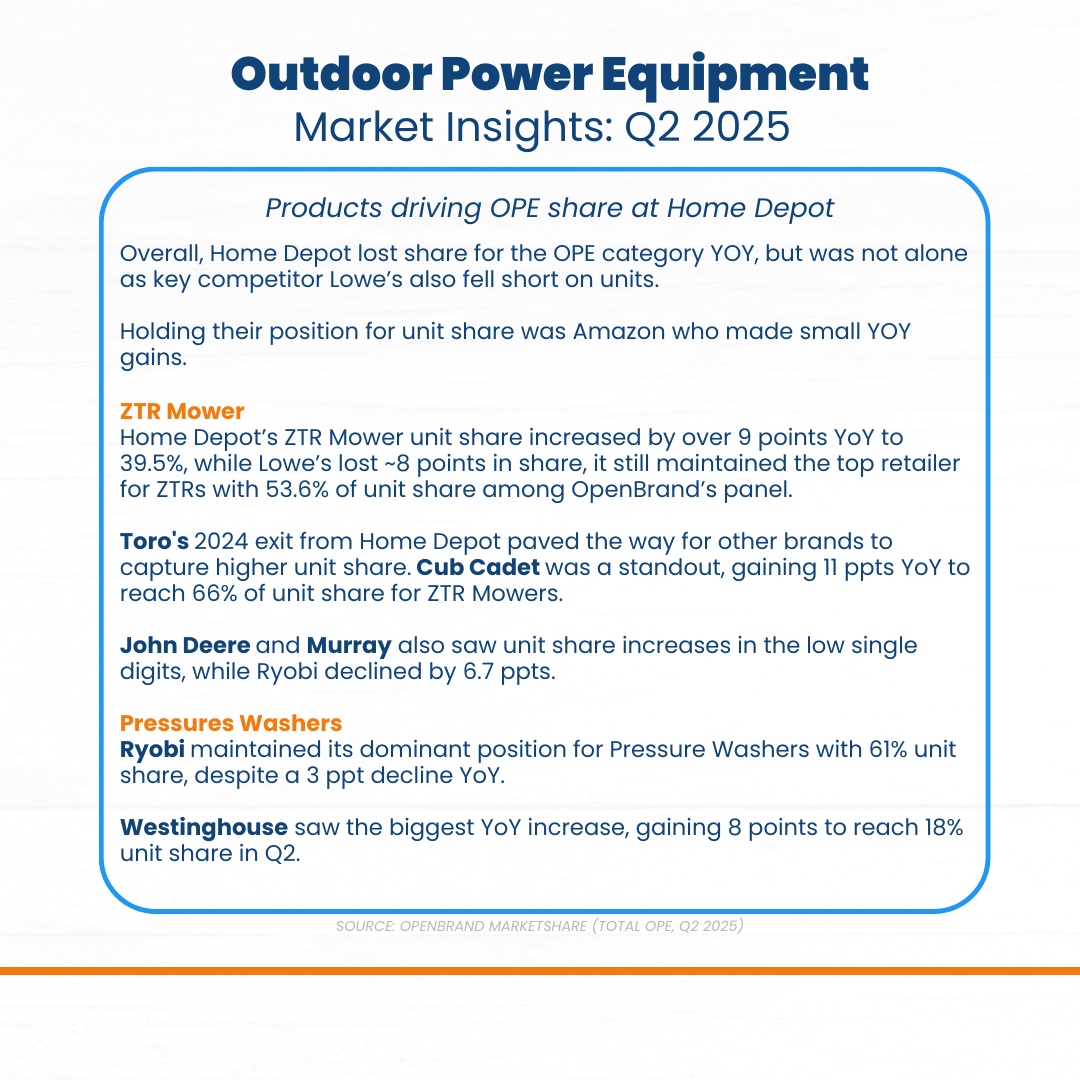
Here are the product categories contributing to Home Depot’s outdoor power equipment share.
- ZTR Mowers: Home Depot’s ZTR unit share rose 9+ pts YoY to 39.5%, remaining the top retailer for ZTRs in the panel (53.6% unit share).
- Pressure Washers: Ryobi dominates at Home Depot with 61% unit share, despite a modest –3 pt YoY dip.
Takeaway
Home Depot held its ground in OPE despite overall category softness, gaining share in ZTR mowers and sustaining dominance in pressure washers through Ryobi. While Lowe’s still leads in ZTRs, strong gains from Cub Cadet and Westinghouse show Home Depot’s ability to stay competitive in high-value segments
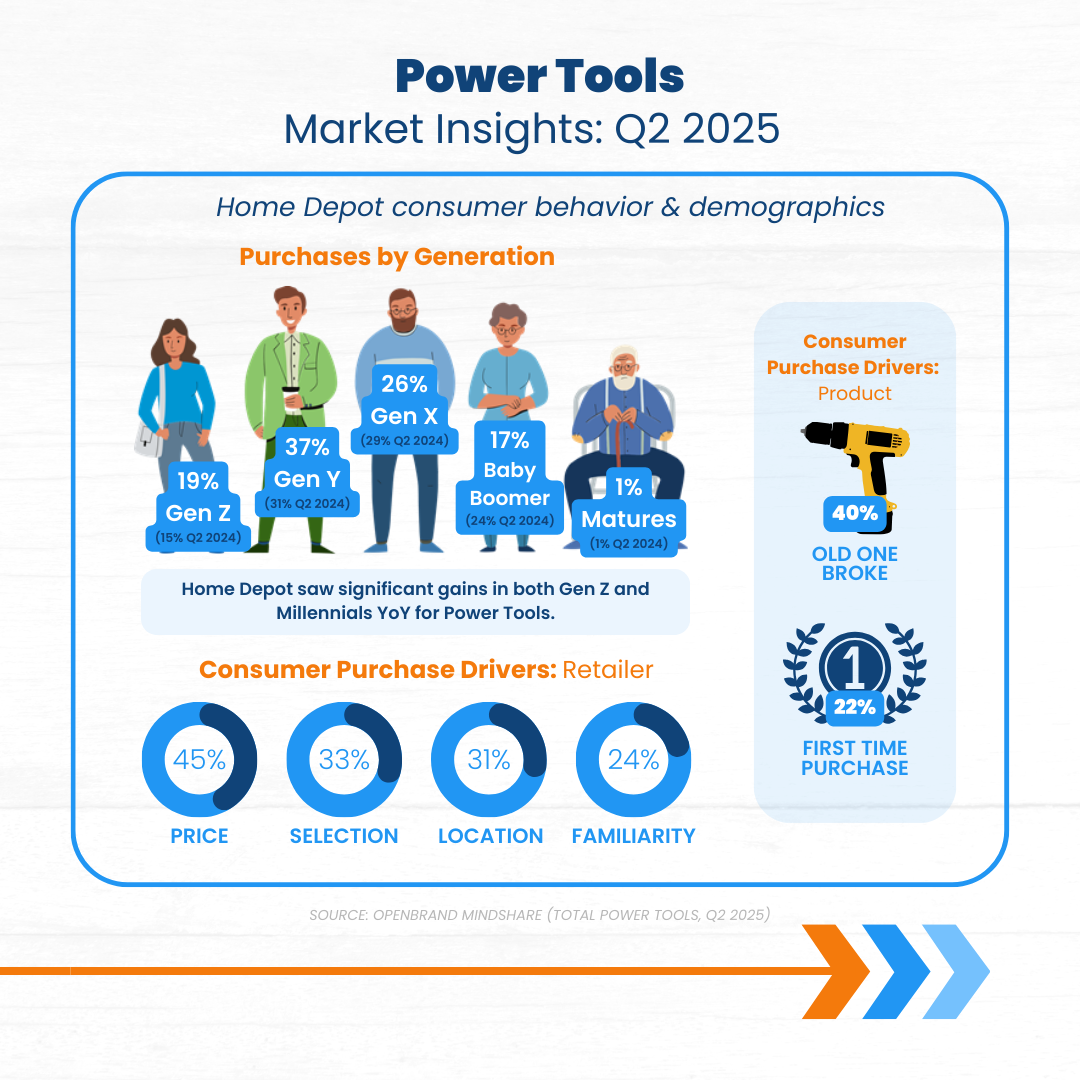
Home Depot Market Share: Power Tools Category
Power Tools Leadership Grows
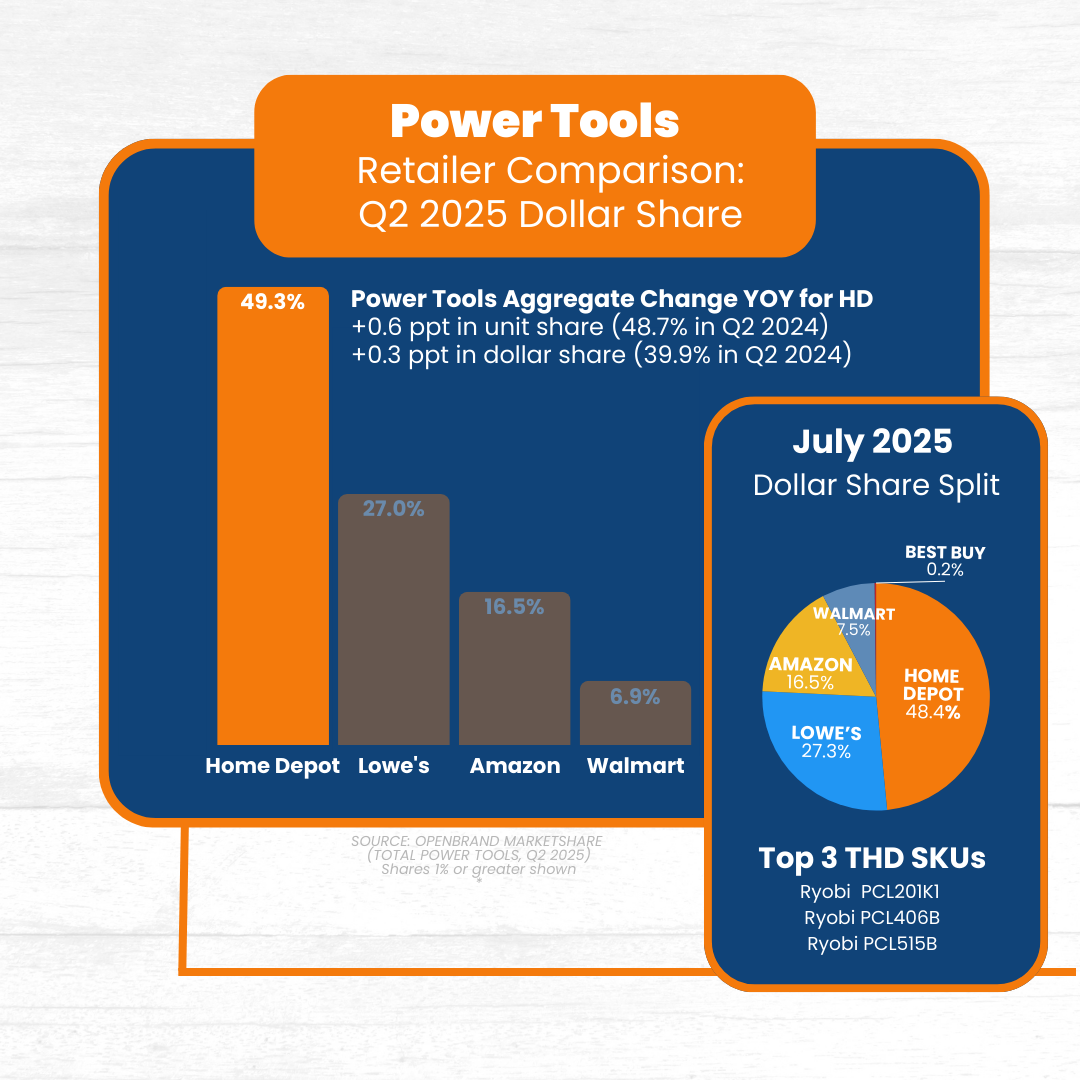
Home Depot maintained leadership in the power tools category in Q2 2025, winning a dominant 49.3% dollar share. Despite signs of pressure in Q1, Home Depot is clearly the share winner, with slight gains (0.3 ppt in dollars and 0.6 ppt in units) YOY.
Power Tools Retailers: Q2 2025 Market Share Split
- Home Depot: 49.3%
- Lowe’s: 27%
- Amazon: 16.5%
- Walmart: 6.9%
- Best Buy: >1%

Here are the product categories contributing to Home Depot’s power tools share.
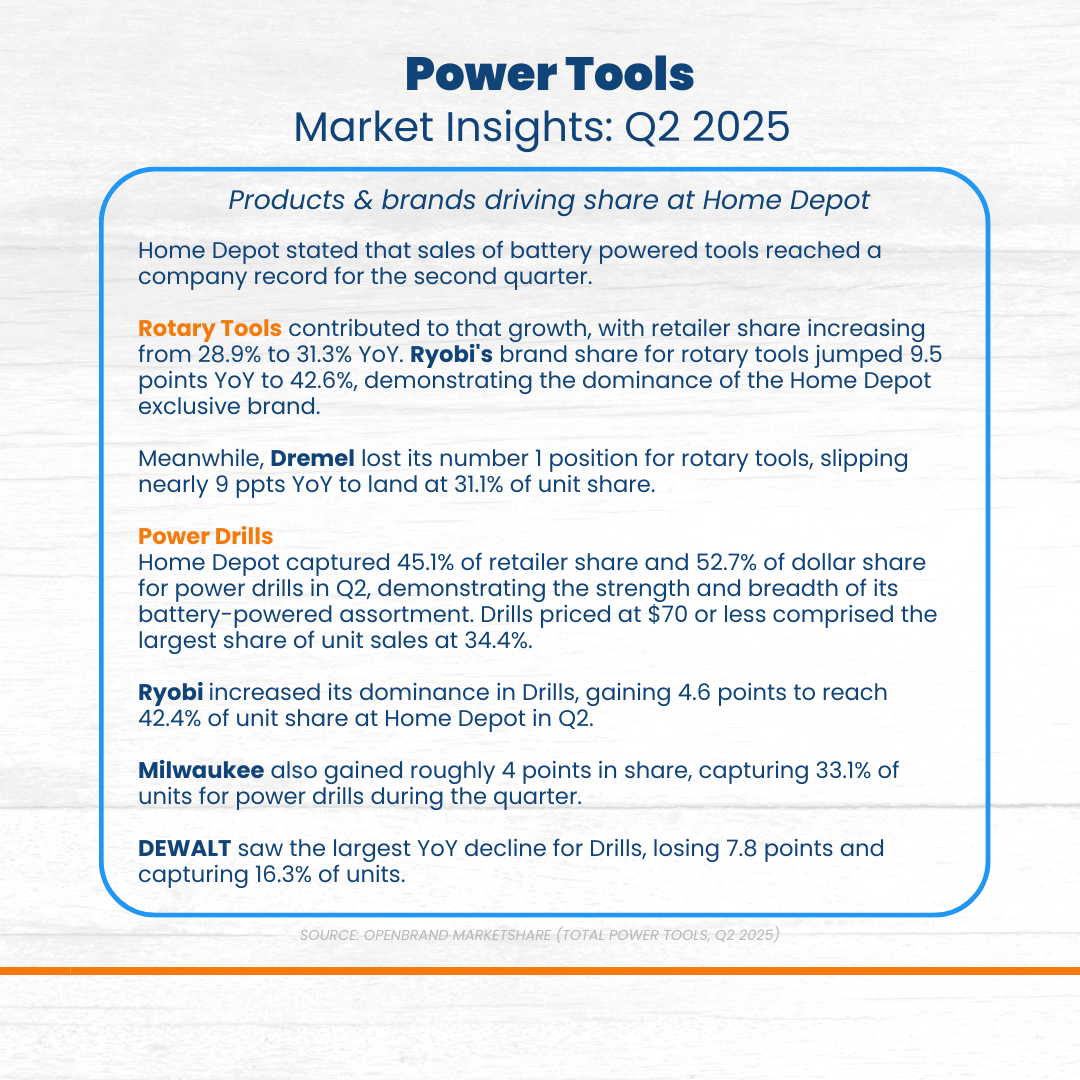
- Rotary Tools: Home Depot’s rotary-tools share grew from 28.9% to 31.3% YoY, buoyed by Ryobi’s strength.
- Power Drills: Home Depot dominated drills with 52.7% dollar share (45.1% unit share) in Q2’25.
Takeaway
Home Depot extended its leadership in Power Tools, setting a new record for battery-powered tool sales. Share gains in rotary tools and drills were fueled by Ryobi and Milwaukee, offsetting declines from DEWALT. Affordable drill pricing and exclusive brand strength reinforced Home Depot’s dominant position.
Where Brands & Retailers Should Focus Now
Home Depot’s earnings results reveal how consumer preferences and competitive dynamics are reshaping category performance – and how that performance can impact overall market share.
Here’s how these takeaways are applicable for competitive brands and retailers in the durables space:
- Private label and exclusivity matter
- Pay attention to performance at the category-level, success depends on product-level positioning as well as brand-level
- Targeted pricing is only effective when paired with demand
- Battery-powered products are winning in power tools and OPE
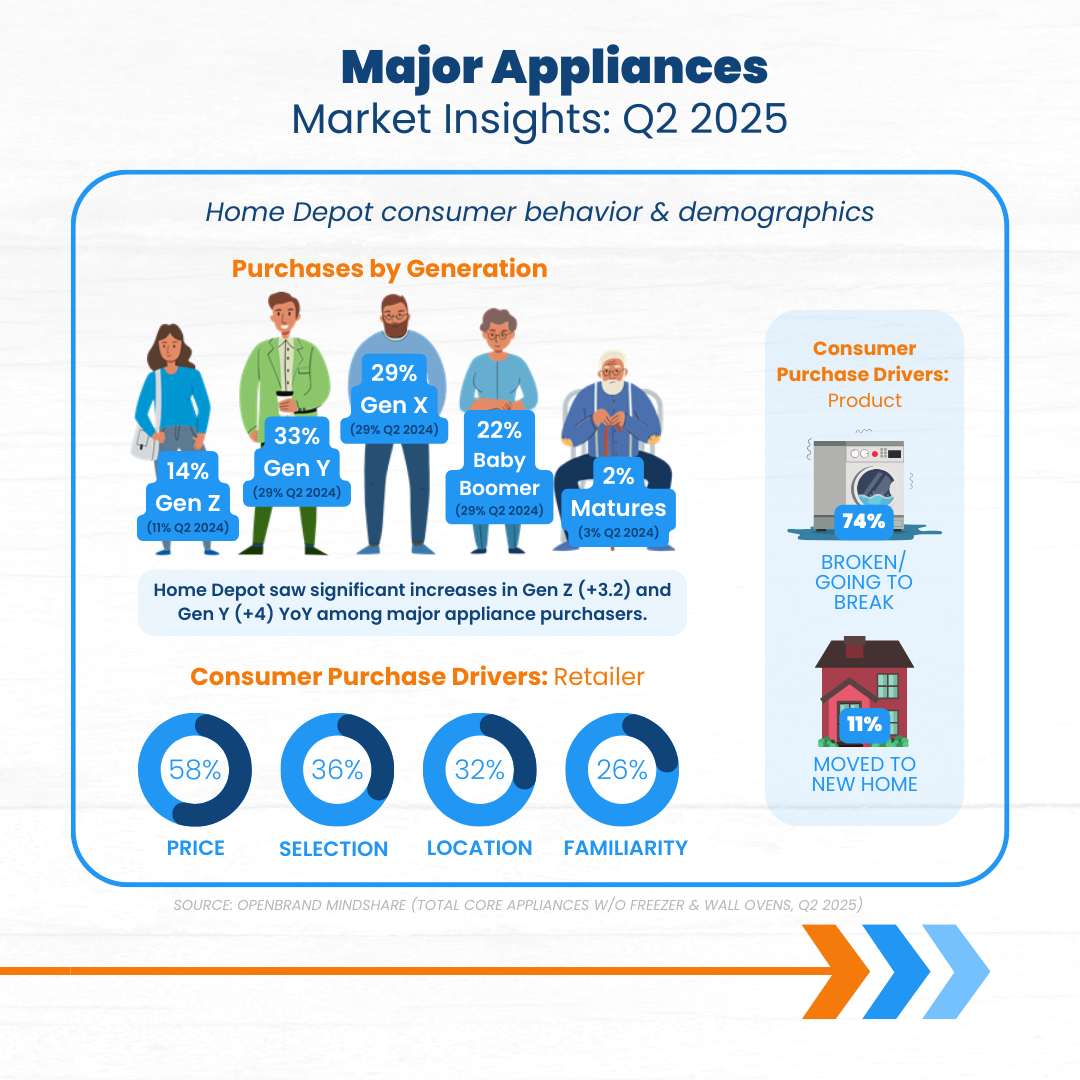
- Based on purchase driver data, consumers are driven by necessity, not aspiration as they replace rather than upgrade
- Know what to stock as well as when, where, and why it resonates with value-conscious consumers
Monitor Market Share Signals Beneath the Surface
Home Depot’s results showed solid topline growth and operational consistency, but the category-level story reveals more nuance.
If you’re looking to understand the nuances of your market, and get the data you need to effectively manage product mix, pricing, and inventory to grow market share, OpenBrand can help.
Request a custom review of the data available for your business to get started.