


Inside the Q4 2025 Lowe’s Earnings Call
Lowe’s closed 2025 with positive growth YoY in Q4, despite ongoing economic issues and uncertainty in consumer demand. Lowe’s found growth opportunities and share gains in key product categories impacting overall results as they focused on strong brand performance and pricing strategies.
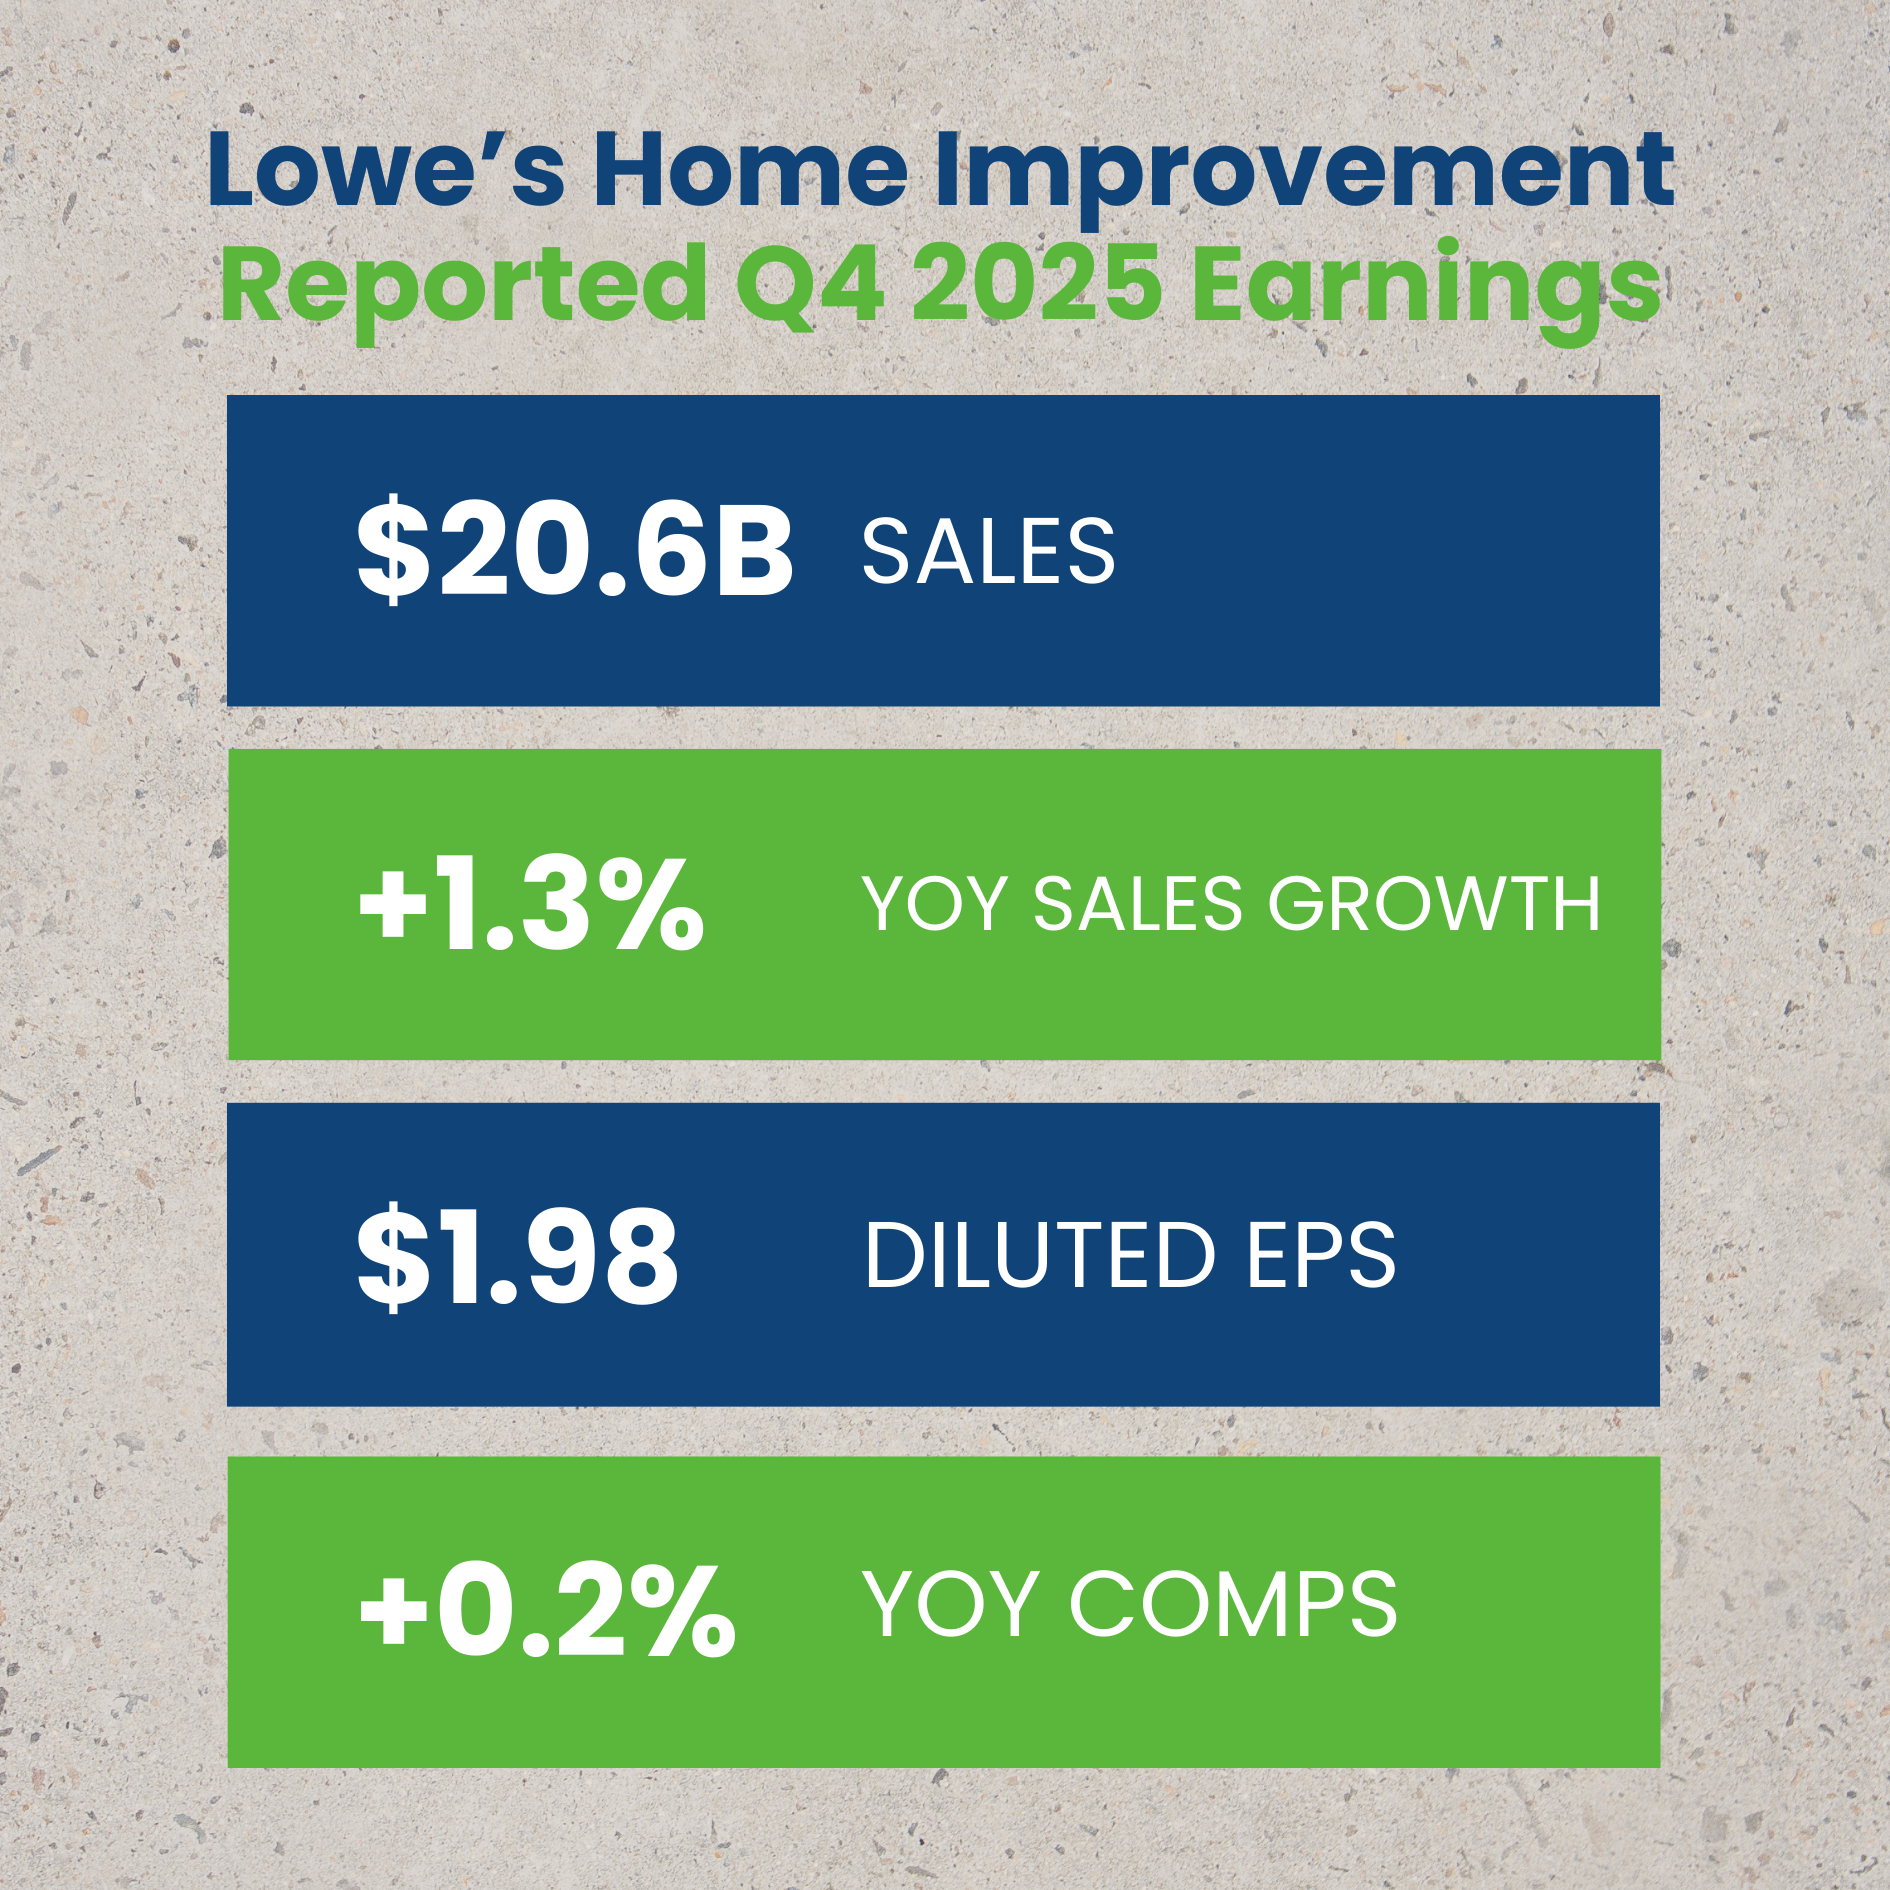
Key Q4 2025 Lowe’s Earnings Call Results
- Revenue: $20.6B
- YOY Sales Growth: +1.3%
- YOY Comps: +0.2
- Diluted EPS: $1.98
How did core durables categories shape Lowe’s performance?
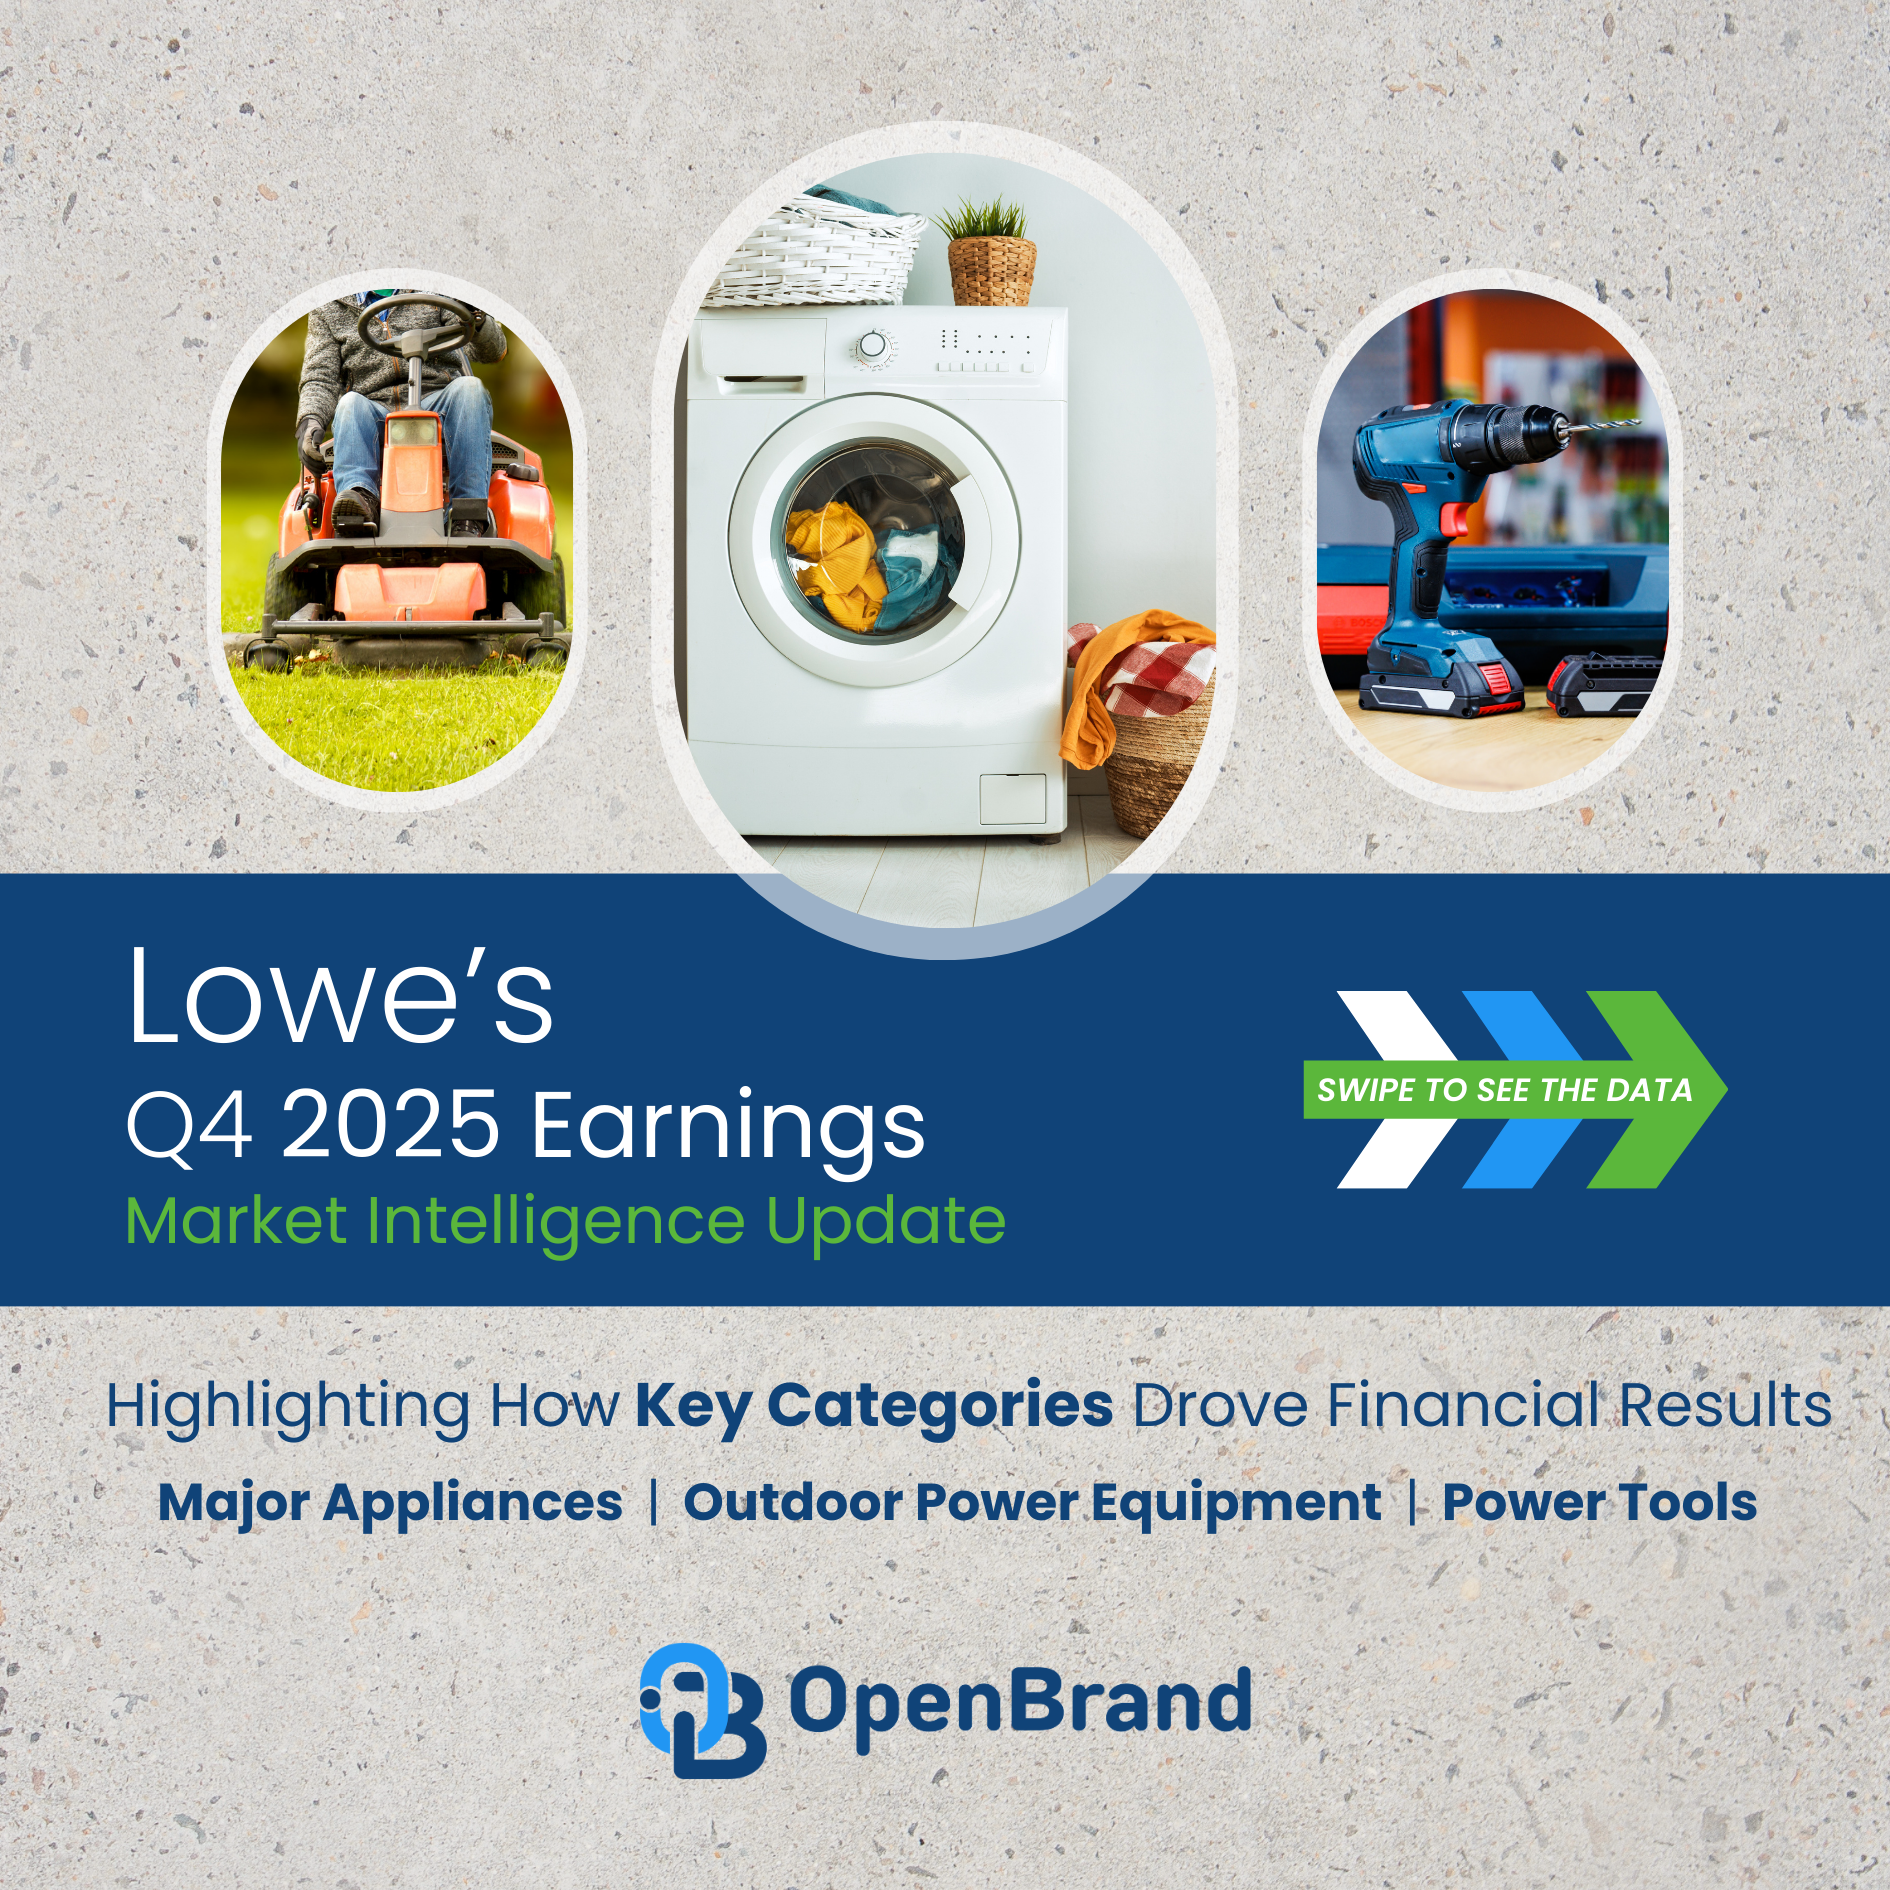
In this blog post, we break down Lowe’s market share in major appliances, outdoor power equipment, and power tools, highlighting which products and brands helped boost share, where challenges persisted, and how consumer demand is evolving across the home improvement space. Check out the full report now and read our analysis of the data below.
Lowe’s Earnings Call
Q4 2025 Performance & Lowe's Market Share Trends
SWIPE TO SEE FULL REPORT, CLICK TO EXPAND SLIDES


Lowe’s Earnings: Major Appliances Category Influence
Market Leadership Holds, despite declines for Q4 2025
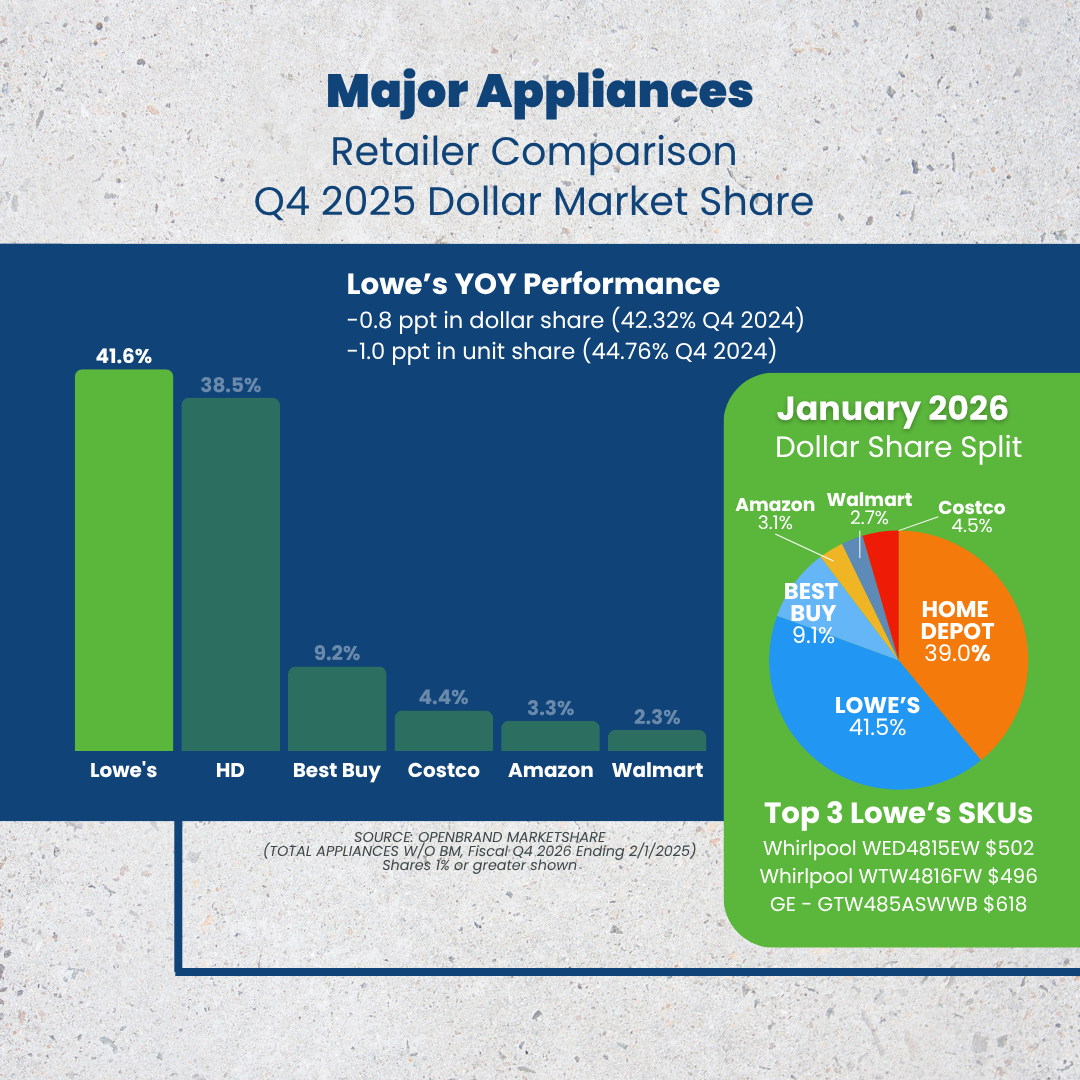
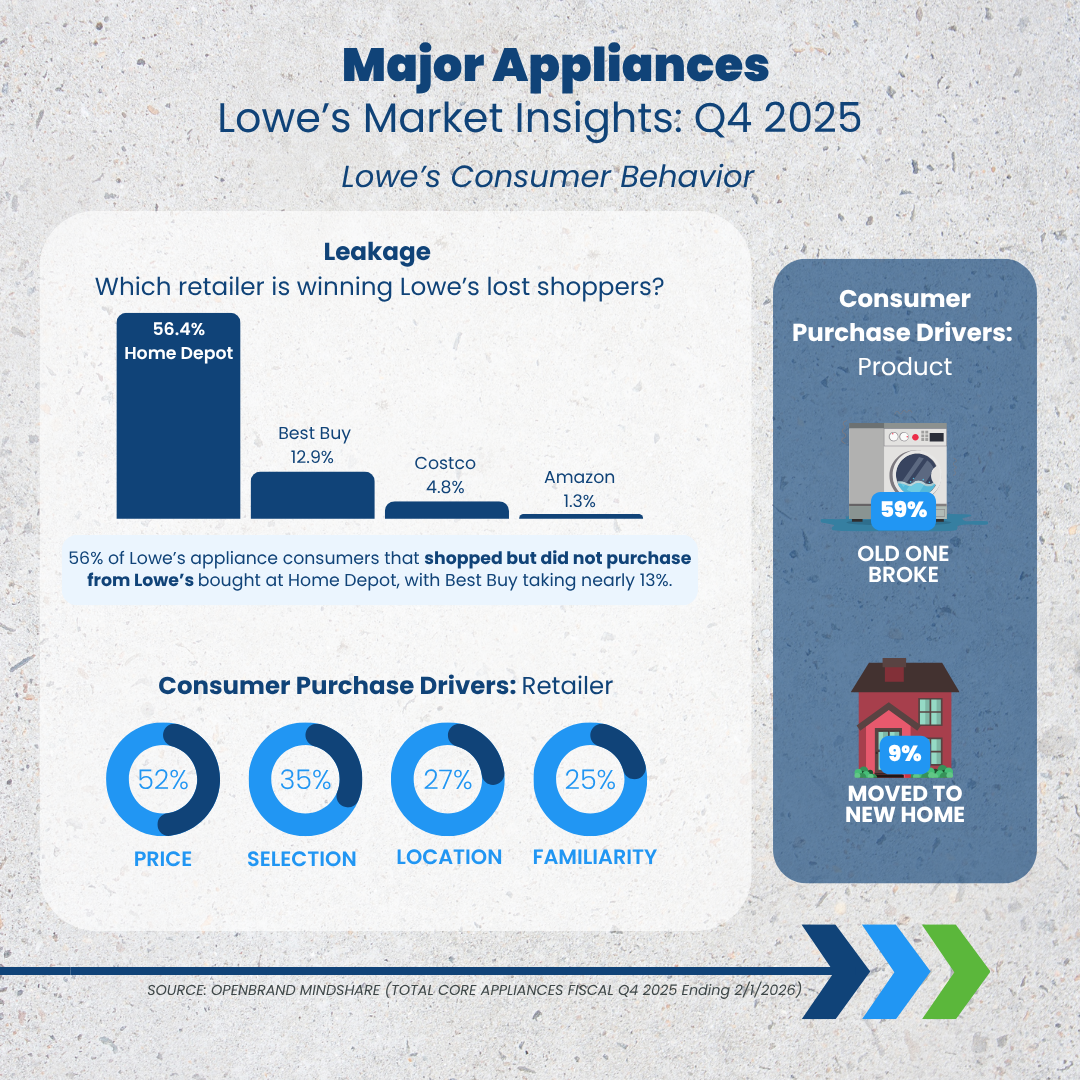
In Q4 2025, Lowe’s lost some traction in the major appliances category, decreasing dollar share slightly (-0.8 ppt) year-over-year (YOY), and unit share by -1.0 ppt. They remain market leader but Home Depot is gaining ground as they picked up +1.3 ppt of dollar share working to close the 3 ppt gap between these two appliance leaders. Leakage data also indicated 56% of Lowe’s appliances shoppers that shopped but did not purchase from Lowe’s bought at Home Depot.
Top Major Appliance Retailers: Q4 2025 Dollar Share Split
- Lowe’s: 41.6%
- Home Depot: 38.5%
- Best Buy: 9.2%
- Costco 4.4%
- Amazon: 3.3%
- Walmart: 3.0%
Here are the product categories that contributed to Lowe’s major appliance share in Q4.
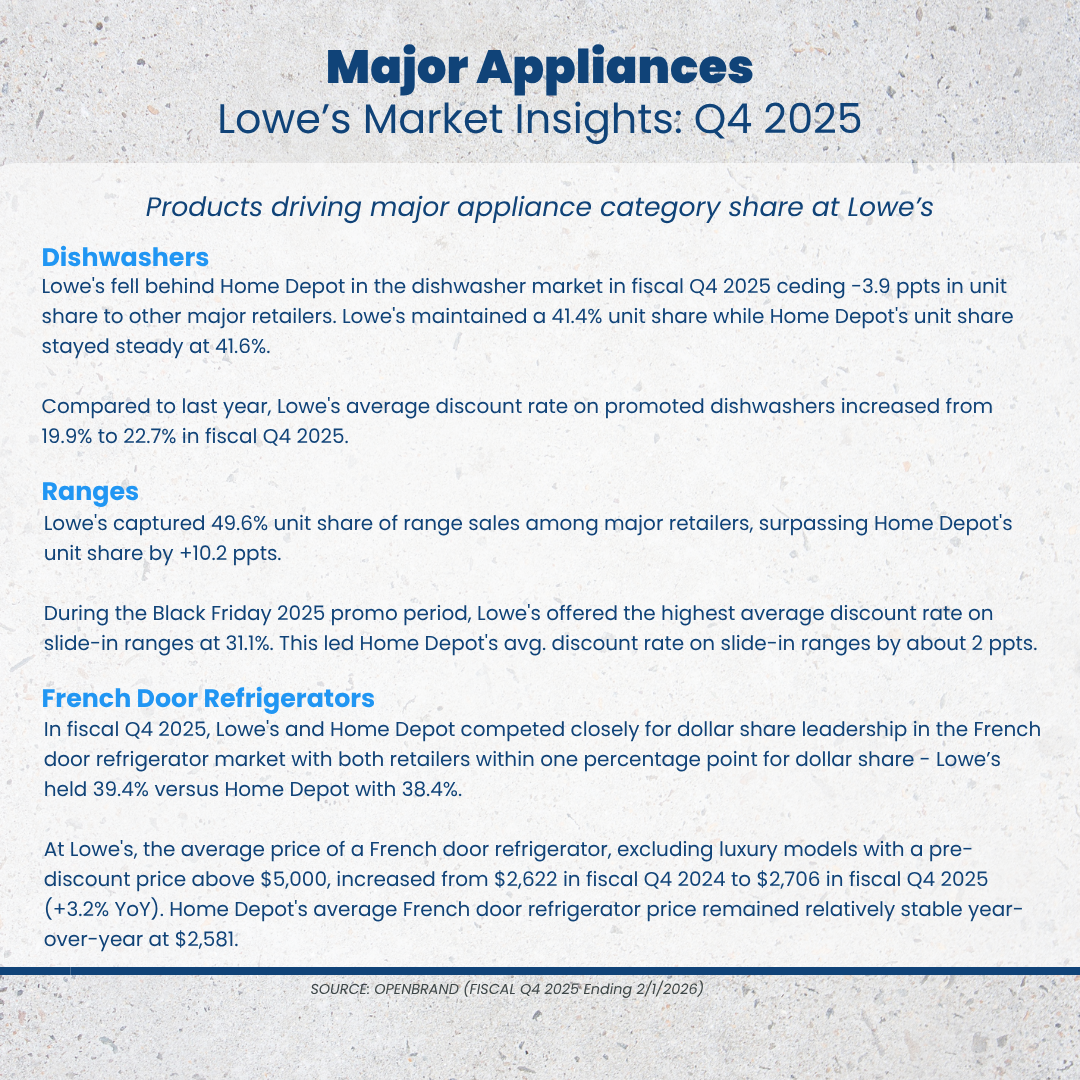
- Dishwashers: Lowe’s falls behind Home Depot in the dishwasher category for fiscal Q4 2025 losing nearly 4 ppts (-3.9 ppts) to other major retailers. Lowe’s held a 41.4% unit share while Home Depot was slightly ahead with 41.6%. Compared to last year, Lowe’s average discount rate on promoted dishwashers increased by 2.8 ppt with an average of 22.7%.
- Ranges: Lowe’s captured nearly half of the share with 49.6% unit share of ranges, surpassing Home Depot’s unit share by +10.2 ppts for the quarter. However, they did see a decline YoY for the quarter. During the Black Friday 2025 promo period, Lowe’s offered the highest average discount rate on slide-in ranges at 31.1%. This led Home Depot’s average discount by 2 ppts for slide-in ranges.
- French Door Refrigerators: In fiscal Q4 2025, Lowe’s and Home Depot competed closely for dollar share leadership in the French door refrigerator market holding a one point gap between them. Lowe’s still led as they gained by +0.9 ppt YoY with 39.4% dollar share while Home Depot had 38.4%.
- Pricing data reported Lowe’s average price of French door refrigerators (excluding luxury models with a pre-discount price above $5k) increased from $2,622 in fiscal Q4 2024 to $2,706 in fiscal Q4 2025 (+3.2% YoY). Home Depot’s average French door refrigerator price remained relatively stable year-over-year holding around $2,581.
OpenBrand’s Key Takeaway
While Lowe’s maintained its leadership in major appliances in Q4 (41.6% share), momentum is shifting as Home Depot continues to close the gap, gaining +1.3 pts and capturing 56% of shopper leakage. Performance across categories was mixed; strength in ranges and French door refrigerators helped defend share, but notable declines in dishwashers highlight emerging vulnerability. Increased promotional intensity, particularly in ranges, suggests Lowe’s is leaning on discounting to sustain volume, while rising price points in refrigerators indicate a push toward higher-value mix.
Lowe’s Earnings: Outdoor Power Equipment Category Influence
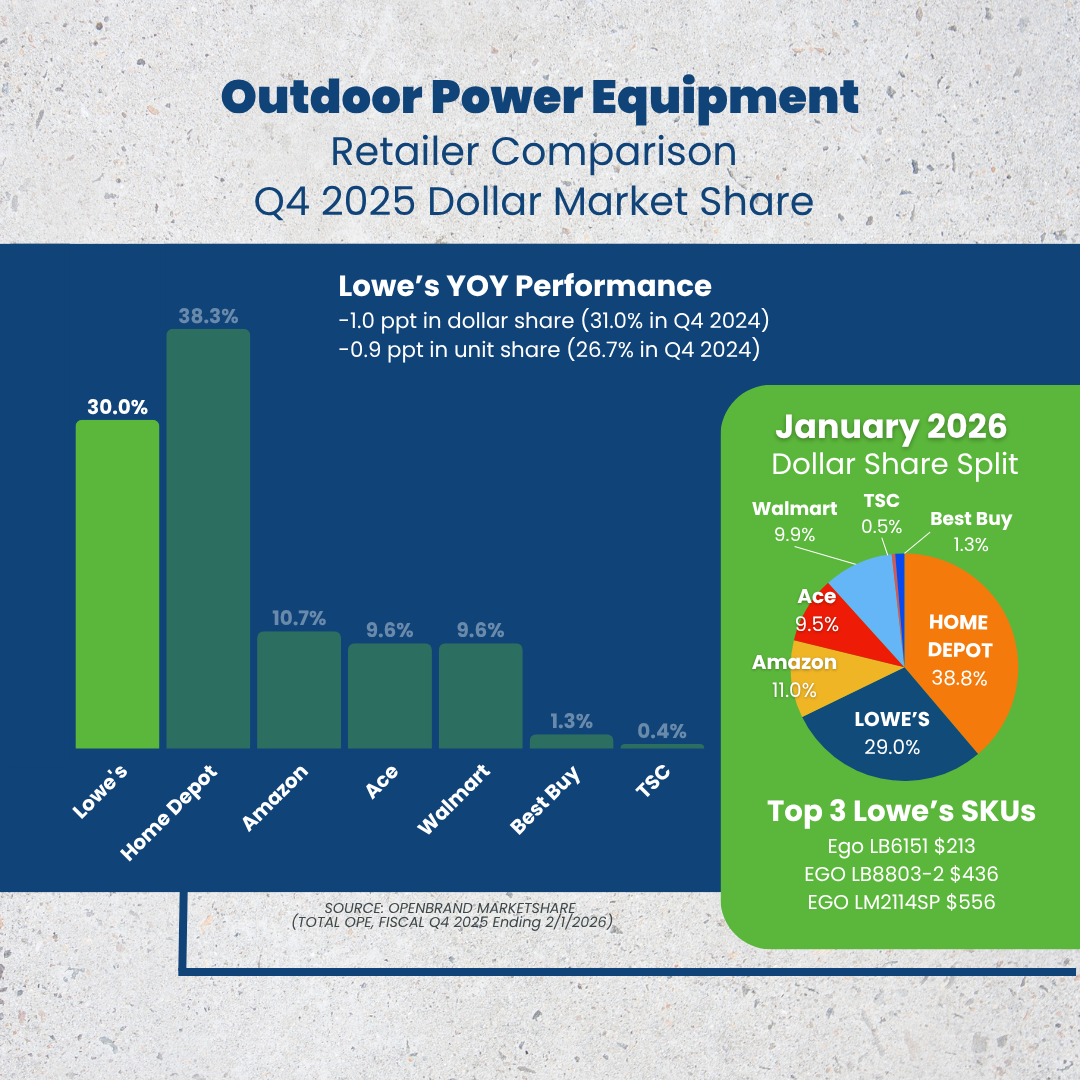
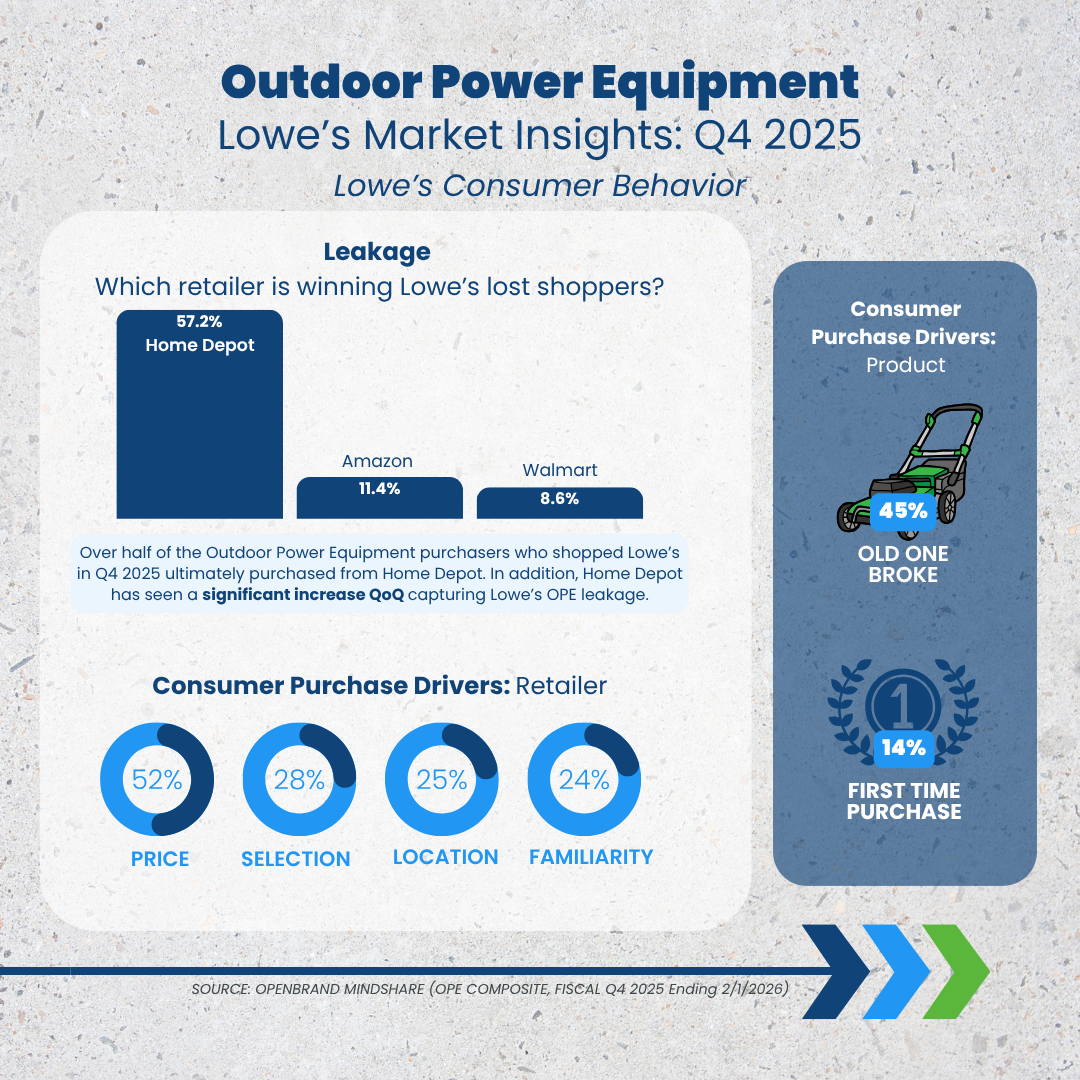
Lowe’s saw a slight decrease (-1.0 ppt) in dollar share for outdoor power equipment (OPE), closing fiscal Q4 2025 with 30.0% share. In addition, unit share declined slightly losing -0.9 ppt YoY. While Lowe’s saw a slight decline, Home Depot grew both unit and dollar share (+1.1 ppt & +3.0 ppt, respectively) and also captured Lowe’s OPE leakage QoQ with 57% of the OPE consumers who shopped Lowe’s but did not purchase at Lowe’s ultimately buying at Home Depot.
Top Outdoor Power Equipment Retailers: Q4 2025 Dollar Share Split
- Lowe’s: 30.0%
- Home Depot: 38.3%
- Amazon: 10.7%
- Ace: 9.6%
- Walmart 9.6%
- Best Buy: 1.3%
- TSC: 0.4%
Here are the brands and product categories contributing to Lowe’s outdoor power equipment share.
- In general Lower’s reported “strong holiday gift-giving” as well as storm-related demand as the key factors driving positive results for outdoor living results.
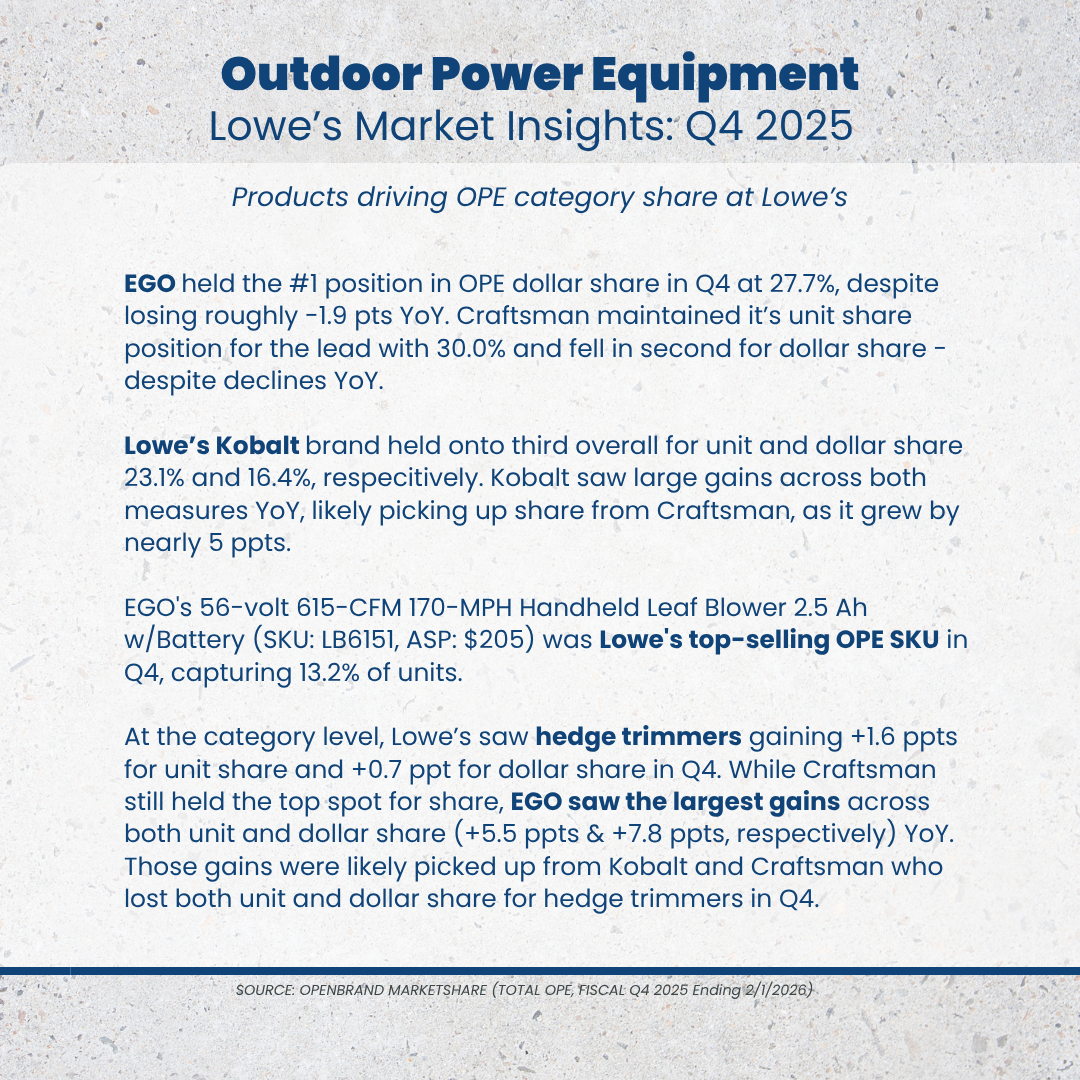
- EGO held the number one position in OPE at Lowe’s for fiscal Q4 2025 with 27.7% dollar share, despite losing -1.9 ppt YoY. Craftsman maintained its unit share position for top spot with 30.0% and holding in second place for dollar share despite declines across both YoY.
- Lowe’s Kobalt brand held the third spot overall for unit and dollar share, 23.1% and 16.4%, respectively. Kobalt saw large gains increasing nearly 5 ppt across both units and dollars in Q4 2024.
- Handhelds overall saw a slight decline for Lowe’s losing -0.5 ppt in dollar share. Craftsman holds the top spot for unit share at Lowe’s despite declines YoY. Ego holds tight to dollar share and grew nearly 4 ppts YoY. Kobalt saw positive gains (~4 ppt across unit and dollar share) for the product group owning second place in unit share and third for dollar share. Kobalt captured 36% of the $100-$149 price band as well as 47% share of the $150 to $199 price band.
- Hedge Trimmers performed well, gaining unit (+1.6 ppt) and dollar (+0.7 ppt) share in Q4 for Lowe’s – likely at the expense of Home Depot’s losses across both measures.
OpenBrand’s Key Takeaway
Lowe’s saw modest declines in OPE in Q4, while Home Depot gained share and captured 57% of leakage, reinforcing a growing conversion gap. Within Lowe’s, performance was mixed — EGO remains the dollar share leader despite declines, while Kobalt and select categories like hedge trimmers showed strength.
Lowe’s Earnings: Power Tools Category Influence
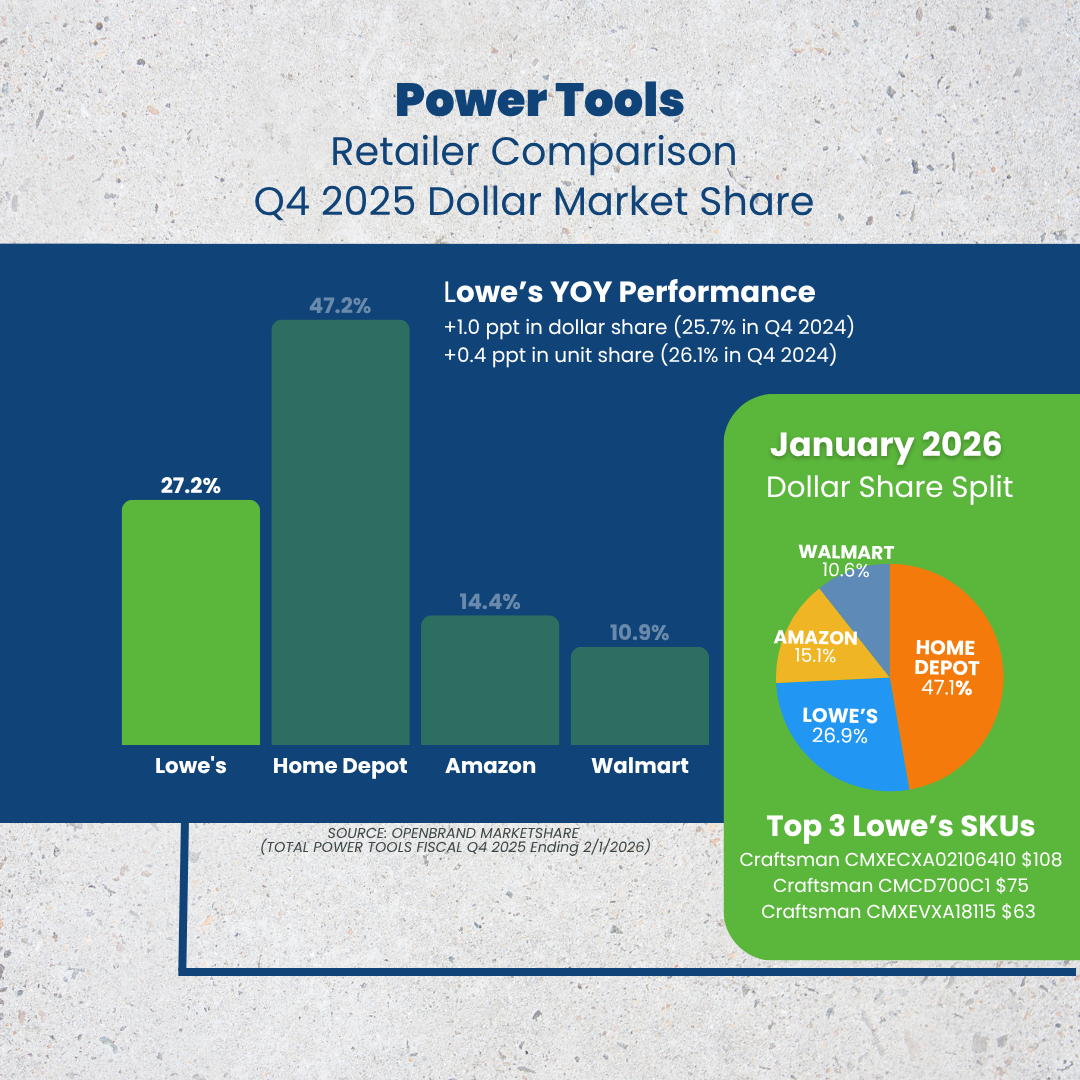
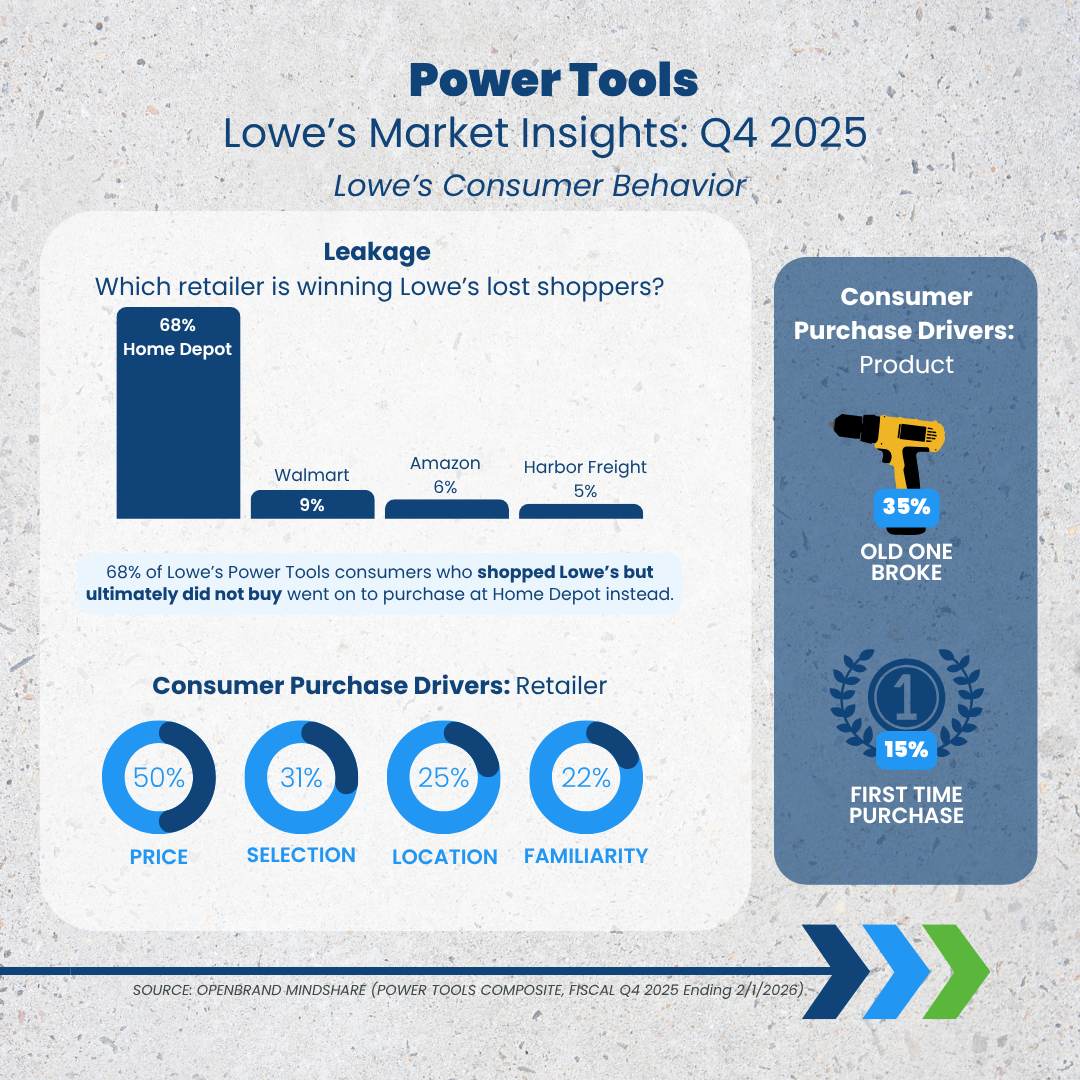
Q4 2025 saw positive gains for Lowe’s in the power tools category, with a +1.0 ppt increase in dollar share YOY and +0.4 ppt in unit share. Despite the positive results across power tools for Lowe’s, there continues to be a sizable gap (20 ppts) between Lowe’s and the market leader, Home Depot. In addtion, Home Depot saw a strong conversion of Lowe’s power tool shoppers who did not purchase at Lowe’s with 68% leakage to Home Depot.
Top Power Tools Retailers: Q4 2025 Dollar Share Split
- Home Depot: 47.2%
- Lowe’s: 27.2%
- Amazon: 14.4%
- Walmart: 10.9%
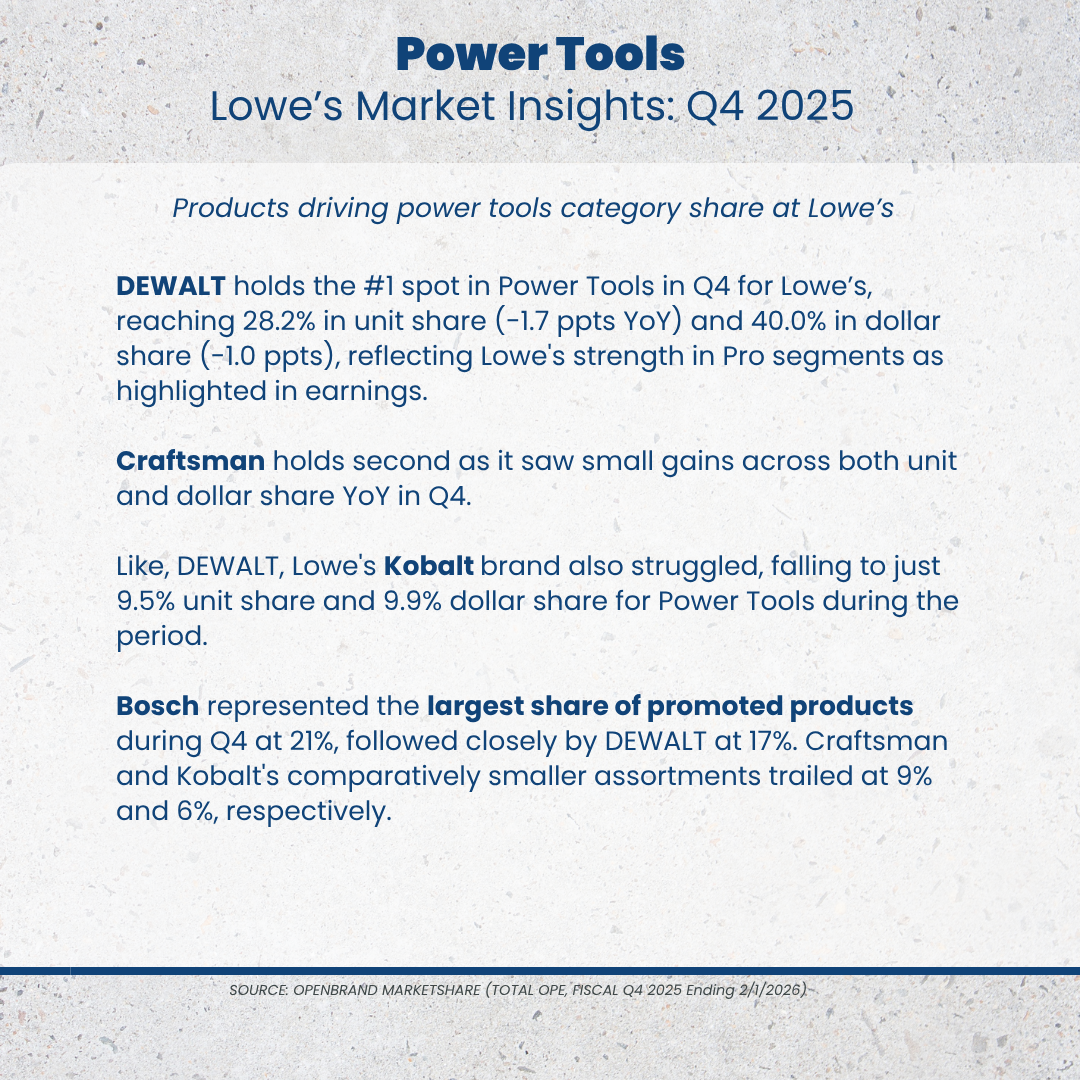
In Q4, Lowe’s saw positive comps in the tools division, also a result of consumers strong response to the holiday gift-giving assortments as well. Key brands playing a role in Lowe’s Q4 success include:
OpenBrand’s Key Takeaway
Lowe’s saw modest gains in power tools in Q4, but a 20-point gap to Home Depot remains — and more critically, Home Depot captured 68% of leakage, highlighting a significant conversion disadvantage. While brands like DEWALT continue to anchor the category and Craftsman shows momentum, private label (Kobalt) and overall execution lag. Promotional activity is also led by national brands, reinforcing their influence on shopper decisions.
Where Brands & Retailers Should Focus Now
Lowe’s Q4 2025 results highlight a critical shift across appliances, outdoor power equipment (OPE), and power tools: demand remains strong, but conversion is the defining battleground. OpenBrand’s real-time market intelligence reveals clear priorities for brands and retailers looking to win share.
Compete Aggressively on Price & Selection – the Top Drivers of Retail Choice
Across categories, price and product selection remain the primary factors influencing where consumers ultimately purchase. Even when shoppers begin their journey at Lowe’s, a significant share ultimately purchases elsewhere, most often at Home Depot underscoring the importance of competitive pricing and deep assortments to convert consideration into purchase.
Close the Conversion Gap to Capture Lost Demand
The most immediate opportunity is reducing shopper leakage. In Q4, 68% of power tool shoppers, 57% of OPE shoppers, and 56% of appliance shoppers who didn’t convert at Lowe’s purchased at Home Depot. Retailers must focus on in-stock availability, pricing precision, and in-store execution to convert demand already in their funnel.
Leverage Promotions Strategically — Not Just Tactically
Promotional intensity is playing a growing role in sustaining share, particularly in categories like appliances and power tools. However, leading brands are driving promotional effectiveness — suggesting retailers must be more targeted in how and where they discount to balance margin discipline with competitive positioning.
Align with Winning Brands to Drive Both Consideration & Conversion
National brands like DEWALT and EGO continue to outperform — leading in both consideration and conversion. Meanwhile, private label performance remains mixed. Retailers that better align with top-performing brands while strengthening their own offerings will be best positioned to capture both traffic and conversion.
Balance Value and Premium to Maximize Share
Category dynamics reinforce the importance of a balanced portfolio. Value brands drive unit volume, while premium, performance-driven products fuel dollar growth. Winning retailers will be those that effectively span both ends of the spectrum to meet evolving shopper expectations.
Reduce Shopper Leakage Through Stronger Conversion
OpenBrand consumer data shows a meaningful portion of Lowe’s shoppers ultimately purchase from competing retailers, particularly Home Depot. Improving conversion through sharper pricing, clearer value messaging, and stronger in-stock availability will be critical to capturing demand already entering the Lowe’s shopping funnel.
Monitor Market Share Signals Beneath the Surface
Lowe’s earnings in Q4 2025 reinforce that gaining market share is not just about carrying the right brands, but understanding exactly which products to promote, when to push value, and how to meet demand with precision.
If you’re looking to understand the nuances of your market, and get the data you need to effectively manage product mix, pricing, and inventory to grow market share, OpenBrand can help.
Contact us to get the conversation started.