

This is the January 2025 release of the OpenBrand Consumer Price Index (CPI) – Durable and Personal Goods report that covers price movements in December 2025.
DISCLAIMER: This report is provided ‘as is’ for informational purposes only. OpenBrand makes no representations or warranties regarding the accuracy, completeness, or reliability of the data. Users assume all risks associated with their use of this report. OpenBrand shall not be liable for any losses or damages arising from the use of this report.
2025 Ends Year with Uptick in Price Growth, Modest Outlook for 2026
In December, price growth for consumer durables and personal goods accelerated after a significant slowdown in November, with a month-over-month increase of +0.24%. This is up from a revised monthly +0.04% increase in the month prior. While the rate of price growth accelerated in four out of our five product groups, the Appliance group continued to show significant price deceleration in December, with prices in that group now falling in three out of the past four months.
Now that 2025 is behind us, we can now conduct an annual look-back on price trends across our five product groups over the past 12 months. This is especially important in light of the new presidential administration’s trade policies that began in the early part of the year. Overall, the OpenBrand CPI-DPG grew by 3.0% between January and December, with relatively smooth growth throughout the year. Just after the year’s halfway point passed in July, aggregate prices were up by just 1.6%. The Communications group followed a similar trajectory, with 2.1% of the annual 4.0% growth occurring in the first half of the year. Home Improvement also followed a similar trend, with 2.8% of the annual 6.3% occurring by July.
However, the trend was noticeably different in both the Appliances and Personal Care groups, where price growth peaked earlier in the year followed by a decline. Appliances reached a peak cumulative price growth rate of 2.0% by August, before falling to a cumulative rate of 1.2% in December. Personal Care followed a similar path, peaking at 1.5% in September before ending the year with a cumulative growth rate of 1.0% in December.
Table of Contents
- Key CPI Takeaways for December 2025 & Macroeconomic Outlook
- Product Group Highlights
- CPI 2025 Forecast: Macroeconomic Summary
- Methodology
December 2025 OpenBrand CPI-DPG Summary and Macroeconomic Outlook
Overall OpenBrand Consumer Price Index Movement: The OpenBrand CPI of Durable and Personal Goods recorded a +0.24% monthly change in December, notching the thirteenth consecutive month-over-month increase and 18th of the last 19th months. The sharp price growth this month occurred alongside a decent increase in the frequency of discounts, suggesting that the rise was partially driven by an increase in non-discounted list prices.
Discount Trends: December brought an increase in discount activity to the durables and personal goods sector, with frequencies climbing month-over-month to 23.5% of all durable and personal goods from 19.2% in the month prior. The typical magnitude increased slightly to 20.9%, up only slightly from 20.7% the month prior. All product groups except the Communications Group & the Recreation Group experienced the highest discount magnitude for 2025, while the Communications Group experienced the highest discount frequency for 2025.
Product Group Price Trends:
All product groups except the Appliance group experienced both an uptick in the rate of growth from the month prior & an increase in prices month-over-month. The group summary is as follows:
- Appliance Group (-0.75%)
- Communication Group (+0.76%)
- Home Improvement Group (+0.86%)
- Personal Care Group (+0.03%)
- Recreation Group (+0.31%)
See the full breakdown of product groupings.
Product Group Highlights
CPI: Appliances
Prices for appliances decreased on a month-over-month basis in December to -0.75%, falling from a revised +0.10% in the month prior. The negative price growth was at least partially driven by the typical discount magnitude increasing to 18.4% – the highest month this year- from 17.7%, while the frequency of discounts increased by almost 10 percentage points to 35.3% from 25.6% the month prior.
CPI: Communication
Prices of communication devices, including phones, tablets, computers, and printers, grew on a month-over-month basis to +0.76%, up slightly from a revised +0.06% the month prior. The frequency and magnitude of discounts were mixed in December. Frequency increased from 12.7% to 18.6%, while magnitude remained relatively flat, falling only in the slightest from 20.4% to 20.3% from November to December. The increase in prices of communication devices most likely was led by the significant increase in frequency of discounts, which rose this month by almost 6 percentage points compared to the month prior & boasts the highest frequency of discounts by quite a bit for 2025.
CPI: Home Improvement
Prices for home improvement goods increased by +0.86% on a month-over-month basis in December, growing from a revised +0.56% in the month prior, showing 33 consecutive month-over-month flat or monthly increases. The acceleration in price growth was at least partially driven by an increase in the magnitude of discounts (18.7% from 18.2% the month prior) – the highest for 2025, while the typical discount frequency remained flat at 10.2%.
CPI: Personal Care
Prices of personal care products grew on a monthly basis in December by +0.03%. Some of this increase may be due to an increase in both the magnitude (rising from 22.1% in November to 22.7% in December – recording the highest magnitude of discounts for 2025) & frequency of price discounts (rising from 22.9% in November to 23.4% in December).
CPI: Recreation
The rate of price growth of recreational products, including TVs, headphones, and speaker systems, increased to +0.31% on a month-over-month basis in December, up sharply from a revised -0.19% in November. Some of this increase in the pace of price growth is at least partially due to an increase in the frequency of discounts – up sharply to 29.7% in December from 24.8% in November – but a decrease in the average magnitude of discounts – down to 24.6% from 25.0% over the same time period.
Macroeconomic Outlook Update
As 2026 begins, U.S. consumers are likely to experience a welcome shift in the inflation story—one defined less by sticker shock and more by gradual stabilization. While prices are unlikely to fall broadly across the economy, the pace of price growth for durable and personal goods is expected to moderate meaningfully and, in some categories, edge modestly lower as lingering cost pressures from earlier trade policies and supply disruptions continue to unwind.
After several years of uneven inflation, the fundamentals for consumer goods pricing are improving. Supply chains are more normalized, inventories are healthier, and competitive pressures have returned in many retail categories. Importantly, the inflationary impulse from Trump-era tariffs—which raised costs on a wide range of imported consumer goods—has largely worked its way through the system. As contracts reset, sourcing adjusts, and global logistics remain relatively stable, the tariff pass-through that once pushed prices higher is fading into the background.
For consumers, this shift should be most noticeable in durable goods. Prices for big-ticket items such as appliances, furniture, electronics, and household equipment surged during and after the pandemic, only to cool sharply as demand softened and retailers worked through excess inventory. In 2026, those prices are expected to rise much more slowly than in prior years, and in some cases may drift lower in nominal terms as manufacturers and retailers compete more aggressively for value-conscious buyers. While prices are unlikely to return to pre-pandemic levels, the era of rapid increases in durable goods appears firmly behind us.
Personal goods—including clothing, footwear, household supplies, and everyday consumer items—are also poised for a more favorable pricing environment. These categories tend to be highly competitive and sensitive to changes in input costs. As tariff effects fade and global production stabilizes, retailers are increasingly able to limit price increases or offer promotions without sacrificing margins. For many households, this means fewer surprise price hikes and more predictable spending on everyday items.
The broader economic backdrop supports this moderation. Economic growth in 2026 is expected to remain steady but unspectacular, which helps limit demand-driven inflation. At the same time, the labor market is cooling gradually, easing wage pressures that often filter into consumer prices. While wages are still rising, they are doing so at a pace that is more consistent with long-run price stability rather than inflation acceleration.
Interest rates are also likely to play a role in shaping consumer prices. As inflation continues to cool, the Federal Reserve is expected to move cautiously toward a less restrictive policy stance. Lower borrowing costs would help households manage debt and support spending, but not at a level that would reignite runaway demand. This balance—moderate growth without overheating—creates a favorable environment for stable pricing.
For consumers, the practical takeaway in 2026 is not a return to deflation, but a return to normalcy. Price growth for durable and personal goods is expected to slow to modest levels and, in select categories, flatten or decline slightly. The intense inflation pressures of the early 2020s are giving way to a period where shopping decisions feel less urgent and budgets become easier to plan.
In short, 2026 looks to be a year of inflation relief rather than inflation reversal for U.S. consumers. As the residual effects of tariffs and supply disruptions fade, goods prices should become more stable, competitive, and predictable—offering households a long-awaited sense that the worst of goods-driven inflation is finally in the rearview mirror.
Note: This summary is based on data available as of early January 2025 and may be subject to revisions in future releases.
For questions about the report, please contact Ralph McLaughlin at ralph@openbrand.com
For press inquiries, please contact press@openbrand.com
About the OpenBrand CPI
This report offers insights into price trends across major consumer product categories representing a select mix of both durable and personal goods (see methodology below for more details). The data used in this report leverages OpenBrand’s industry-leading library of durable and personal goods pricing, promotion, and availability for over 1.4 million individual products. This is more than ten times the coverage by the monthly Bureau of Labor Statistics (BLS) Consumer Price Index, allowing more timely and granular reporting of price changes in the market.
This free monthly report provides a broad summary of price changes (including promotional activity), category-specific pricing and promotional trends, and macroeconomic context. For those seeking deeper insights, weekly CPI reporting and monthly CPI forecasts (released next week) are available on a subscription basis with up to same-day SKU-level pricing data available in bulk downloadable files.
Subscribe
Get CPI & Real-Time Pricing Data Updates
The OpenBrand CPI-DPG is released monthly. Join our subscription list to be notified when new CPI data is available.
OpenBrand Methodological Notes
The OpenBrand CPI of Durable and Personal Goods is constructed using a data-driven methodology that ensures accuracy, timeliness, and transparency in measuring price trends for both short and long-lasting consumer products. The methodology consists of the following key components:
- Data Collection
- Real-Time Price Tracking: Prices are sourced daily from online marketplaces, retail websites, and brick-and-mortar store listings.
- Retailer & Manufacturer Data: Aggregates pricing information from major retailers, direct-to-consumer brands, and wholesale suppliers into broader consumer categories.
- Temporal Coverage: Captures price variations over time, including daily discounts and price promotions
- Product Selection & Tracking
- Durable and Personal Goods Focus: The index includes products with an expected lifespan of three years or more, such as home appliances, consumer electronics, and tools, as well as personal care products with a shorter lifespan, such as hair and skin care products, vitamins, over-the-counter medications, and oral care products.
- Brand & Model Tracking: Individual brands and models are monitored to reflect pricing shifts within competitive product segments, including both permanent changes in listing price as well as temporary promotional pricing.
- Price Calculation, Adjustments, and Weighting
- Price Calculation: Tracks month-over-month and year-over-year price movements to measure price stability in the marketplace and take into account both longer-term changes in pricing (such as changes in manufacturer’s suggested retail price) as well as more short-term changes in pricing, such as promotional discounts and sales prices.
- SKU-Removal Instead of Hedonic Adjustments: When a product (or SKU) becomes unavailable in the BLS goods basket, the BLS implements a SKU-replacement procedure whereby the next most similar product is used in its place, and a quality (hedonic) adjustment procedure is performed to get closer to an apples-to-apples price comparison. Since OpenBrand has data on nearly 100% of the SKUs pricing history in a given product category, we can simply remove that SKU from the basket and rely on price changes of the remaining SKUs in that basket. This eliminates the need for hedonic adjustment in the OpenBrand CPI basket.
- Weighting and Aggregation Method: A weighted geometric mean formula is used to minimize volatility and improve stability in price trend analysis at both the product grouping and category level. Instead of using sales-volume weights when aggregating the index, we take an alternative approach by using persistence-based weights for aggregation. Instead of more frequently purchased items getting more weight in the BLS’ CPI calculation, OpenBrand takes a more novel approach by weighting items with a more established price history in the market more heavily in our CPI calculation than items with a less established history.
- Reporting & Updates
- High-Frequency Updates: Published freely on a monthly basis, with a subscription option for daily summaries across categories, sub-categories, and individual products.
- Comparative Benchmarks: We aggregate pricing as analogously as possible to traditional BLS CPI measures for benchmarking purposes.
- Transparency & Accessibility: Provides both open and paid data access for journalists, researchers, businesses, and policymakers.
By leveraging real-time data and advanced statistical techniques, the OpenBrand CPI offers an accurate and dynamic measure of pricing trends, helping businesses and consumers make informed decisions in an evolving economic landscape.
OpenBrand CPI – Durable and Personal Goods
Groups and Products
Appliance Group
Air Conditioners
Air Purifiers
Beverage Coolers
Blenders
Coffee Makers
Cooktops & Wall Ovens
Countertop Cooking
Countertop Microwaves
Dehumidifiers
Dishwashers
Dryers
Freezers
Icemakers
Laundry
Ranges
Refrigerators
Vacuums
Washers
OTR (Over-the Range Microwaves)
Communications Group
Business Printers
Desktops
Headsets
HED
Ink
Large Printers
MFP Copiers
Monitors
Notebooks
Personal & SOHO Printers
Projectors
Smartphones
Tablets & Detachables
Toner
Wearables
Wireless Routers
Recreation Group
Bluetooth Speakers
Bluray
Digital Camcorders
Digital Cameras
Headphones
Media Players
Photo Paper
Sewing Machines
Sound Bars
Speaker Systems
TVs
VAW Speakers
Home Improvement Group
Bathroom Faucets
Bathroom Sinks
Bathroom Vanity
Bathtubs
Cutting Machines
Carpets
Door Locks
Exterior Paints
Exterior Stains
Floor Tiles
Garden Hoses
Generators
Grass Seed
Handhelds
Hand Tools
Hardwood Flooring
Interior Paints
Interior Stains
Kitchen Cabinets
Kitchen Cleanup
Kitchen Faucets
Lawn Fertilizer
Lawn Products
Log Splitters
Mowers
Outdoor Cooking
Outdoor Cooking Accessories
Paint Supplies
Pesticides
Shower Stall and Enclosures
Power Tools
Power Tools Accessories
Pressure Washer
Replacement Batteries
Shower Doors
Shower Heads
Smart Doorbells
Smart Locks
Smart Cameras
Smart Thermostats
Snow Throwers
Spray Paint
Toilets
Vinyl Flooring
Water Filtration
Weed Killer
Personal Care Group
Anti-Smoking Products
Adult Incontinence
Baby Products
Bath Products
Contraceptives
Cosmetics (Eye, Facial, Nail)
Deodorants
Diabetic Products
Digestive (Lower GI, Upper GI, Hemorrhoidal)
Ear Care Products
Eye Care Products
Feminine Needs (Sanitary Napkins/Tampons & Women’s Care)
First Aid Accessories & Treatments
Foot Care Products
Fragrance
Hair Care (Coloring, Growth, Shampoo, Conditioner, Styling)
Hair Dryers
Home Health Care
Lip Preparations
Oral Care (Breath Fresheners, Accessories, Dentures, Mouthwash, Oral Hygiene, Toothpaste)
Pain (Analgesic, External & Internal)
Sexual Wellness
Shave (Non-Razor Blades, Creams, Razors)
Skin Care (Acne, Facial, Hand & Body)
Sleeping Remedies
Soap
Sun Care
Upper Respiratory (Cold/Allergy/Sinus Liquids & Tablets, Cough Drops/Lozenges, External, Nasal Products)
Vitamins, Minerals & Supplements
Wt Ctl/Nutrition (Tablets & Liquid, Powder Wipes, Towelettes)
PREPARED BY
Contact Us
For questions about the report, contact Ralph McLaughlin at ralph@openbrand.com
For press inquiries, contact press@openbrand.com
For full data access on a subscription basis, click the button below to request a demo of the offering.
Related blogs
Explore Our Data
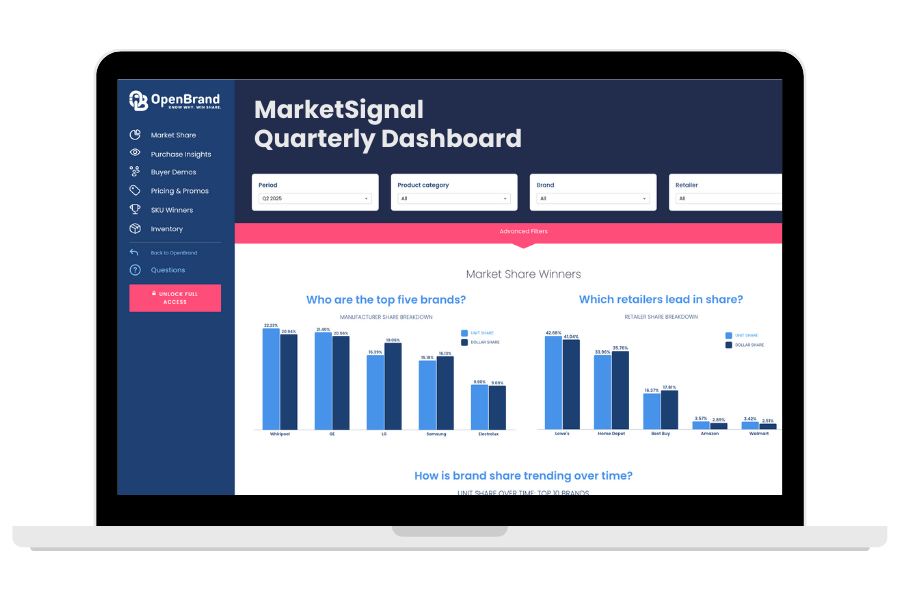
Free Quarterly Dashboards
Explore category-level data dashboards, built to help you track category leaders, pricing dynamics, and consumer demand – with no subscription or fee.
Related blogs

The State of Durables: How the 2026 Oil Shock is Shifting Economic Expectations
Insights from OpenBrand’s Q2 State of Durables Macroeconomic Update While the economic outlook for…

Consumer Price Index: Durable and Personal Goods | March 2026
This is the April 2026 release of the OpenBrand Consumer Price Index (CPI) – Durable Goods…

Retail Leakage: Who Is Winning Your Lost Shoppers and Why?
Retail leakage measures where shoppers go when they don’t choose you and which competitors win them…

Lowe’s Earnings: Market Share Breakdown | Q4 2025
Inside the Q4 2025 Lowe’s Earnings Call Lowe’s closed 2025 with positive growth YoY in Q4, despite…