


Retail leakage measures where shoppers go when they don’t choose you and which competitors win them instead.
According to OpenBrand’s consumer durables market intelligence, leakage analysis reveals how demand shifts between brands and retailers, and whether losses are driven by a draw (consideration) gap or a close (conversion) gap.
For durables brands and retailers, this answers a critical question most teams still cannot quantify: Who is winning your lost shoppers and why?
Share. Pricing. Promotions. Assortment. Placement. You know what you are doing. You may even know what your competitors are doing. (If not? OpenBrand can show you!) However, without leakage analysis, you cannot see how shoppers respond or where that demand actually goes.
That gap between activity and outcome is where growth is won or lost – and it is exactly why OpenBrand’s leakage analysis changes the game.
DOWNLOAD OUR BRAND AND RETAILER LEAKAGE REPORTS

Key Takeaways: Leakage in Consumer Durables
- Retail leakage shows where shoppers go when they don’t choose you and which competitors win them
- According to OpenBrand data, performance gaps often come down to draw (consideration) vs. close (conversion)
- Leakage reveals which competitors are consistently capturing your lost demand
- In many categories, a small number of competitors capture the majority of leakage (e.g., 50–60% in power tools)
- The biggest risk is not losing shoppers — it is misdiagnosing where they went and focusing on the wrong competitors
What Is Retail Leakage and Why Does It Matter for Consumer Durables Brands?
At its core, leakage is the measurement of lost shoppers and where they end up instead.
It answers three fundamental questions:
- Who is losing shoppers?
- Who is winning them?
- What needs to change to win them back?
Unlike traditional performance metrics, leakage goes beyond lost sales to reveal who wins lost shoppers and provides a target for where to focus next.
For durables categories like appliances, power tools, and home improvement, where purchase cycles are longer and decisions are higher-consideration, this visibility is critical.
When a shopper leaves, they are not disappearing. They are choosing someone else.
Why Traditional Metrics Miss the Most Important Question in Retail
Most organizations rely heavily on 4Ps data (price, promotion, product, placement) for competitive targeting. This data tells you what actions were taken by your competition and how your strategy compares. It does not tell you how shoppers responded.
For example:
- You may be priced competitively
- You may carry the right brands
- You may have strong distribution
And still lose the sale.
Leakage fills that gap by connecting your strategy to actual shopper outcomes, revealing whether your actions influenced draw or close – and which competitors benefited when they didn’t.
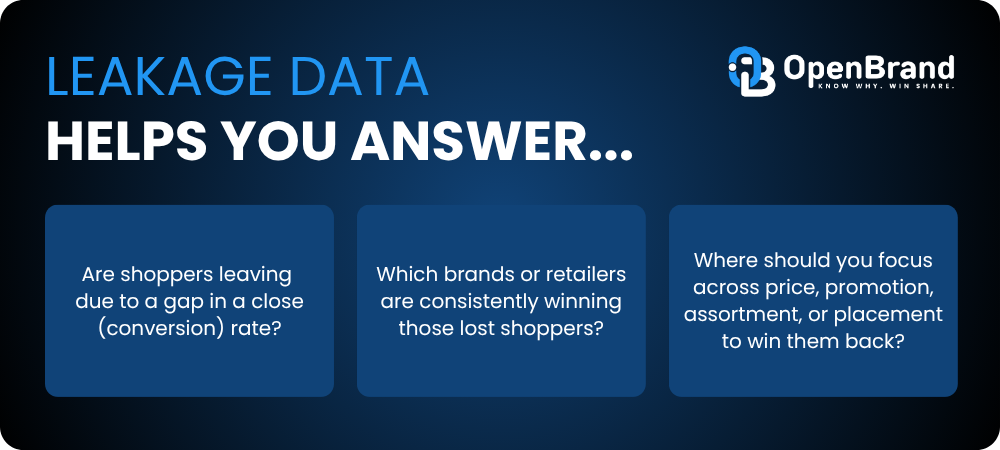
It helps answer critical questions like:
- Are shoppers leaving due to a draw (consideration) gap or a close (conversion) gap?
- Which brands or retailers are consistently winning those lost shoppers?
- Where should you focus across price, promotion, assortment, or placement to win them back?
OpenBrand’s data shows brands like Frigidaire with very low consideration (~6%) but high conversion (~64%), illustrating how strong close rates alone cannot drive share without sufficient draw.
Leakage takes this one step further, showing you where the competition is winning your lost traffic.
How Draw and Close Work Across Brands and Retailers
Draw and close apply across both brands and retailers, but they show up differently.
Leakage connects both sides of this equation. It makes it possible to see not just where breakdowns occur, but whether they originate at the brand level, the retailer level, or both.
Brand Leakage
- Draw = consideration
- Close = how effectively demand converts across retailers
How Does Retail Leakage Help Brands Identify Who Is Taking Their Customers?
For manufacturers, leakage answers a critical question:
Which competitor brands are taking your customers and why?
This unlocks several high-impact opportunities:
- Identify conquest targets
- Diagnose gaps between awareness and conversion
- Align marketing spend to actual shopper behavior
- Strengthen retail partnerships with shared insights
Instead of guessing where brand share is shifting, brands can quantify it and act on it.
Real-World Example: Brand Leakage in Appliances
According to OpenBrand’s consumer insights data, GE converts major appliance shoppers at a significantly higher rate than LG or Samsung (64% vs. 58% and 56%), but draws fewer shoppers overall.

This reveals a very different growth story:
- Conversion is strong (close is not the issue)
- Growth depends on increasing draw (consideration)
Leakage also shows how competitors capture lost demand:
- Samsung converts a large share of LG’s lost shoppers
- GE’s lost shoppers are distributed across multiple competing brands
This allows brands to move beyond general awareness strategies and instead target specific competitive conquest opportunities.
Retailer Leakage
- Draw = traffic and shopper entry
- Close = in-store or online conversion
How Can Retailers Use Retail Leakage to Diagnose Lost Share?
For retailers, leakage becomes a diagnostic engine for growth.
It enables teams to:
- Pinpoint exactly where shoppers are lost
- Identify which competitors are benefiting
- Prioritize investments across pricing, promotions, and assortment
- Quantify the size of the opportunity
Most importantly, it answers a question every merchant and executive is asking: “We’re losing share. What do we fix?”
Leakage provides a clear, data-backed answer.
Real-World Example: Appliances and Retail Leakage
According to OpenBrand’s consumer insights data, Lowe’s converts major appliance shoppers at a significantly higher rate than Home Depot (66% vs. 59%). Leakage reveals the real opportunity:
- Lowe’s is converting well
- The constraint is shopper draw
In other words, the fastest path to growth is not fixing conversion. It is driving more qualified traffic.
At the same time, competitors like Best Buy are capturing shoppers leaving the home improvement channel, especially in premium segments.
That insight changes strategy entirely:
- It highlights cross-channel competition
- It reframes where share is actually being lost
- It points directly to where to invest next
Without leakage, those signals remain invisible.
From Insight to Action: Turning Leakage Into Growth
The real value of leakage is about visibility and prioritization. Brands and retailers that misdiagnose where shoppers are going or who is winning them often waste time and resources competing in the wrong places. Leakage brings clarity to both, ensuring teams focus on the competitors, levers, and opportunities actually driving share.
Leakage eliminates that risk by tying every lost sale back to:
- Draw
- Close
- And the competitor who won
That means every action can be precise:
- If draw is weak → increase visibility and demand
- If close is weak → improve conversion drivers
- If both are weak → rethink positioning
This is how teams move from reactive decisions to precision growth strategies.
Leakage Is Not Random. It’s Predictable.
One of the most powerful aspects of leakage is that it is not evenly distributed.
In many categories, a small number of competitors consistently capture the majority of lost shoppers.
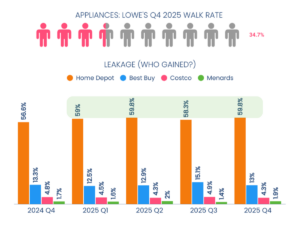
According to OpenBrand’s retailer leakage data, competitors like Home Depot consistently capture nearly 60% of Lowe’s lost appliance shoppers, reinforcing how leakage is concentrated among a small number of key players.
As another example, in power tools, leading brands like DEWALT capture as much as 50–60% of lost shoppers, creating highly concentrated share shifts.
This reframes competition around identifying and targeting the specific competitors consistently capturing your customers, so you can improve performance where it actually drives share.
The Bottom Line
You already know what you and your competitors are doing. Leakage shows how those actions translate into shopper decisions and which competitors benefit when they don’t.
In an environment where margins are tight and competition is intensifying across channels, that level of clarity is a competitive advantage. Growth comes from knowing exactly where you are losing, who is winning, and what to fix to win those shoppers back.
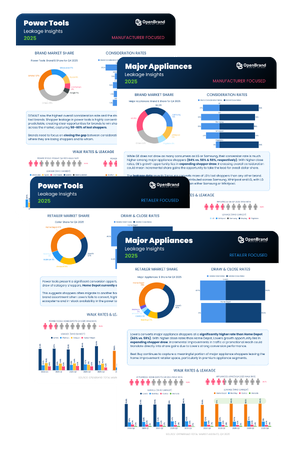
Free Leakage Reports
Want to see real draw, close, and leakage data?
In these reports, you’ll see a real world example of:
- Where shoppers are leaving?
- Who is capturing them
- Whether opportunity is increasing consideration or improving conversion
Available for download now:
- Retailer Leakage Report → See where traffic and conversion are breaking down across retailers
- Brand Leakage Report → Understand which competitors are winning your customers and why
Key Definitions in Leakage Analysis
| Term | Definition |
| Leakage | The measurement of where shoppers go when they don’t choose you and which competitors win them instead |
| Draw Rate (Consideration) | The percentage of shoppers who choose to consider your brand or retail channel |
| Close Rate (Conversion) | The percentage of shoppers who convert after considering you |
| Share Shift | The movement of demand from one brand or retailer to another |
| Leakage Concentration | The degree to which lost shoppers are captured by a small set of competitors |
FAQ
What is retail leakage analysis?
OpenBrand’s retail leakage analysis measures where your shoppers go when they don’t purchase from you. It identifies which competitors are winning your lost customers — and whether the breakdown is happening at the consideration stage (draw) or the conversion stage (close).
How do brands measure where lost shoppers go?
Brands measure lost shoppers through consumer survey data that tracks the full purchase journey — including which brands and retailers were considered, where shoppers ultimately bought, and why they switched. OpenBrand’s leakage analysis combines this survey data with market share and pricing intelligence to quantify exactly which competitors are capturing lost demand.
What is the difference between draw and close rate?
Draw measures whether shoppers choose to consider you — it’s a traffic and awareness metric. Close rate measures whether you convert shoppers who do consider you. A brand or retailer can have a strong close rate but still lose share if their draw is low, and vice versa. Leakage analysis separates the two so teams can diagnose the right problem and invest in the right solution.
Why is leakage analysis important for consumer durables brands?
In consumer durables — appliances, power tools, outdoor equipment — purchase decisions are high-consideration and infrequent. When a shopper leaves, they may not return for years. Leakage analysis identifies which competitors are capturing those shoppers and whether the loss stems from awareness, consideration, or conversion gaps, so brands can act before share erodes further.
Which competitors are most likely to capture my lost shoppers?
Leakage is rarely evenly distributed. In most durables categories, a small number of competitors capture the majority of lost shoppers. For example, in power tools, leading brands like DEWALT capture as much as 50–60% of lost shoppers. Leakage analysis identifies your highest-concentration competitors so you can prioritize conquest efforts where they actually move share.
How does leakage analysis differ from market share data?
Leakage analysis and market share data are not meant to be used as alternatives to one another. They work together to provide a more complete view of performance.
Market share shows how performance is shifting across brands and retailers. It tells you who gained and who lost over a given period.
Leakage analysis complements that by revealing where share actually went, which competitors captured it, and what drove those shifts in shopper behavior. Instead of just seeing you lost share, you can understand whether the issue is a draw (consideration) gap or a close (conversion) gap, and which specific competitors are consistently winning your lost shoppers.
Together, they connect performance to action:
- Market share shows what changed
- Leakage shows where it went and how to win it back
That combination allows teams to move beyond reporting and into prioritized, competitive strategy, focusing on the right competitors and the right levers across price, promotion, assortment, and placement.
Want to see what leakage and share insights look like for your brand or category? Connect with OpenBrand to uncover where your shoppers are going, who is winning them, and where to focus to take that share back.
Can retailers use leakage analysis the same way brands do?
Yes, but the application differs. For retailers, leakage identifies where shoppers are entering and exiting the purchase funnel — and which competing retailers or channels are capturing them. For example, OpenBrand’s data shows that while Lowe’s converts major appliance shoppers at a higher rate than Home Depot (66% vs. 59%), its bigger opportunity is increasing shopper draw, not improving conversion. That’s a strategic insight traditional POS data alone can’t surface.