


How to Use Product Process Matrix to Boost Sales
At every phase of your business' operation, it is key to align the product mix with customer demand to optimize the production process and grow revenue. Matching the right production flow with your product mix is crucial for maximizing profitability.
The product process matrix and SKU-level data from your products and competitors can provide a significant competitive advantage.
What is a Product Process Matrix?
The product process matrix merges a product lifecycle with the process lifecycle.
The product lifecycle covers everything from introducing products to market, growth phases, maturity, decline, and retirement. The process lifecycle is about how goods are produced. Aligning these two lifecycles creates more efficient production.
The product process matrix is vital for product management to make better decisions. By educating teams and stakeholders, you can help identify areas for improvement and your company’s competence to stay ahead of your competitors.
The Benefits of the Product Process Matrix
Using the product matrix produces several key benefits, including:
- Broader organizational processes. Companies can identify capabilities spanning across products and processes.
- Alignment between departments like marketing, operations, and sales. All groups can visualize how products align with the production process.
- Industry trend forecasting. Companies can anticipate challenges and respond strategically.
- New business opportunities. Insights from the matrix can uncover areas primed for growth.
The 4 Stages of the Product Process Matrix
The product process matrix helps to define the way goods are produced. Production generally falls into one of four quadrants.
| Low Volume Unique Products |
Low Volume Multiple Products |
High Volume Standardized |
Highest Volume Commodities |
|
| Jumbled Flow | JOB SHOP | |||
| Disconnected Flow | BATCH | |||
| Connected Flow | ASSEMBLY LINE | |||
| Continuous Flow | CONTINUOUS |
Job Shop
Focuses on short-term, customized work with a low volume of unique products.
Batch
Improves productivity and economies of scale, producing multiple products in low volumes.
Assembly Line
Streamlines production with fewer products in higher volumes for standardized products.
Continuous Flow
Achieves process innovations and high volumes, usually for commodity-based products.
The most efficient organizations align processes depending on where they fall within the matrix. This creates optimal efficiency. If companies need to move from one category to another for competitive reasons, it likely requires redesigning workflow and strategy.
How to Predict & Improve Sales with the Product Process Matrix
The product process matrix is a powerful tool for predicting sales trends and identifying areas for improvement that can impact profitability. Here are the ways using a product process matrix can directly impact your sales.
Discover Production Operation Efficiencies
The matrix clarifies an organization’s production options within its portfolio, helping companies understand their core competencies. Knowing whether their processes are optimized for customization, batch, standardized, or mass production helps align product mix.
Misalignments can hurt margins, so the product process matrix can highlight areas that need better alignment or retooling. Shifting products to best-fit production stages increases margins and leverages market opportunities more efficiently.
Each of the 4 product process matrix stages offer valuable insights. For example, job shop products may need more customization to increase value. Batch products have great potential for economy of scale.
Improve Resource Allocation
The product process matrix can help with resource allocation as well. By breaking down products into quadrants, companies can identify the most profitable products and those that are lagging.
Organizations can then invest in the rising stars, phase out aging products, and drop laggards. Such resource optimization helps grow revenue in line with customer demand.
Optimize Demand Forecasting
By mapping growth trends to the product process matrix, sales teams can also improve demand forecasting and overall profitability, highlighting areas where additional resources can grow sales. Operations teams can better plan productivity in different stages to ensure adequate supply for demand.
Gain Competitive Advantages
Comparing competitive information at the model level can also produce insights into opportunities and threats.
For example, an organization might segment current product offerings using the product process matrix and compare it to their competitor’s process flow to yield insights.
This might uncover that competitors have moved into assembly lines or continuous flows, revealing opportunities for products with more customization. Conversely, if competitors have kept product lines in lower volume batch production, there may be more opportunities to pursue higher volume for better economies of scale.
The product matrix provides valuable information for forecasting and implementing strategic improvements, boosting both the top and bottom lines.
Enhance Product Process Matrix Insights with SKU Metrix
When combined with a competitive SKU intelligence tool, the product process matrix presents an amplified opportunity to understand competitive movement, opportunities, and threats.
TraQline SKU Metrix can further assist in identifying industry trends based on the insights of the product process matrix. By analyzing product data across categories, you can see rising and falling SKUs with granular detail by product, brand, and retailer.
SKU Metrix’s product library provides insights for more than 30,000 SKUs for durable goods, including pricing intelligence for competitors updated weekly.
SKU Metrix delivers the competitive information you need to identify industry trends and stay on top of your competition. To learn more about SKU Metrix or the product process matrix, fill out the form below.

Tire Market: Top Brands & Retailers, Market Share, Retail Sales Data, & Trends in 2023
Over the past year, the automotive tire market has seen an upward growth trend. Which tire brands contributed most to this growth? Which outlets were responsible for the most sales? And what differing consumer preferences shaped that growth?
In this blog, we analyze which brands and retailers make up the U.S. tire market as well as key takeaways for the Canadian tire market (where noted). Read on to discover current consumer preferences regarding tire brands, top locations for tire purchases, and what factors most drive consumers when tire shopping.
For even more actionable insights on the tire market, download our complimentary infographic.
Source: All U.S. data in this article was pulled from the OpenBrand MindShare platform using the rolling 4Q ending Q2 2023, Tires: Total Auto/Truck per Tire category. Canadian data was pulled from MindShare Canada for the category, Tires: Total Auto/Truck per Tire. For the most recent insights or further dives into the data, please contact us.
What are the top tire retailers by market share?
U.S. Tire Market: Top Retailers
As of June 2023, the top tire retailer is Discount Tire, who leads the tire market in both unit share (14%) and dollar share (15%) — both significant leads.
Other market share insights for tire retailers include:
1. Following behind Discount Tire, the top tire retailers are (in order of share percent) Walmart, Costco, Firestone, and Goodyear. This order holds true for both units sold and dollar share YOY.
2. Firestone is the only major tire outlet to see a decrease in share YOY, down 0.7 points for dollar share and 0.5 points for unit share.
3. All other major tire outlets saw share increases for unit and dollar shares versus this time last year.
4. Notably Discount Tire, our leading retailer, saw the largest change in share compared to the prior year, enjoying increases of 0.6 points and 0.7 points, respectively.
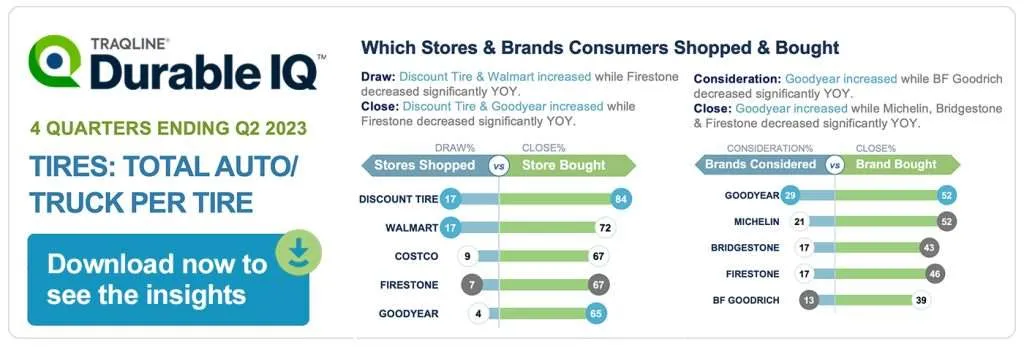
Tire Market: Outlet Draw-Close Rates
As the top two retailers for the tire market, Discount Tire and Walmart also continue to lead other major outlets for outlet draw rate (both with 17%) and close rate, at 84% and 72% respectively.
This means these retailers drew in 17% of tire shoppers, and of that 17%, they closed their respective percent (and therefore did not lose them to another retailer).
Notably, the 17% draw rate enjoyed by these retailers was a significant increase compared to the prior year, likely a contributing factor to their significant dollar gains.
Canadian Tire Market: Top Outlets
For the Canadian tire market, the top outlet is Canadian Tire in both unit and dollar share (21% share and 20% share, respectively).
The next closest outlet is Costco, which came in 8.0 percentage points behind Canadian Tire for unit share (13%) and 4.2 points behind for dollar share (15%).

Which brands lead in tire market share?
U.S. Tire Market: Top Brands
The leading tire brand is Goodyear, winning 15% of the market based on both units and dollars. Goodyear’s market-winning unit share is up significantly YOY, at a growth of 0.8 percentage points. (Want to know the brand’s dollar share? Get the infographic now!)
Other notable top tire brand insights include:
1. Goodyear dollar share saw only a minor gain of 0.2 points versus last year.
2. After Goodyear, the top tire brands in order by dollar market share are Michelin, Bridgestone, Firestone, and BF Goodrich.
3. The order of the top tire brands is similar for unit share, with one exception: Firestone has slightly higher unit share than Bridgestone, putting the brand in third place for units sold.
4. Goodyear is the only top tire brand to gain unit share increase YOY; no brands saw significant increase in dollar share YOY.
[Download the infographic to see the share percentage breakdown by tire brand.]
Brand Consideration Rates
As the top two brands, Goodyear and Michelin lead for brand consideration with 29% and 21% respectively.
Goodyear and Michelin also lead for close rate (both are 52%), however Goodyear’s close rate increased 2.1 points and Michelin’s decreased 1.3 points YOY.
Canadian Tire Market: Top Brand
The best-selling tire brand in Canada is Michelin, winning 17% of the market in units sold and 19% for dollar share.
What is the average price paid in the U.S. tire market?
As of June 2023, the industry average price paid (APP) for tires was $220, which is similar to the $197 average price during the same period in the prior year.
However, the average amount spent at different outlets and by brand can vary. Let’s take a look at some of these variances below.
Average price paid by retailer – tire market insights
- Of all major tire outlets, Costco and Walmart are the outlets showing a notably different average price than the industry average.
- The average cost for tires at Costco comes in $21 higher than the industry APP at $241.
- The average cost for tires at Walmart was $184 – which is $36 lower than the industry average.
- Other major outlets saw an average price paid that was only slightly higher than the industry average (mostly within a $10 range). This includes our market share leader, Discount Tire, where consumers paid an average tire price of $228, which is only $8 higher than the industry average.
Average price paid by brand – tire market insights
Three of the leading tire brands saw an APP higher than the industry average: Michelin ($257), BFGoodrich ($251), and Bridgestone ($246).
Online vs. in-store sales trends for the U.S. and Canadian tire market?
Online vs. In-Store: U.S. Tire Trends
In-store remains the most common sales channel for tire purchases. In fact, 78% of tire sales are made at a physical retail location.

Here are some of the trends that TraQline uncovered:
- Only 12% of tire purchases are made online, with the remaining 10% coming from alternate channels such as catalogs.
- Of the 12% that purchase online, 58% ship directly to store.
- After an increase of 0.8 points in June 2022 (rolling 4Q), in-store sales comparatively significantly declined 1.0 point in June 2023.
- Online sales significantly increased 1.0 point in that same timeframe.
- Historically, consumers pay about the same price for tires when purchasing online as they do when purchasing in-store.
- This trend continues for 4Q ending June 2023 with an average price for online shoppers of $221, and an average price of $220 for retail purchasers.
- Among the leading retailers, Firestone shows the greatest gap in APP when comparing online to in-store sales. The average price paid online for tires at Firestone was $37 cheaper than when purchased at a retail location.
Online vs. In-Store: Canadian Tire Market
For the Canadian market, in-store sales are also the most common channel (66%). Online sales account for 15% of total purchases.
Unlike the U.S. market, purchases from other channels (such as catalog, mail order, TV shopping) are much higher in Canada. Interestingly:
- 19% of Canadian purchases are from these alternative channels.
- Canadian purchases from these other channels are up 0.8 points from this time last year.
Other key US tire market insights
Durable IQ is more than market share, delivering a complete understanding of the tire market. Here are a few other key insights as of June 2023!
Tire Shopper Demographics
What demographic makes up the average tire shopper? Here are a few insights from TraQline’s census-balanced consumer data:
- 72% of tires purchasers are homeowners
- 62% of purchasers are married
- 54% of tires are purchased with males alone involved in the decision; 16% involve males and females
- 59% of tire shoppers are over 55 years of age
Top Selling Tire Types
Has the recent increase in heavier EV vehicles changed consumer patterns for tire purchases as they look for more durable tires? Not necessarily. As of June 2023, “general everyday driving” continues to be the most popular tire type in both the U.S. (80%) and Candian (46%) markets. Other tire types include:
- Designed for higher performance
- Exclusively for winter conditions
- Designed for terrain such as unpaved surfaces/roads
Though similar to preferred tire type in previous years, purchases of the “general everyday driving” tire type did increase significantly in Canada (+2.9 points) from this time last year.
Tire Purchase Drivers
What moves a consumer to purchase new tires? Here are some insights into the why behind the buy.
Consistently year-over-year, “competitive price” remains the top reason for purchasing at a specific retailer.
- In fact, 53% of purchasers mention “competitive price” as a reason for retailer purchase.
- Both Costco and Walmart over-index in that regard with 80% and 77%, respectively, mentioning “competitive price” as a reason for purchasing at that retailer.
Brands & Outlets Shopped Before Purchase
When purchasing tires, most buyers shop only one outlet (76%) and the majority shop only one brand (57%) before making a purchase.
Get more insight into tire trends and market share
The tire market insights don’t stop here. For more retail sales data, market share, and insights on the tire market, download the OpenBrand-exclusive infographic below. To see insights for other industries or find out how we can help power growth for your business, contact us today.

US Mattress Market Share: Top Brands & Retailers & Retail Industry Sales Data for 2023
According to Forbes Vetted, the best overall mattress in 2023 comes from the Nectar brand – but what does the voice of the consumer say? Let’s look at which brands and retailers are winning market share, as well as other consumer trends and insights across the mattress market.
Read on to discover current consumer preferences regarding mattress brands, preferred purchase locations, and the underlying factors shaping consumer buying behavior. For even more actionable market intelligence, download our complimentary US mattress market infographic.
Source: All data in this article was pulled from the OpenBrand MindShare platform using the rolling 4Q ending Q2 2023, US Mattress category. For the most recent insights or further dives into the data, please contact us. 
Who are the top mattress retailers by market share?
As of June 2023, the leading retailers in the U.S. mattress market were Mattress Firm and Amazon.
In dollar share, Mattress Firm maintained its lead, winning 18% of consumer dollars, and growing one point compared to rolling 4Q ending June 2022.
In unit share, Amazon continued to lead all other outlets, winning 20% of all purchases – enjoying a significant 5 percentage point increase year-over-year (YOY).
Draw-Close Rates
Amazon also took the lead compared to all other major outlets in draw rate, drawing in 26% of all mattress consumers. Additionally:
- Amazon’s June 2023 (R4Q) draw rate reflects a 5-point increase YOY.
- Of the 26% drawn in, Amazon closed sales with 75% of shoppers – an increase of 3 percentage points compared to the same time last year.
- Notably, Amazon had the second highest closing rate, coming in just behind our other leading retailer, Mattress Firm – who held the top spot at 79% close rate.
Outlets Shopped
Given the high percentage for close rates, it’s no surprise to see that most mattress purchasers shop only one outlet (71%) and consider only one brand (72%).
Who leads mattress market share by brand?
Sealy continues to lead all other mattress brands in both unit and dollar share. Winning 15% unit share as of June 2023, Sealy has maintained this lead for the past 4 years.
Notably, Sealy’s market winning 16%-dollar share reflects a rebound of 0.4 percentage points after two consecutive years of decline.
Other mattress brand winners
- Serta continues to hold its spot as the second leading mattress brand in both unit and dollar share, with modest gains from this time last year.
- Tempur-Pedic comes in as the third leading mattress brand with 3%-unit share and 9%-dollar share. However, despite enjoying a significant unit share increase in 4Q ending June 2022, the Tempur-Pedic brand is seeing a significant decrease YOY in both unit share (-1 points) and dollar share (-2 points).
- Coming in close behind Tempur-Pedic for unit share is Purple (3%) and Sleep Number (2%)
See the full breakdown of brands by market share in our infographic.
What is the average price paid in the US mattress market?
Across the industry, the average price paid (APP) for a mattress was $763, which reflects no significant change YOY, but has dropped by $7 since June 2022.
However, the average amount spent at different outlets shows a greater variance.

Average price paid by retailer – mattress market insights
1. Consumers purchasing at Mattress Firm pay a much higher average price than the industry average – $1,194.
2. The average price paid at Amazon is more than half the industry average – $303.
3. Consumers purchasing at specialty or furniture channels pay significantly more than the industry average price paid.
How are online versus in-store sales trending for the US mattress market?
Despite Amazon’s lead in unit share, in-store remains the most common sales channel for mattress shoppers, accounting for 51% of purchases.
Additional online vs. in-store shopping trends
- After a 4-percentage point increase in 4Q ending June 2022, online sales fell 6 points for 4Q ending June 2023.
- However, online sales have increased from this time last year. These fluctuations in the purchase channel are likely explained by changes in concerns during and after the pandemic.
- Consumers pay a significantly lower average price when purchasing mattresses online, with an online average price paid of only $524. Meanwhile, the average price paid for in-store purchases was more than double - $1,073.
Other key US mattress market insights
Durable IQ also goes beyond retailer and brand market share, delivering a comprehensive view of the mattress industry. Here are a few other key insights as of June 2023!
Mattress Shopper Demographics
We now know what mattress brands consumer bought most and where they purchased them. Let’s look at who is making those purchases.
Durable IQ’s census-balanced respondent pool delivers insights on the typical mattress consumer including:
- 56% of mattress purchasers are homeowners; 42% are renters
- 55% of mattress purchasers are married
- 47% of mattress purchases are made with females only involved in the decision; 20% of purchases are made with males only
- 45% of purchasers have a household income of $75,000+
- 54% of purchasers are aged 55+
Top Selling Mattress Types
- Foam mattresses continue to be the most popular mattress type, accounting for 36% of all purchases – a significant increase of 2.7 percentage points versus this time last year.
- Hybrid mattresses are the second most popular, making up 24% of all purchases.
Mattress Purchase Drivers
- Tracking with previous years, when it comes to purchasing a mattress at a particular retailer, “competitive price” remains the top driver for retailer selection, factoring into 62% of purchases.
- For mattress purchases overall, 40% are made because the “old one was broken.”
- Notably, those purchasing at Ashley Furniture are more likely to mention “replacement of existing” as a reason for purchase (56%) than those purchasing at other retailers.
Get more insight into mattress industry market share
For more retail sales data, market share, and insights on the mattress market, download the OpenBrand-exclusive infographic below. To see insights for other industries or find out how we can help power growth for your business, contact us today.

Unmatched durable goods business intelligence — now available for academia
The availability of TraQline data through Dewey is exclusive to the academic community!
For over 20 years, TraQline has been the leading provider of market intelligence to businesses across the durables industry.
Now, TraQline delivers our data to academia, supporting the future of the industry by empowering researchers, professors, and students to better understand the market through insights.

This data is accessible through a new partnership with Dewey — a data platform designed for educational institutions — which delivers our unmatched competitive durables business intelligence with special packaging and pricing exclusive to this key audience.
About our new academia offering
The durable goods market insights and consumer survey data (pulled from Durable IQ) provided through Dewey will empower researchers with the information needed to uncover trends, reveal patterns, and predict consumer behavior across the industry.
Through subscription basis on Dewey, academics can now access:
-
- Newly released data from the most recent quarter
- 250+ durable goods categories (e.g. mattresses, TVs, appliances, etc.)
- 40 quarters (10 years) of historical trend data, ready for analysis
- Data on price paid, online vs. in-store shopping, key consumer geodemographics, purchase drivers, brand performance metrics — and more!
TraQline data currently helps durable goods companies like Home Depot, Stanley Black & Decker, Serta Simmons, and other industry leaders to better understand their market and shifting industry trends.
Through our partnership with Dewey, we are doing the same for academia — powering the important research and learning happening within renowned educational institutions across the US.
Published research featuring TraQline data
Various academic institutions already use TraQline data to amplify and support their research, including:
-
- Dartmouth — Mergers, Foreign Competition, and Jobs: Evidence from the US Appliance Industry (2023)
- Lawrence Berkeley National Laboratory — A Retrospective Analysis of the 2011 Direct Final Rule for Room Air Conditioners (2021)
- American Economic Review — The Product Relocation and Price Effects of US Trade Policy: The Case of Washing Machines (2020)
Interested in accessing TraQline’s business intelligence data?
Jump on over to Dewey now to get started. Dewey accounts are free and require only a .edu email to access data subscription details.
To learn more about the data available through TraQline visit the Durable IQ product page or fill out the form below and we will be in touch!
Want to know more about the our unmatched
durables market insights? Contact us today!

Now Delivering More Competitive Business Intelligence Tools for the Outdoor Power Equipment Market!
OpenBrand now delivers even more unmatched competitive and actionable market intelligence to the outdoor power equipment industry through an update to our Market Measurement and SKU database systems!
With this update, both our groundbreaking share insights platformand our competitive SKU-level product library are now available for retailers and manufacturers in the outdoor power equipment (OPE) space.
Launched in 2020, OpenBrand Hybrid POS is groundbreaking visual data analytics platform, delivering modeled brand and retailer market share.
Hybrid POS for OPE: SKU Tracking Insights by Brand & Retailer
TraQline Hybrid POS provides granular-level detail into the OPE industry. With this tool, OPE industry professionals are able to better understand and act on what is selling at the nation’s top OPE retailers — and why.
Insights now available to the OPE industry include:
-
- Brand share data for top selling SKUs at major retailers across the US
- Twice weekly updated prices for nearly every SKU sold at these retailers
- Brand and SKU share
- Changes in brand and SKU share over time
- Comprehensive competitive product library
- Real-time cross brand and model comparisons
- and more!
Discover more about Hybrid POS
Sample data pulled from Hybrid POS for July 2023
OPE SKU Product Matrix & Retail Pricing Intelligence
TraQline delivers the most comprehensive product library available for the OPE industry. Designed to save 100s of analyst hours in data scrubbing — and empower them to make data-driven decisions.
Our system currently has thousands of SKUs for OPE, and that number is always growing. Platform benefits include:
-
- Twice weekly update pricing data for all SKUs
- Feature normalization across brands
- Easy comparison of up to six models for all features and attributes
- Availability information with easy links to store websites
- and more!
OpenBrand: Competitive Business Intelligence for OPE
Combined with our consumer insights tool and 4Ps data, OpenBrand delivers a total market insights solution for the industry, empowering insights, marketing, merchandising, sales, and beyond to understand their market better than ever.

How Market Insights in Durable Goods Retail Help Customize the Shopping Experience
Personalization is a powerful tool in the durable goods retail industry — one that not only do customers expect but that competitors are using. Subsequently, companies that lack necessary consumer insight and personalization create gaps that allow the competition to step in and gain share.
On the flipside, brands that tailor customer experiences, recommendations, and even discounts to align with the specific needs, interests, and preferences of their shoppers can solicit increased investment — and greater loyalty — from their consumers.
Additionally, the utilization of personalization in the durable goods retail sector can offer numerous other benefits. According to a study on personalization by McKinsey & Company, this can include reducing customer acquisition costs by as much as half and improving revenue by 5 to 15 percent, and an overall increase in ROI by 10 to 30 percent.
Implementing Personalized Customer Experiences
However, implementation is not guesswork. Creating truly personalized customer shopping experiences involves using consumer data, technology, and SKU data analytics to better understand — and therefore better tailor toward — specific customer segments.
Nuanced data, such as SKU data and consumer insights that are offered through products like TraQline Durable IQ, Hybrid POS, and SKU Metrix, are making a big difference in the way companies can tap into these resources. These tools can help drive personalized shopping experiences, delivering more authentic experiences that create positive outcomes for customers and companies.
Understanding Consumer Behavior Through Data
Gone are the days when decisions were made by a “hunch” on the way consumers would act or what consumers wanted.
Today, data is readily available to create better decision-making opportunities for businesses. Consumer data helps companies understand what customers want, need, and expect, allowing them to customize the customer’s brand experience, ultimately leading to better revenue.
Importantly, accessing and analyzing consumer data is now more accessible than ever through data providers like TraQline and software-as-a-service (SaaS) platforms. With the use of these robust platforms, companies gain access to seemingly endless data points and consumer insights — delivered in a simple, efficient, and visual manner.
The key for companies is to identify the key customer preferences and purchase patterns within those bites of data to allow them to formulate product development, marketing, and engagement opportunities.
Data-Driven Product Development & Recommendations
As companies strive to deliver successful new products to market, using data-driven insights to understand what consumers need and want can make all the difference.
By aligning with market demand, companies can develop products that outshine the competition through the integration of customer-driven feature development, styles, functionality, and more.
Companies can also create personalized product recommendations for their customers. That is, deliver offers to customers for products they are more likely to buy, rather than random product pushes. While a company may have thousands of products, consumer data presents the opportunity to know which products to recommend based on market demand and buyer trend data — as well as through awareness of what the market is buying most at your top competitors.
Numerous product recommendation strategies exist, and all can be tailored to meet the individual needs of the company and customer base. Consider a couple key competitive intelligence product marketing tactics that can be done in the durable goods retail sector.
1. Personal add-ons or supportive products and services
If a company sells laptop computers, it’s likely their customer base isn’t going to purchase another in the next year. However, the customer base may need software, cables, as well as other accessories to make using the laptop beneficial.
2. Email marketing product recommendation strategy
With data about the customer’s needs, companies can then begin to market to them through email. In many areas of durable goods, customers need to analyze information numerous times before making a buying decision.
Companies that use email marketing as a touchpoint can deliver highly targeted messages about a product that encourages the customer to come back to the website. An interactive email, for example, showcasing the latest features of a car could entice the user back to the site sooner.
Customizing Marketing and Promotions
Data analytics is a valuable tool that can be used for personalized marketing campaigns. With this insight into the customer’s needs, interests, and wants, it is possible to this nuanced consumer information to deliver more effective promotional strategies.
A company that launches a sales campaign on one product can only assume to get customers interested in that one product to make the purchase. However, a company that, instead, is capable of sending targeted promotions to people based on their specific interests and proven needs is more likely to see amplified results in any campaign.
There may not be a better example of this than Amazon, which is consistently noted for its ability to provide highly targeted promotional content directly to interested parties. By leveraging what people do on their website, the retailer is able to suggest products for that category as well as for related categories that may interest them, increasing sales opportunities.
Creating Consumer-Driven Physical Retail Spaces
With tools like TraQline, companies can enhance the personalization process not just online but also through in-store experiences. McKinsey & Company pointed out that the use of creating an omnichannel experience for customers – where online and in-person interactions and all other touchpoints are equal, is a way of providing “moments of delight” for customers. It is in those moments that customers come back, time and time again, for support and to make purchases.
By implementing personalized customer service and assistance in physical locations, it is possible for brands to stand out from the competitors and leverage the data they have available to them to improve customer outcomes. The key is creating a seamless omnichannel shopping experience with personalization.
Consider how this can influence business decision-making, competitive intelligence, and product strategy.
Before a company can evaluate new store locations, it must have access to valuable data about the potential market within that area. Before any marketing can take place, it is critical to understand the customer.
Some of the data that helps with making these decisions falls into four categories.
1. Environmental data
Is there a local customer base for the product? This is often the most obvious of all factors to consider but is the critical first step. Does the local community support the needs of the business? You would not build a farm in Manhattan, for example.
2. Consumer behavior data
Next, consider who the customer actually is. This includes gathering valuable data related to the following:
- Who buys based on demographics
- What do they buy on average
- When do they make such purchases
- What is their pain point
- What motivates them to make a purchase
This information helps to define if that customer base exists within a target location.
3. Economic conditions
The financial elements within a company also play a strong role in how well a company can perform there. For example, are there enough customers within the target area to meet the company’s needs? Does the location have the financial means to support the company? This provides insight into the demand for the product based on the economic conditions present. For example, in a community with significant new housing expansion, an appliance center makes sense.
4. Competitive data
Who is the competition, and what are they doing well? Key to competitive business intelligence is understanding is not that there’s no competition but that there’s an opportunity to compete with that organization.
This information allows for demand modeling, a method that addresses how well a local community can support the company’s revenue needs.
Data-driven decisions are core to every business, no matter the industry. Consider the demographics carefully based on any location data available. For example, in a college-centric town, opening an IKEA, which offers competitively priced, modern furniture, could be a good idea. In an older community with larger homes, perhaps even historic homes, offering a luxury and high-end appliance store fits the bill.
Invest in High Quality SKU Data
Another data point for companies to consider is high-value SKU datasets. Most companies are already using SKUs to sell to their customers, and that often enhances the rate of selling as well.
However, SKU data allows brands to get to know their customers even better, further enhancing marketing and personalization. That could include information such as time, volume, and geographic level data. With this information, it can help brands to put the right products in front of the right customers at the right time.
Specifically, SKU data can help companies:
1. Make better decisions about which products sell within a smaller, highly targeted area, thus enhancing the decision to open locations within one area or the next.
2. Enhance their offerings to better meet the needs of the customer by putting the right product on the store shelves to meet those customer’s unique needs, maximizing the use of space while prioritizing their niche client base
3. Gain better insight into the length of time it takes products to move off the floor. This allows companies to notice, for example, if a slow-margin SKU is sitting for a long time and subsequently make a change, replacing it with a higher demand product within the local market, moving more products faster
4. Empower small retailers, even those with highly specialized inventory, to stand out from full-size stores in larger cities. Larger retailers tend to offer a bigger selection of products with the goal of targeting the biggest audience of customers. By providing more specialized products, smaller competitors can stand out.
Enhancing the Online Shopping Experience
With all of that consumer, product, and retail sales data available, how can companies translate it into online personalization opportunities as well? It may be easier to accomplish this than many organizations think. Personalization on e-commerce websites can be diverse and far-reaching, creating numerous opportunities to connect with customers in meaningful ways.
- Product Pages: Product pages can provide an exceptional way of educating customers and providing them with more of the data they need to decide.
- User Interfaces: User interfaces should be designed to create an omnichannel experience that aligns with the in-store experience. This includes everything from branding to how a person navigates the online site compared to how they navigate the local, physical location.
- Dynamic Content: Providing online consumers with access to dynamic content allows them to gather information they need that they could not obtain in a simple e-commerce store format, encouraging the buy.
- Product Suggestions: With tools that can provide better insight into the customer’s actions on the site, it is possible for companies to create more product suggestions, either encouraging a related product if the customer does not make a purchase or suggesting an added feature, further keeping them on the site exploring their options.
The impact of personalized shopping experiences is not just on increased sales, though that is typically one of the most valuable of the benefits. More importantly, though, it improves customer satisfaction. As noted in Forbes, not only does personalization in marketing for durable goods create good results, but it also creates an opportunity to maintain lifelong conversations with customers.
Investing in Personalization in Durable Goods
From SKU data to marketing insights from consumer behavior, personalization in the durable goods market is one of the most important tools companies have for improving their sales funnel, increasing sales, and building a better, more recognizable brand. Data analytics provides customized shopping experiences that consumers need and expect.
As a durable goods retailer, it is critical to embrace personalization to enhance customer engagement and loyalty, even over the long term.
Outdoor Power Equipment Market Share: Top Brands & Retailers
The debate between gas versus battery-powered has taken the outdoor power equipment market by fire. With the pros and cons being weighed about which power source is more cost-effective and efficient, let’s look at which brands and retailers are winning the market amid the discourse, as well as other trends and insights across the outdoor power equipment market.
Read on to discover current consumer preferences regarding outdoor power equipment brands, preferred purchase locations, and the underlying factors shaping consumer buying behavior. For even more actionable market intelligence, download our complimentary US outdoor power equipment industry infographic.
Source: All data in this article was pulled from the OpenBrand Market Measurement dashboard using the rolling 4Q ending Q2 2023, OPEI Plus Power Washer category, an aggregate of various outdoor products. For 4Q ending Q2 2023, Outdoor Power Equipment purchases consist mostly of the following Durable IQ product groups: Line Trimmer, Leaf Blower, Mower: Walk Behind, Chain Saw, and Pressure Washer. These groups represent 82% of the product aggregate.
For the most recent insights or further dives into the data, please contact us.

Who are the market share leaders in the outdoor power equipment market?
Outdoor Power Equipment Market Share by Retailer
As of June 2023, the leading retailer in the outdoor power equipment industry is Home Depot, with 27% unit share and 29% dollar share. Despite being industry leader last year in the same period. Home Depot did experience a significant drop (1.0 point) in unit share year-over-year.
The second leading retailer for outdoor power equipment is Lowe’s in unit and dollar outlet share, with 22% and 24% share, respectively.
Outdoor Power Equipment Market Share by Brand
Looking across the past four years, Ryobi has maintained their place as the top outdoor power equipment brand, winning 11.4% of the market (in units sold) as of June 2023. Additionally, Ryobi also leads other brands in dollar share at 9.6%, with no significant changes year-over-year.
The second leading brand for outdoor power equipment is Craftsman, who continues to hold this spot year-over-year with 8.2% unit and dollar share – despite also seeing a slight decrease compared to this time last year.
Which outdoor power brand is gaining market share?
Of all the major outdoor power brands, Dewalt saw the largest unit share increase versus this time last year (seeing significant growth at 0.5 percentage points). Dewalt is also one of the only top outdoor power brands to significantly increase share over each of the past four years.
How much do consumers spend on outdoor power equipment?
As of June 2023, the industry average price paid for outdoor power equipment was $202, which is a slight increase of $20 compared to the same time a year ago ($192 average price).
However, the average amount spent at different outlets can vary. Here are a few interesting pricing insights for the outdoor power industry:
- Walmart and Amazon purchasers show the lowest average price spent across outdoor power equipment products, at $143 and $144, respectively.
- Outdoor power equipment retailers with a smaller unit share typically saw prices higher than the industry average, such as Ace Hardware ($249) and independent dealers ($255).
- Across all outdoor power equipment brands, Toro had the highest average price paid, coming in at $337.
Which demographic buys the most outdoor power equipment?
Durable IQ’s census-balanced respondent pool delivers consumer demographic insights for the OPE industry. As of June 2023, demographics for outdoor power equipment buyers include:
- 80% are homeowners
- 59% have a lot size of ½ acre or less.
- 56% have been at their current address for 5+ years
- 61% are married
- 61% are ages 45+
- 58% of purchases are made with only males involved in the decision; 19% are made with males and females
How are online versus in-store sales trending for the outdoor power equipment market?
As of June 2023, in-store remains the most common sales channel for outdoor power equipment consumers, with 66% taking place at a brick-and-mortar location. Additionally:
- After an increase of 1.2 percentage points this time a year ago, in-store outdoor power sales dropped back down 1.2 points, as online sales saw significant growth.
- Consumers historically pay a significantly lower average price when purchasing outdoor power equipment online – with an average price of $182 paid by online shoppers in June 2023, and an average price of $212 paid for retail purchasers.
Battery overtakes gas — and other key outdoor power equipment market insights
Durable IQ delivers a comprehensive view of the outdoor power industry — from share insights to purchase drivers. Here are a few other key insights as of June 2023:
Fuel Type
- After significant growth, in June 2022, battery-powered (38.3%) overtook gas-powered (34.3%) as the most purchased fuel type.
- This trend has continued through June 2023, with battery-powered purchases increasing 1.9 points, and gas-powered purchases decreasing 2.0 percentage points.
Purchase drivers
- Across the industry, the top reasons for making OPE purchases were “old one broke” (44%) and “first time purchase” (21%).
- Amazon indexes higher than all other outlets for “a first time purchase” with 31%.
- As seen in previous years, “competitive price” remains the top reason for purchasing outdoor power equipment at a specific retailer.
- 56% of outdoor power equipment purchasers mentioned “competitive price” as a reason for retailer purchase.
- Amazon over indexes in this regard, with 76% of purchasers mentioning “competitive price” as a driver for shopping the retailer for outdoor power products.

Draw/close rates
- Home Depot continues to lead other major outlets for outlet draw rate (41%) but is down 0.5 percentage points from the same time last year. Additionally:
- Home Depot close rate (65%) is down significantly, decrease of 1.7 points.
- Lowe’s draw and close rates are similar to this time last year, but down slightly.
- Amazon’s draw and close rates are both up at 1.3 points and 1.1 points, respectively.
Number of outlets shopped: Most purchasers shop at only one outlet (60%) and most purchasers shop for one brand only (73%).
Get total market insight for outdoor power equipment
For more retail sales data, market share, and insights on the outdoor power equipment market, download the OpenBrand-exclusive infographic below. To see the insights for other industries or find out how we can help power growth for your business, contact us today.
Download the Outdoor Power Equipment Market Infographic

4 Ways TraQline Hybrid POS Upgrades POS Data Analytics
In today’s ever-changing business landscape, it is undeniable that data is a key driving force behind sustainable growth. And this is no exception for a consumer-based industry like durable goods.
Every customer consideration, engagement, and purchase delivers new Point of Sale (POS) data points, which subsequently creates the opportunity for better informed decision-making — all built around genuine consumer understanding.
Empowering consumer understanding through SKU data
One emerging area where POS data analytics can make a significant impact on business innovation and growth is in the durable goods industry. Historically, data in the durables and appliance industries has been hard to come by in an extensive or readily available system.
TraQline Hybrid POS™ (HPOS) entered the market to bridge that gap. HPOS is a next-generation SKU-level analytics platform, designed to give durables companies the POS data analytics they need to improve functions, optimize strategy, and elevate business growth.
Delivering product-level market share data across leading durables, outdoor power equipment, and appliance industry retailers — such as Best Buy, Lowe’s, and Home Depot — HPOS delivers unmatched data granularity on the best-selling SKUs across the outdoor power equipment and appliance industries. (Heads up: More industries coming very soon!)
Here are top four reasons businesses need competitive POS data analytics from Hybrid POS.
1. Hybrid POS Data Solves Retailer Participation Gaps
Traditional POS data providers rely on retailers voluntarily giving their POS data. While some retailers are willing to participate, participation gaps from retailers are common occurrences, leading to skewed data and an incomplete view of the market.
Alongside the difficulty of getting retailers to participate, gathering POS data from participating companies can still be challenging, as an aggregator must meet compliance and legal requirements.
Instead of relying on this inefficient and inaccurate system, Hybrid POS built a model that is completely free of retailer participation. Meaning that, unlike traditional POS data providers, the SKU data within our platform is not limited by retailers choosing to provide it. Subsequently, our SKU data is also without risk of being stripped away at the retailer’s discretion.

Visualizing POS Data
HPOS delivers our unmatched, retailer-agnostic POS data analytics through a visual and interactive analytics platform, making it accessible for your entire team, easy to filter and manipulate — and readily turned into actionable insights.
2. Hybrid POS Overcomes Traditional Reporting Limitations
Another pitfall of traditional POS data systems is the reliance on proprietary data to better understand the market and sales.
When a retailer opts into reporting for legacy POS data providers, they will control and own the data they provide. This can often lead to reporting limitations, as the retailer will set strict rules around data usage. These limitations can cause you to receive reports that are missing key models, key insights, and retailer-specific information.
Hybrid POS overcomes these traditional reporting limitations by using POS data from reliable sources that are independent of individual retailers. This data comes without limitations or restrictions, allowing for more through and comprehensive market, brand, and SKU analysis.
As an example, let’s look at how Hybrid POS overcomes a common restriction of retailer-supplier data: SKU share by retailer.
Delivering SKU share by individual retailer
Traditional HPOS data providers cannot report on individual retailer shares (e.g. Best Buy, Home Depot, Lowe’s), nor can they report on models (SKUs) that are sold at only one retailer (e.g. Best Buy-exclusive products such as Insignia). These other providers have a “rule of three” – meaning they need at least three retailers within a data set to publish it – and cannot report on anything lower.
Free of such regulations, Hybrid POS provides POS data analytics around not only what SKUs are sold across the market, but also at a specific retailer or for a specific brand.
In other words, Hybrid POS delivers market share for every SKU that is sold at the leading retailers – by retailer. Similarly, HPOS also provides data on brands, giving you actionable insights about derivative and private label models.
For example, with HPOS, you can find insights including but not limited to: 1) the percent of a product type sold by a specific retailer, 2) the amount of share won by a specific model, and most notably, 3) you can report the share of a specific model at one specific retailer, 4) SKU share by brand.
Recent POS data for OPE & appliance industry
To highlight the scope of data available through Hybrid POS, let's take a look at four recent insights from the tool.


1. Retailer share by product
In both dollar and unit share, Lowe’s earned 41% of sales for all front load washers in July 2023.
2. SKU product share
Ryobi’s #P2109BTL leaf blower was the leading model in July 2023, with 9% unit share across the three leading retailers. (Shown above, image one.)
3. SKU share by retailer
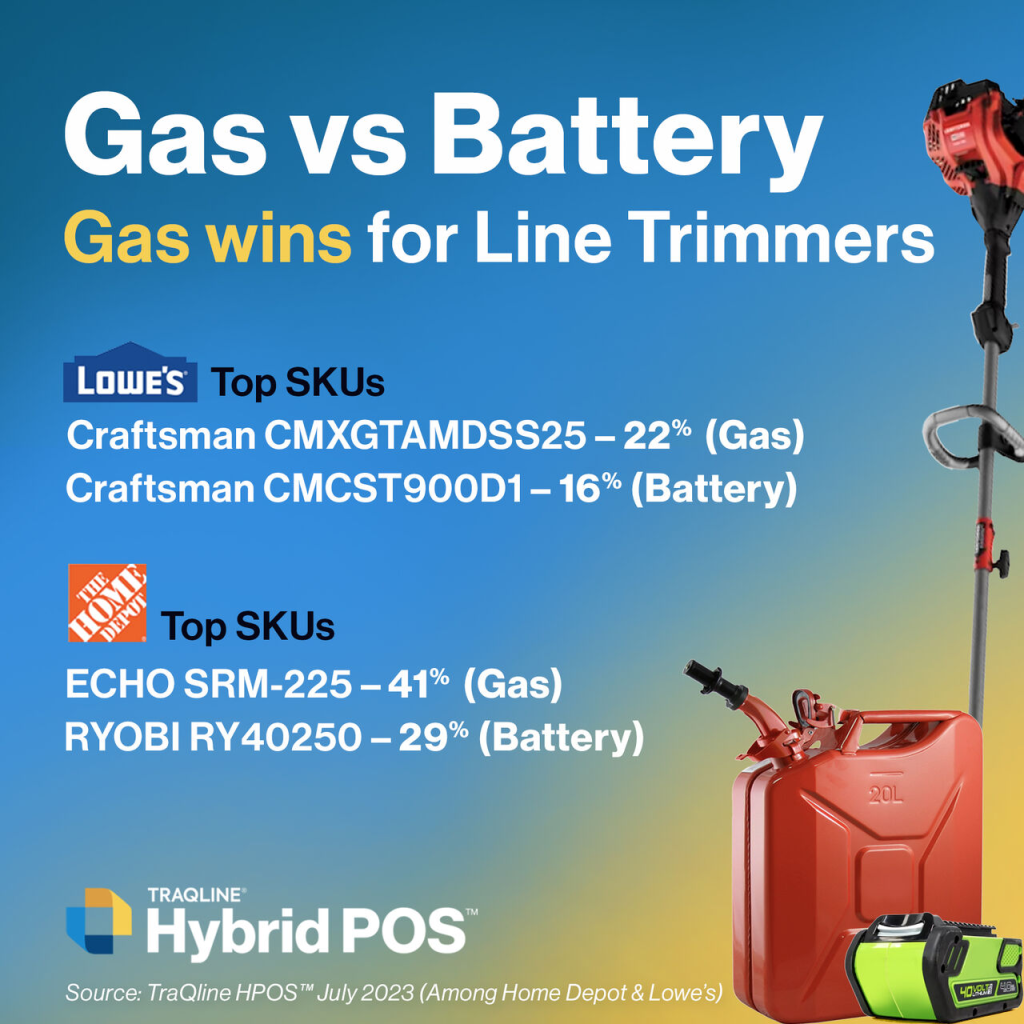
In July 2023, Craftsman’s #CMXGTAMDSS25 won 22% market share at Lowe’s — coming in as the leading gas-powered line trimmer. (Shown above, image two.)
4. SKU share by brand (+ pricing tier)
In July 2023, Samsung sold 34% of all 3-door French door refrigerators within the $1,900 or less dollar range. (Shown above, image three.)
3. Consistent Monthly Brand & Retailer Data
Due to the aforementioned reliance on retailer participation, traditional data providers always risk a retailer deciding to discontinue participation in the program.
Hybrid POS is able to deliver a consistent and retailer view of retailer and brand insights – allowing you to plan, measure, and analyze with peace of mind that the data will reflect the market without disruption from one period to the next.
To put this into perspective, let’s say your legacy POS data provider delivers data for the top four retailers in your industry. Unexpectedly, one retailers restricts access to their POS data. This would immediately impact the data available to you, as well as your analysis of the market, changing what percent of coverage you can compare and measure against.
4. HPOS Data Eliminates Transmission Errors
When you use a traditional POS system for data collection, POS data has to flow through retailers, aggregators, and customers. This unfortunately leaves open the opportunity for transmission errors to occur, due to issues with connection, timing, noise, and staffing, among others.
Errors can include anything from connections timing out, to signal distortion, burst errors, connection refusals, and many more. This can ultimately create incomplete and/or inaccurate data.
Since HPOS relies on raw data that does not pass through multiple connections, the end output delivers consistently and accurately – furthering the reliability businesses expect from our comprehensive market POS data analytics.
Empower Your Business With TraQline HPOS Data
At TraQline, we know how important accurate and accessible data is for our clients. Overcoming the limitations of traditional data providers allows us to power your business through more comprehensive, accurate, and reliable market data.
Get the POS data analytics you need to confidently keep an eye on current market trends — and elevate your business growth. Whether you want to eliminate participation gaps, utilize a more user-friendly POS system, gain deeper insights about your sales, or cut down on transmission errors, HPOS is the system for you.
Learn more about TraQline HPOS today. If you have any questions or want to start using HPOS data at your business, please contact us below.

Consumer Durables Market: 2023 Mid-Year Review
Are you monitoring the durable goods industry for growth and market changes?
TraQline is proud to deliver comprehensive product research and market data to help keep you informed, whether you’re looking to optimize your product matrix or track consumer market trends. Our 2023 Mid-Year Review of the consumer durables retail industry has led to notable insights. Discover them below.
Now available: Jump to the 2023 full year market report download.
Recent Consumer Durables Retail Sales Data
The U.S. Census Bureau recently released a report showing a third consecutive month of significant increase in orders for durable goods. According to the census report, orders for durable goods saw an overall increase of 2.3% in May. Product specific highlights include:
-
- Electrical equipment, appliances & components: 1.7% increase
- Other durable goods categories (furniture, mattress, OPE, etc.): 0.6% increase
- Computers & electronic products: 0.3% increase
Additionally, the Census Bureau more recently reported a fourth consecutive month of growth for retail sales.
Specifically, in July 2023, retail sales experienced a 0.7% increase, which also marked a 3.2% increase year-over-year. As highlighted by Forbes, this growth came in “well above expectations” and may highlight a decrease in the likelihood of a full recession.
Is an increase in durables orders a sign of economic growth?
Often, yes. By analyzing decades of comprehensive market data, we’ve determined that, given the longevity of durable goods products, an increase in orders can be a positive sign for the economy.
When more confident about the future, businesses and consumers are more likely to invest in big-ticket items such as appliances, furniture, computer equipment, and other durable goods products. This, in turn, can subsequently help to stimulate economic growth and create jobs.
Review TraQline’s research insights to discover other market trends.
2023 Mid-Year Report
Durables Market Trends & Retail Sales Data
Monitoring change within the consumer durables retail market industry does not stop at increases in sales.
Growth statistics are an inarguably valuable metric. However, to truly understand the impact of market shifts, we also need to understand our consumers, their preferences, and how that feeds into any increase or decrease in share.
To this end, TraQline recently released our 2023 mid-year market review, which highlights the current state of the industry.
Delivering a glimpse into our comprehensive market coverage, our 2023 mid-year report includes insights on everything from brand winners by industry to top retailers, online vs. in-store share, consumer demographic insights, average price paid shifts, and more. Download the report now – or keep scrolling to check out 10 exclusive high-level takeaways on the consumer durables retail market share.
Key Takeaways: 2023 Durables Market Mid-Year Review
1. As of June 30, 2023, the leader of the consumer durables retailer market share was The Home Depot, leading across four of the top 10 durables product categories tracked in Durable IQ™. Amazon was the top retailer for three product groups.
2. In the first half of 2023, Lowe’s held second place in durables retailer market share across four product categories.
3. Brand winners vary by industry and product category, with top brands like GE, Kohler, and Peloton taking the lead in their respective areas for the first six months of 2023.
4. Online sales are showing signs of leveling off at the end of Q2 2023, with only one percentage point gain versus the same period in 2022 (Q1 + Q2). The largest online sales increase over the past five years for the same period took place between 2019 and 2020.
5. In the first six months of 2023, sports equipment saw the highest percentage of online vs. in-store sales when compared to any other Durable IQ product category.
6. As of June 30, Amazon’s share in consumer durables has grown 5 percentage points since the second half of 2018 (Q3 + Q4).
7. Sports equipment, small appliances, and consumer electronics were the top three product categories sold on Amazon during the first half of 2023.
8. Major appliances saw the highest average price paid across key Durable IQ categories, with wall ovens as the product with the highest average price paid within this category.
9. Cell phone and consumer electronic purchases tend to have lower income buyers versus sports equipment, where consumers had higher income.
10. In 2023 so far, a higher percentage of baby boomers purchased kitchen & bath, home improvement, and lawn & garden products than any other generation, while a higher percentage of millennials purchased sports equipment.
Monitor your market with TraQline
The durables market is ever-changing. With each technological advancement and shifting consumer preference we see a corresponding change within the industry. Stay ahead of these changes, find a competitive edge, and drive sales growth with total market insight. To see how TraQline can help or request specific 2023 midyear insights, contact us today.
Get the 2023 FULL YEAR report — now available!
![Hero image for Windows & Doors Industry: Best Brands & Retailers, Market Share & Trends [Infographic]](https://openbrand.com/wp-content/uploads/2023/08/Windows-Doors-blog-featured-img.jpg)
Windows & Doors Industry: Best Brands, Market Share, Retail Sales Data, & Trends
Windows & doors represent a notable share of the US home improvement industry’s profits, and accurate insights here can go a long way predicting future product and business success.
Do you know what window and door brands consumers are buying most, where they are buying them, and what drives their purchase decisions (aka the why behind the buy)? Find out these answers and more below — and download our free US windows and doors industry infographic for even more actionable market insights.
Source: All data in this article was pulled from the OpenBrand MindShare platform using the rolling four quarters period ending March 2023, US Windows/Doors category. For the most recent insights or further dives into the data, please contact us.

Who leads U.S. home improvement market share in the windows and doors industry?
Windows & Door Market Share by Retailer
As of March 2023, The Home Depot continued as the leading retailer for windows and doors, winning 27%-unit share — which was an increase of almost 1 percentage point after a drop of 1.4 points in March 2022 (rolling 4Q).
Lowe’s was the second top-selling retailer for windows and doors with a 20%-unit share. However, Lowe’s was down significantly (about 2 points) in March 2022 (rolling 4Q).
Additionally, retail sales data insights demonstrate continued growth for specialty windows & door industry stores:
- While owning a much smaller segment of the market than the top home improvement players, at 14%-unit share window/millwork specialty stores cumulatively saw a significant increase during each of the past three years.
- Despite their smaller unit share, window/millwork specialty stores hold the lead in dollar share (37%) with a 20-percentage point advantage over the second highest dollar share leader (Contractors, with 17%-dollar share).
- Specialty stores in the windows and door industry are not only winning most of the market, but they are also seeing a significant gain! Versus the previous year, window/millwork specialty stores enjoyed a 5-percentage point increase.
Windows & Door U.S. Home Improvement Market Share by Brand
As of March 2023, the leading brand for windows and doors was Andersen, with 10%-unit share, continuing a 5-year lead over all other brands. Andersen also owns the market in dollar share at 17%, which reflects a rebound of 2 percentage points after a 3-point drop versus the same time prior year. Other top brands in the windows and doors space include Pella, Window World, Milgard, and Jeld-Wen.
How much do consumers spend on windows and doors?
As of March 2023, our retail sales data has indicated the industry average price paid for windows and door was $1,730, up almost $400 versus the same time in 2022.
Why are consumers spending more on doors and windows?
This rise in industry cost was mostly due to a significant rise in average price for window and millwork specialty stores – which also drove the significant increase to its dollar share and won them the market, as discussed above.
Average price paid for specialty stores, as well as through contractors, are historically higher than the industry average ($4,510 and $2,162, respectively). This was likely due to project size. Alternatively, at big-box stores like Home Depot ($691), Lowe’s ($667), and Menards ($523), consumers historically enjoy significantly lower than industry average prices. Again, this was likely due to the purchases going toward smaller project sizes, such as routine maintenance or minor repair, resulting in fewer products purchased.
What demographic buys the most windows and doors?
Durable IQ’s census-balanced respondent pool delivers consumer demographic insights for the windows and doors industry.
As of March 2023, demographics for windows and doors buyers include:
- 86% of consumers, across all outlets, own their own homes
- 93% of purchases at specialty stores were made by homeowners
- 61% of buyers are married
- 60% of purchases have a female involved in the purchase decision
- 42% of shoppers have a household income of $100,000 or more
- 64% of buyers are aged 55+
How are online sales trending for the windows and doors market?
As of March 2023, in-store remains the most popular retail channel for window and door sales, with consumers purchasing in-store 51% of the time.
Despite this popularity, sales were down about 3.5 percentage points from the time the previous year after a slight increase for in-store window and door sales in March 2022 (rolling 4Q). Correspondingly, online sales of windows and doors saw a slight increase of 0.5 percentage points following a significant decline of 2.5 percentage points in March 2022 (rolling 4Q).
Other key U.S. home improvement market insights on doors & windows retail sales data
Durable IQ delivers a comprehensive view of the windows and doors industry — from share insights to purchase drivers. Here are a few other key insights on the bathroom fixtures market as of March 2023:
Purchase drivers:
- As seen in previous years, “competitive price” remains the top reason for retailer purchase
- “Competitive price” (39%) and “appearance” (33%) are the most mentioned reasons for brand purchase
- 60% of all windows and doors are purchased as a “replacement of existing”
Draw/close rates: Home Depot continues to lead other major retailers in outlet draw (45%) and outlet close (60%). Lowe’s falls behind Home Depot in both draw (39%) and close (52%).
Number of outlets shopped: In 4Q ending March 2023, 55% of all purchasers shopped at only one outlet. Of the top retailers, Home Depot has the highest incidence of only shopping one outlet (56%). However, those purchasing from a window/millwork specially stores or through a contractor are much more likely to have examined only one product source – 65% and 63% respectively.
Get total U.S. home improvement market insight for doors and windows
For more retail sales data, market share, and insights on U.S. home improvement market, download the OpenBrand-exclusive infographic below. To see the insights for other industries or find out how we can help power growth for your business, contact us today.