



The Outdoor Power Equipment (OPE) market opened 2026 with the conversion advantage changing hands and the category’s biggest brand giving back share for the first time in a year.
Q1 sets the tone for the season. Pre-spring buying, snow thrower demand, and early handheld replacement cycles all land in the same quarter, which means assortment and availability decisions made in January show up in share by March.
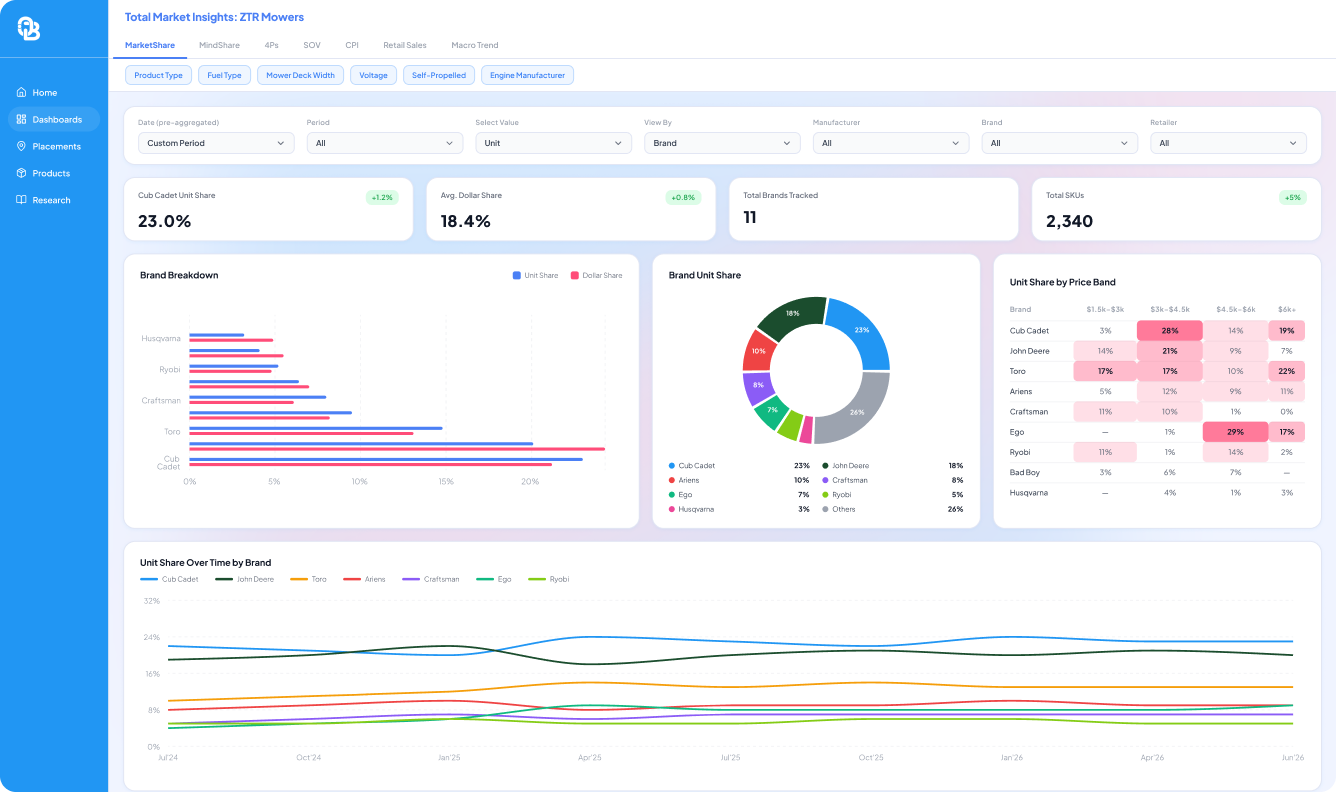
Our public MarketSignal dashboard shows that while Home Depot and Lowe’s remain firmly in control, the efficiency story that defined Q4 has reversed, and premium battery brands are gaining on both units and dollars.
Key Takeaways
According to OpenBrand’s Q1 2026 OPE market intelligence data:
- Home Depot leads the category in both reach and conversion, posting the highest draw rate (38%) and the highest close rate (70%), taking back the conversion lead Amazon held in Q4.
- Ryobi leads the category by more than 12 points at 21.3% unit share, easing 2.3 points from a promotional Q4 as Black & Decker, Ego, and DEWALT picked up share.
- Ego continues to outperform on value, capturing 12.5% of dollar share on 8.2% of units and gaining in both measures while most of the top five declined.
- Lowe’s and Ace Hardware gained dollar share as Home Depot lost 1.4 ppts, the largest dollar share decline of any retailer in the quarter.
- Price sensitivity eased notably, with 45% of shoppers citing competitive price as their reason for retailer choice, down from 51% in Q4.
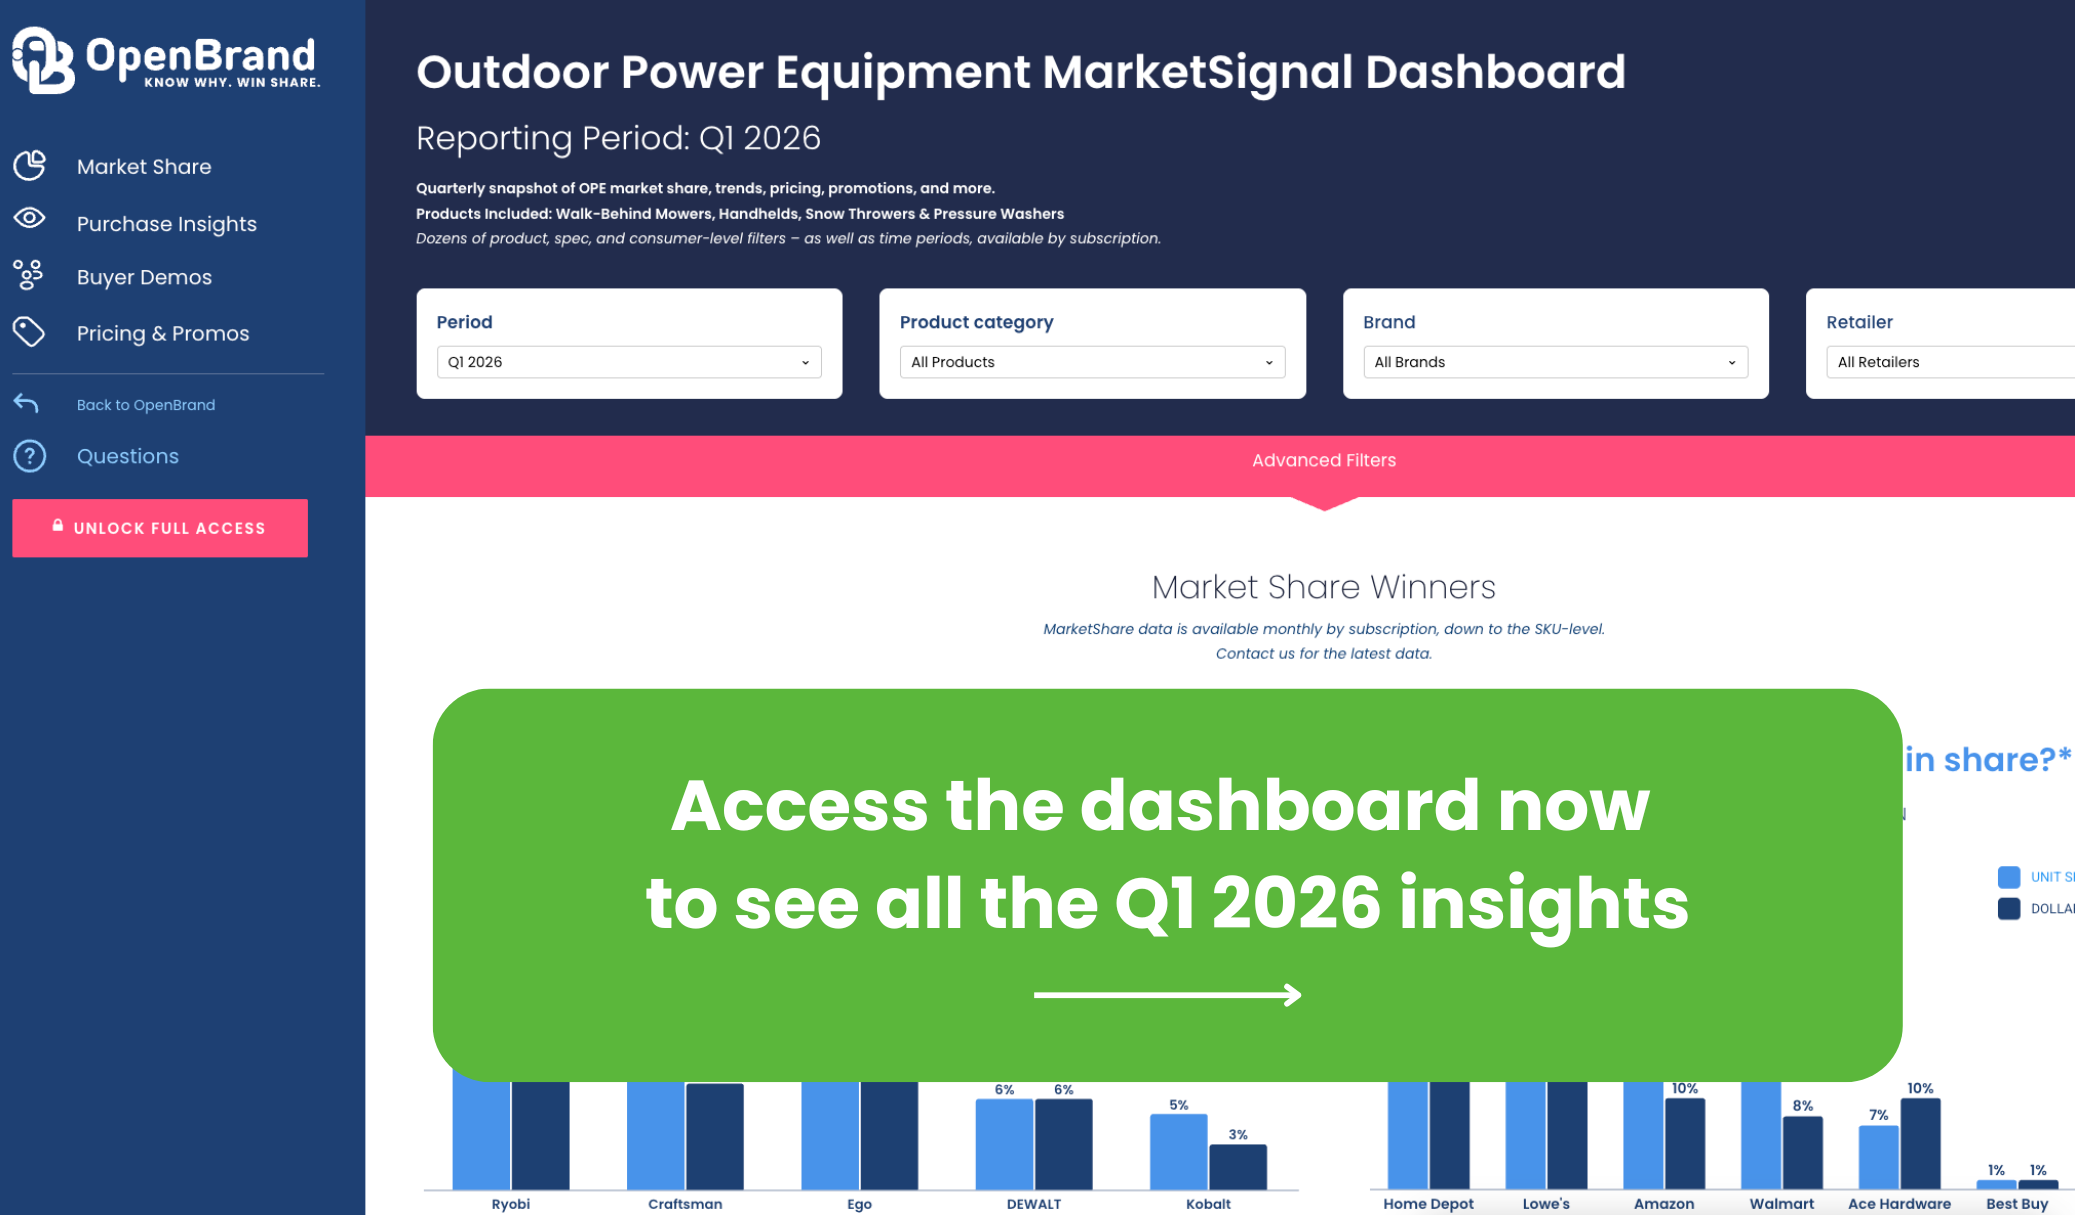
Explore these and the rest of our latest insights or dive into the dashboard to see how the market is moving.
SOURCE: All data insights in this article cover OpenBrand Q4 2025-Q1 2026 market intelligence data within an OpenBrand aggregate category of several products including Mowers, Handhelds, Snow Throwers and Pressure Washers.
Who are the top Outdoor Power Equipment retailers by market share?
According to OpenBrand’s Q1 2026 market intelligence data, the top OPE retailers are Home Depot and Lowe’s, leading in both unit and dollar share, with Lowe’s recovering the dollar share it lost during the holiday quarter.
Q1 performance shows a category where unit rankings held but value per transaction moved meaningfully between accounts. Check out the retailer share movement from Q4 2025 to Q1 2026, as well as the quarter-over-quarter (QoQ) percentage point (ppt) change below.
Note: OpenBrand’s share split is based on our retailer panel, which currently consists of Home Depot, Lowe’s, Amazon, Walmart, Ace Hardware, Best Buy, and Tractor Supply Co. These retailers make up a majority of non-individual dealer sales in the OPE industry.
Outdoor Power Equipment Retailer Unit Share Winners
| OPE Retailer | Q4 2025 Unit Share | Q1 2026 Unit Share | QoQ Change |
| Home Depot | 36.5% | 36.0% | -0.5 ppts |
| Lowe’s | 26.0% | 26.2% | +0.2 ppts |
| Amazon | 16.2% | 16.6% | +0.5 ppts |
| Walmart | 13.6% | 12.9% | -0.7 ppts |
| Ace Hardware | 6.4% | 6.8% | +0.4 ppts |
Outdoor Power Equipment Retailer Dollar Share Winners
| OPE Retailer | Q4 2025 Dollar Share | Q1 2026 Dollar Share | QoQ Change |
| Home Depot | 38.3% | 36.9% | -1.4 ppts |
| Lowe’s | 30.7% | 31.8% | +1.1 ppts |
| Ace Hardware | 9.9% | 9.9% | +0.1 ppts |
| Amazon | 10.4% | 9.6% | -0.9 ppts |
| Walmart | 9.2% | 8.2% | -1.0 ppts |
OpenBrand’s OPE Retailer Trend Insights
Home Depot takes back the conversion lead but loses value per transaction. Home Depot is now the only retailer leading both ends of the funnel, pairing the highest draw rate in the category (38%) with the highest close rate (70%). That is a reversal from Q4, when Amazon held the conversion advantage. The tradeoff shows up in value: Home Depot gave back -1.4 ppts of dollar share while holding unit share within half a point, which points to a lower-priced mix moving through a very efficient funnel.
Lowe’s recovers the dollar share it lost in Q4. After a -4.0 ppt dollar share decline during the promotional fourth quarter, Lowe’s added back +1.1 ppts to reach 31.8%, its strongest position since Q3 2025. It did this on essentially flat unit share, meaning the recovery came from mix and pricing rather than traffic. Its close rate of 59% remains the weakest among the national accounts, so the opportunity is still in conversion rather than reach.
Amazon gains units but loses value. Amazon posted the largest unit share gain of any retailer at +0.5 ppts while shedding -0.9 ppts of dollar share, and its close rate fell from the category-leading 72% in Q4 to 69% in Q1. That combination indicates more transactions at lower average value, likely weighted toward smaller handhelds rather than the higher-ticket equipment that drives dollar share.
Walmart declines on both measures. Walmart lost -0.7 ppts in units and -1.0 ppts in dollars, the steepest unit decline in the panel, despite continuing to draw 19% of category shoppers. Its close rate of 60% remains well behind its reach, so the gap between consideration and conversion that defined its Q4 performance widened rather than narrowed.
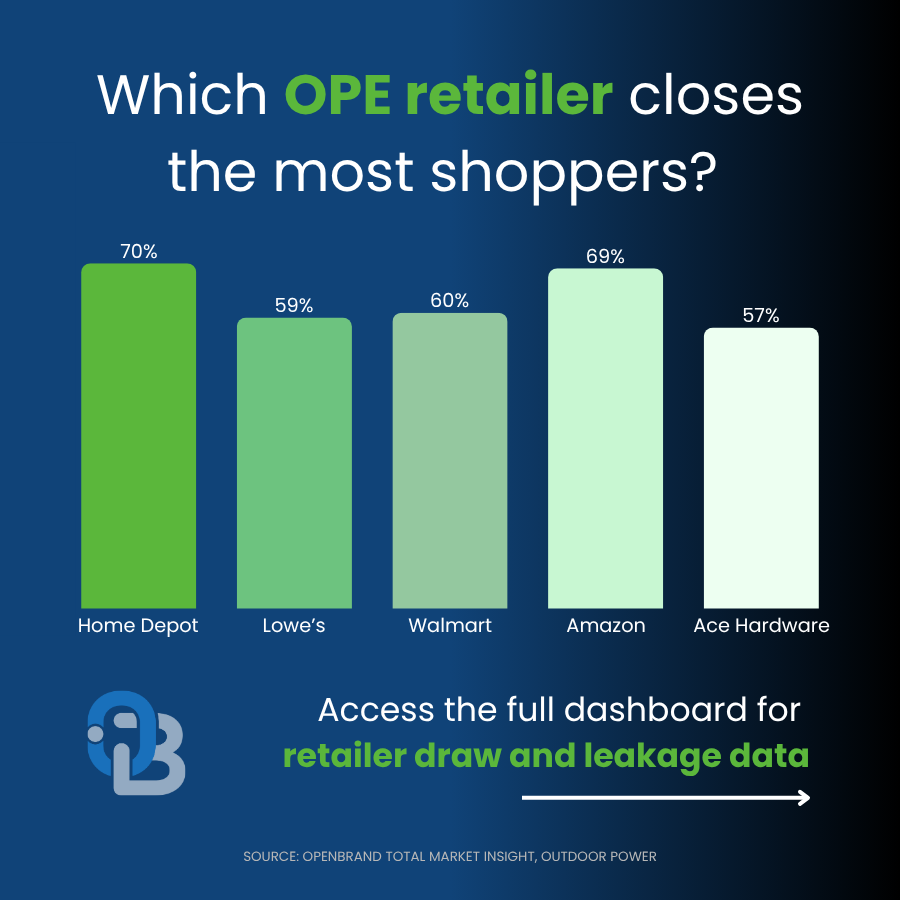
Outdoor Power Equipment Retailer Draw Rates
| Retailer | Q1 2026 Draw Rate | Q1 2026 Close Rate |
| Home Depot | 38% | 70% |
| Lowe’s | 32% | 59% |
| Walmart | 19% | 60% |
| Amazon | 12% | 69% |
| Ace Hardware | 6% | 57% |
OpenBrand’s OPE Retailer Trend Insights
Q1 shows the gap between attracting shoppers and converting them shifting in Home Depot’s favor.
Home Depot now leads both measures outright, which it did not do in Q4. Amazon still converts efficiently at 69%, but it no longer holds the category’s best close rate, and its draw rate slipped to 12% from 14%.
Walmart remains the most frequently considered retailer outside the two home centers, drawing 19% of shoppers, but converts only 60% of them. Lowe’s continues to serve as the primary alternative destination, capturing 53% of the shoppers Home Depot loses, by far the largest single destination for category leakage.
Home Depot’s own walk rate sits at 30%, meaning roughly three in ten shoppers who consider it buy elsewhere, and more than half of those go to Lowe’s.
Learn more about the impact of our leakage analysis.
Who leads the Outdoor Power Equipment market share by brand?
According to OpenBrand’s Q1 2026 market intelligence data, the top three Outdoor Power Equipment brands are Ryobi, Craftsman, and Ego.
Outdoor Power Equipment Brand Unit Share Winners
| OPE Brand | Q4 2025 Unit Share | Q1 2026 Unit Share | QoQ Change |
| Ryobi | 23.6% | 21.3% | -2.3 pts |
| Craftsman | 9.0% | 8.8% | -0.2 pts |
| Ego | 7.7% | 8.2% | +0.4 pts |
| DEWALT | 5.4% | 5.7% | +0.3 pts |
| Kobalt | 5.6% | 4.6% | -1.0 pts |
Outdoor Power Equipment Brand Dollar Share Winners
| Outdoor Power Equipment Brand | Q1 2026 Dollar Share |
| Ryobi | 15.2% |
| Ego | 12.5% |
| Craftsman | 6.7% |
| DEWALT | 6.0% |
| Kobalt | 3.1% |
For more brand share insights, including share trend over time, access our public OPE dashboard now.
OpenBrand’s OPE Market Trend Insights
Ryobi holds a commanding lead while giving back its Q4 gains. Ryobi still leads the category by more than 12 points, a margin no other brand approaches, though unit share eased from 23.6% to 21.3% after a promotional fourth quarter. The shoppers who moved went to premium and pro brands rather than value tiers, with Black & Decker taking 15%, Ego 13%, and DEWALT 9%. Against a category where units fell 14.1% year over year, share movement at the top is happening in a contracting market.
Ego is the clearest winner of the quarter. Ego gained unit share to 8.2% (+0.4 pts) and captured 12.5% of category dollars, a 4.3 pt positive gap between dollars and units. It was one of only two brands in the top five to gain unit share, and it did so while Ryobi and Kobalt both declined. Its position at Lowe’s, combined with premium battery pricing, makes it the most revenue-efficient brand in OPE.
Value brands lost the most ground. Kobalt fell -1.0 pts to 4.6% and Hyper Tough dropped -1.3 pts to 4.0%, dropping Hyper Tough out of the top five entirely. Against a quarter where average category price rose, the opening price point tier compressed rather than expanded.
Brand Consideration Rates
When purchasing Outdoor Power Equipment, consumers consider the following brands most often:
| Brand | Q1 2026 Consideration | Q1 2026 Close Rate |
| Ryobi | 11% | 68% |
| Toro | 8% | 66% |
| Stihl | 8% | 70% |
| Craftsman | 8% | 64% |
| John Deere | 6% | 79% |
| Black & Decker | 6% | 72% |
OpenBrand’s OPE Market Trend Insights
John Deere again posts the strongest conversion in the category at 79%, converting nearly four of every five shoppers who consider it on just 6% consideration. Black & Decker follows at 72%, and both brands demonstrate that awareness is not the constraint in OPE, presence in the consideration set is.
How are online and in-store sales trending for the Outdoor Power Equipment market?
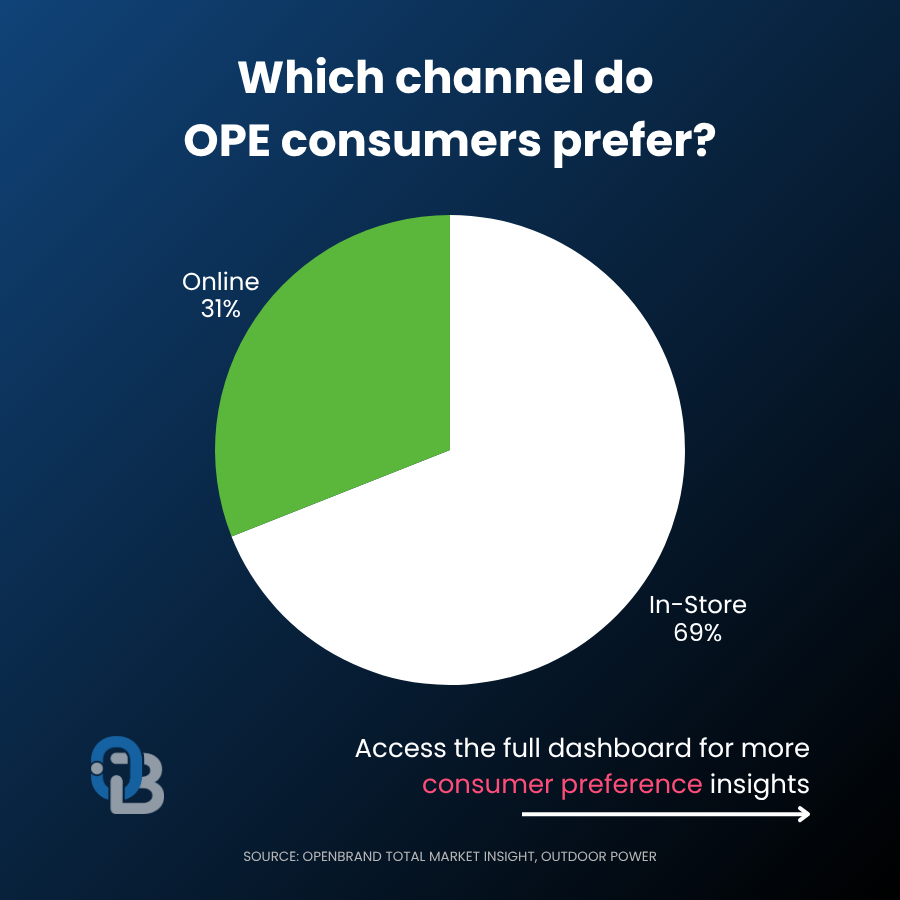
According to OpenBrand’s MindShare consumer insights, Q1 2026, brick-and-mortar stores continued to dominate OPE sales, with online holding just under a third of the market:
- In-store: 69% of purchases
- Online: 31% of purchases
OpenBrand’s OPE Channel Trend Insights
Outdoor Power Equipment Consumer Demographics
OpenBrand’s consumer tracking survey provides a census-balanced view of who is purchasing Outdoor Power Equipment and how that profile is evolving over time.
In Q1 2026, the typical OPE buyer reflects a category still closely tied to homeownership and maintenance-driven needs:
- 72% of purchasers are homeowners, while 25% rent
- 54% of purchasers are married
- 70% of purchases were made by males only in the buying process, compared to 30% by females only
- Millennials accounted for 34% of purchases, followed by Gen X at 27%
OpenBrand’s OPE Consumer Trend Insights
OPE Purchase Drivers
Why do consumers select a specific retailer for purchase? According to OpenBrand, the most mentioned reasons for purchasing Outdoor Power Equipment at a specific retailer were:
Why consumers select a specific retailer
- Competitive price: 45%
- Good selection of products: 29%
- Convenient location: 22%
- Previous experience with store: 18%
Price remains the leading driver but fell 5 ppts from Q4, the largest quarterly move among the four. Convenient location was the only driver to gain, rising to 22%. Coming out of a heavily promotional holiday quarter into a spring buying season, shoppers weighted proximity and availability more and headline price less.
Key OPE Pricing and Promotions Insights
Driving Share & Strategy in Q1 2026
Promotional activity in Q1 2026 followed a very different pattern than Q4, front-loading into January before settling into a steady climb through the spring ramp.
OpenBrand’s Pricing and Promotion Insights
-
Promotions peaked early, not late.
Average promotional value spiked to $138 in week 4 before falling to a quarter low of $67 in week 7, then climbing steadily to $98 by week 13. The January clearance window, not the end of the quarter, was the most aggressive promotional period. -
Discount depth thinned as the quarter progressed.
Average discount percentage started at 23.0% and ended at 21.3%, hitting a quarter low of 20.2% in week 13. Retailers reduced promotional depth heading into the spring season rather than deepening it. -
Average net price rose 52% across the quarter.
Net price moved from $509 in week 1 to $773 by week 14, with the increase concentrated after week 9. Because discount depth fell over the same period, the increase reflects a shift toward higher-priced mowers and pressure washers as snow thrower demand cleared out. -
Home Depot promoted more aggressively than the category.
Home Depot’s average promotional value peaked at $207 in week 11, more than double the category average that week, and ran above $150 for six of the fourteen weeks. That aligns with its dollar share decline, indicating share defended through price. -
Category pricing power improved year over year.
Average selling price across the category rose to $278 in Q1 2026 from $258 in Q1 2025, an increase of 7.7%, even as unit volume declined. Mix, not discounting, is carrying category dollars.
See more pricing and promotions data on the MarketSignal dashboard.
OPE Industry Outlook and Emerging Trends
What to expect in 2026 for the US Outdoor Power Equipment market?
What to expect through the rest of 2026 for the US Outdoor Power Equipment market?
The OPE market enters the spring season with a mix shifting upward, a category leader under pressure, and retail conversion advantages moving between accounts quarter to quarter.
Volume is contracting while value holds up.
Category units fell 14.1% year over year in Q1 2026 while dollars declined only 7.5%, lifting average selling price 7.7% to $278. Growth in 2026 will come from mix and attachment rather than unit expansion.
Battery premium is beating opening price point.
Ego gained on both units and dollars while Kobalt and Hyper Tough lost a combined 2.3 pts. Consumers trading up to battery platforms are outpacing those trading down on price, which reverses the value-driven narrative that dominated 2025.
Handhelds carry the category.
Handhelds account for 56.8% of category volume, ahead of mowers at 20.2%, pressure washers at 15.3%, and snow throwers at 7.7%. Battery platform compatibility across handheld tools is the primary path to multi-unit purchases.
Renters are a growing constituency.
With renters now at 25% of purchasers and Gen Z at 18%, a quarter of the category is buying for smaller properties. Compact, storage-friendly, shared-battery formats will matter more in assortment planning than they have historically.
Retail conversion advantages are unstable.
Amazon led close rate in Q4, Home Depot leads it in Q1. That volatility means conversion cannot be treated as a fixed retailer characteristic when planning channel strategy or line reviews.
Get more insight into Outdoor Power Equipment market trends
The market insights don’t stop here.
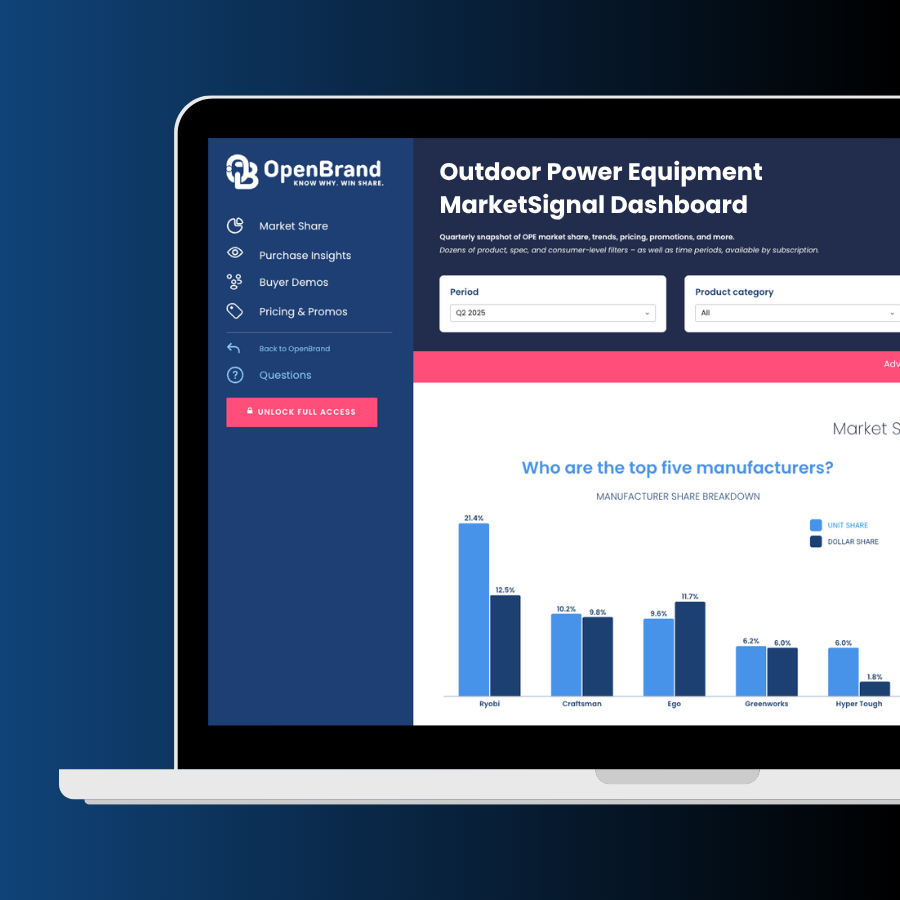
For more retail sales data, market share, and insights on the Outdoor Power Equipment industry, access the Outdoor Power Equipment MarketSignal dashboard now.
To see insights for other industries or find out how we can help power growth for your business, contact us today.
Frequently Asked Questions: Outdoor Power Equipment Market Share
Who has the highest market share in the Outdoor Power Equipment category?
According to OpenBrand’s Q1 2026 data, Home Depot leads all retailers in both unit share (36.0%) and dollar share (36.9%). Among brands, Ryobi holds the top position with 21.3% unit share and 15.2% dollar share, the largest of any single brand in the category.
Which OPE brand has the best close rate?
According to OpenBrand’s Q1 2026 data, John Deere leads all tracked brands with a 79% close rate, followed by Black & Decker at 72% and Stihl at 70%. These rates indicate that when shoppers consider these brands, they convert to purchase at a very high frequency.
Is Amazon still gaining share in Outdoor Power Equipment?
Partially. According to OpenBrand’s Q1 2026 data, Amazon gained unit share (+0.5 ppts) but lost dollar share (-0.9 ppts) from Q4 2025 to Q1 2026, and its close rate fell to 69% from 72%. It is winning more transactions at lower average value, weighted toward smaller handheld equipment.
What percentage of OPE purchases happen online vs. in-store?
According to OpenBrand’s Q1 2026 data, in-store purchases continue to dominate at 69%, while online accounts for 31% of sales. The split held essentially flat from Q4, suggesting the channel shift has plateaued.
Who is the typical Outdoor Power Equipment buyer?
Based on OpenBrand’s Q1 2026 consumer tracking survey, the typical OPE buyer is a homeowner (72%), married (54%), and male (70%). Millennials represent the largest generational segment at 34% of purchases, followed by Gen X at 27%.
What drives consumers to choose a specific retailer for OPE purchases?
According to OpenBrand’s Q1 2026 data, competitive price is the top driver, cited by 45% of shoppers, down from 51% in Q4. This is followed by good product selection (29%), convenient location (22%), and prior store experience (18%).
Where did Ryobi’s Q1 2026 shoppers go?
According to OpenBrand’s Q1 2026 data, Ryobi’s unit share fell 2.3 pts to 21.3% and its walk rate reached 32%. Black & Decker won 15% of its lost shoppers, Ego 13%, and DEWALT 9%, indicating the leakage moved toward premium battery platforms and professional-grade brands rather than toward lower-priced alternatives.
Where can I access the full OPE market share data?
OpenBrand’s public OPE MarketSignal dashboard is free and covers brand share trends over time, draw and close rates, pricing and promotions, and consumer demographics. Contact OpenBrand for current and historical market share data beyond the quarterly snapshot.
