


The Consumer Electronics market evolved at unprecedented speed in 2025, reshaping how consumers research, shop, and decide which brands earn their trust. Innovation cycles are shorter, price sensitivity is higher, and differentiation increasingly depends on real value rather than feature overload.
In the Computing / Personal Computer market sector, innovation is being driven by AI-enabled PCs, longer battery life through energy-efficient designs, and ecosystems that connect devices, software, and services into a single experience. While big-box retailers and national chains remain critical for Computing purchases, e-commerce marketplaces and brand-direct channels continue to gain influence, reshaping how share is won and defended across the category.
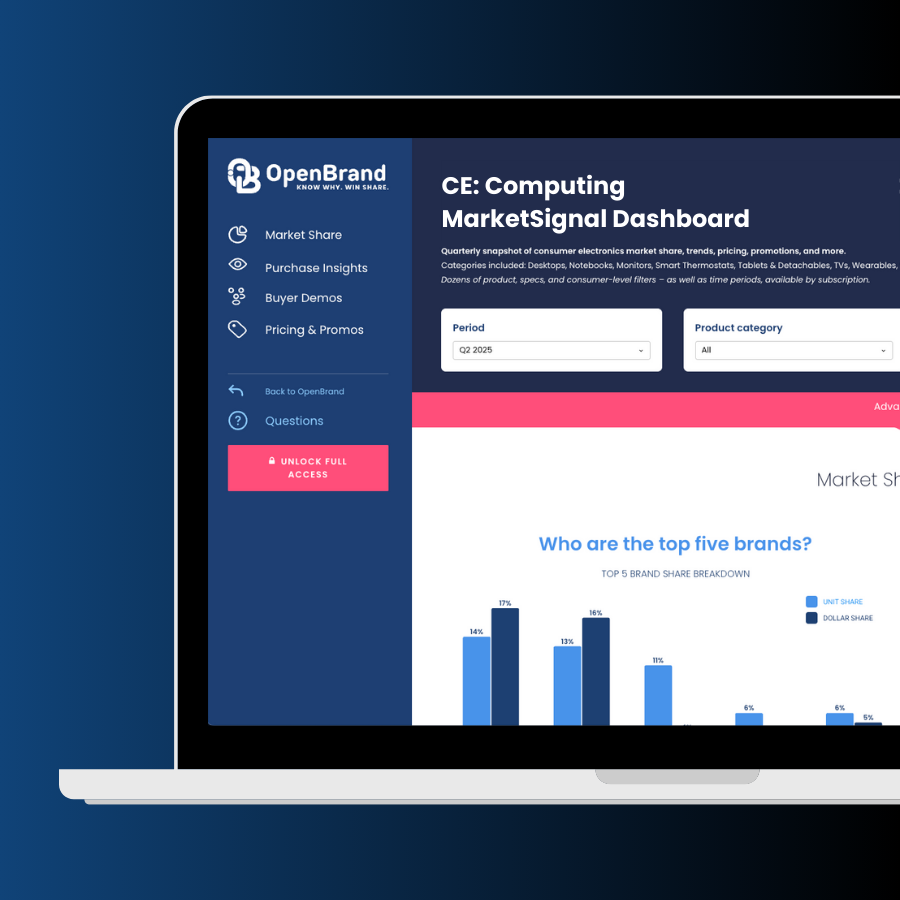
Our public MarketSignal Computing dashboard brings these shifts into focus, offering an interactive view of retailer performance, brand share, pricing trends, and consumer behavior.
Explore the latest insights or dive into the dashboard to see how the market is moving.
Category Grouping Note: All data insights in this article reflect Q3 2025 data from an OpenBrand aggregate category that includes Desktops, Notebooks, Monitors, Tablets & Detachables & Wireless Routers
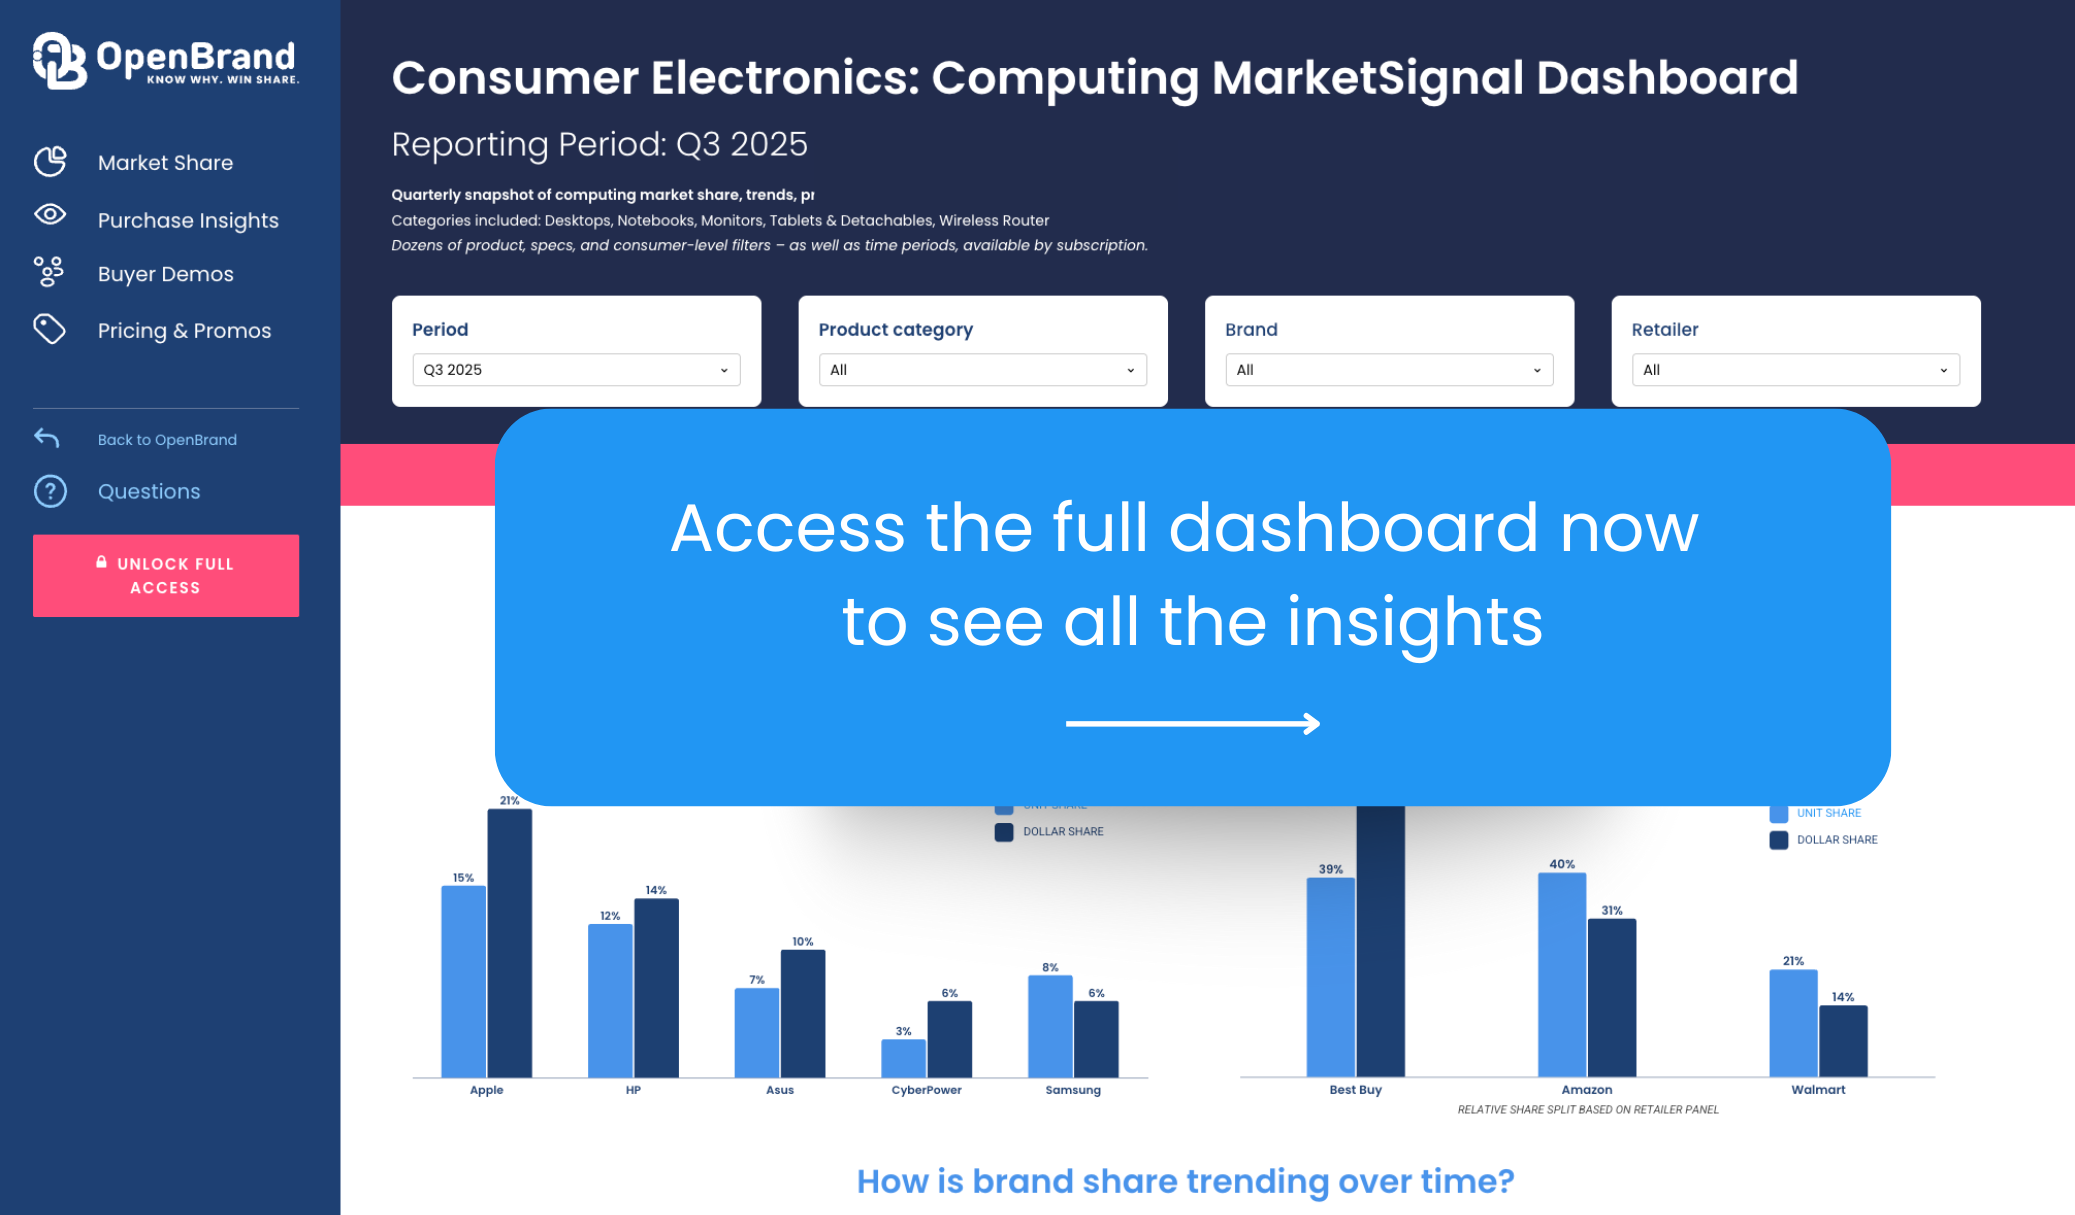
Who are the top retailers for Personal Computer market share?
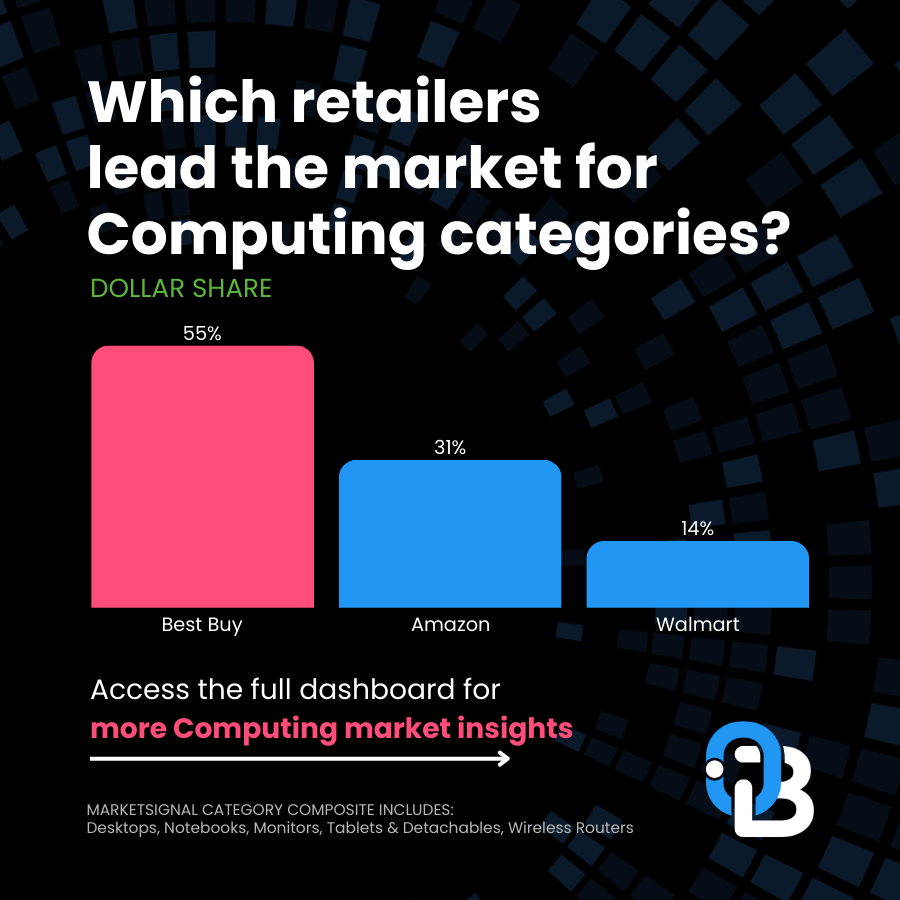
The top retailers for Computing purchases are Best Buy and Amazon – across categories including Desktops, Notebooks, Monitors, Tablets & Detachables & Wireless Routers. Best Buy and Amazon lead in most dollars earned and most units sold, respectively.
Q3 2025 Computing Retailer Dollar Share Winners
| Computing Retailer | Q3 2025 Dollar Share |
| Best Buy | 55% |
| Amazon | 31% |
| Walmart | 14% |
Q3 2025 Computing Retailer Unit Share Winners
| Computing Retailer | Q3 2025 Unit Share |
| Amazon | 40% |
| Best Buy | 39% |
| Walmart | 21% |
Note: OpenBrand’s share split is based on our retailer panel, which currently consists of Home Depot, Lowe’s, Amazon, Walmart, and Best Buy. Retailers with >1% share are not shown. More retailers are coming soon.
Q3 2025 Computing Retailer Draw Rates
Our top market leaders also continue to lead in outlet draw rate, with:
- Amazon and Best Buy tie for draw, bringing in 33% of all Computing shoppers
- Walmart follows, drawing in 28% of shoppers
Among these top three retailers, Walmart and Best Buy also tie for close rate, winning 67% of the shoppers they bring in.
OpenBrand’s Computing Trend Insights
Amazon leads Computing sales for most units sold – but not by any landslide: Amazon takes Best Buy’s place as leading retailer by unit share, winning just 1% more of the market. However, Amazon falls behind Best Buy nearly 20 percentage points when looking at dollars earned. This means Amazon is moving nearly as much product, but at a much lower average price.
Apple makes the sale – but struggles in draw rate: Apple closes the most Computing shoppers at 75% but only draws in 11% of all shoppers. If Apple stores could draw in more shoppers, with a close rate that beats out even our leading retailers, they could bring in far more share by increasing draw rate.
Who leads the Computing market share by brand?: Apple Market Share Wins & More
The top Computing brand is Apple, leading in both unit and dollar share.
Q3 2025 Computing Brand Dollar Share
| Computing Brand | Q3 2025 Dollar Share |
| Apple | 21% |
| HP | 14% |
| ASUS | 10% |
| CyberPower | 6% |
| Samsung | 6% |
Q3 2025 Computing Brand Unit Share
| Computing Brand | Q3 2025 Unit Share |
| Apple | 15% |
| HP | 12% |
| Asus | 7% |
| CyberPower | 3% |
| Samsung | 8% |

For more brand share insights, including data on these share trends over time, access our public Consumer Electronics: Computing dashboard now.
Computing Brand Consideration Rates
When purchasing Desktops, Monitors, Notebooks, Tablets & Detachables, and Wireless Routers, consumers consider the following brands most often:
- Apple – 25%
- HP – 25%
- Dell – 25%
- Samsung – 13%
- Lenovo – 12%
- Kindle – 4%
OpenBrand’s Computing Trend Insights
Apple remains the top seller for Computing: Apple’s winning close rate of 70% helps it hold the spot as top brand across Computing. An equal number of consumers consider HP, Samsung, and Apple as a brand when purchasing Computing products, but Apple closes more shoppers (more than 7 percentage point difference), contributing to the brand’s place as unit and dollar share leader.
Lenovo products are often considered, but purchased at a far lower rate: Lenovo nearly matched Samsung in consideration rate, but lower close rate drops it out of top brands. At 12% brand consideration rate, Lenovo nearly matches Samsung’s 13%. However, with nearly 10 ppt difference in close rate, Lenovo (52% close) does not make it into the top 5 brands.
Explore the drivers and promotions data that may contribute to low conversion rates in our quarterly Consumer Electronics: Computing MarketSignal dashboard.
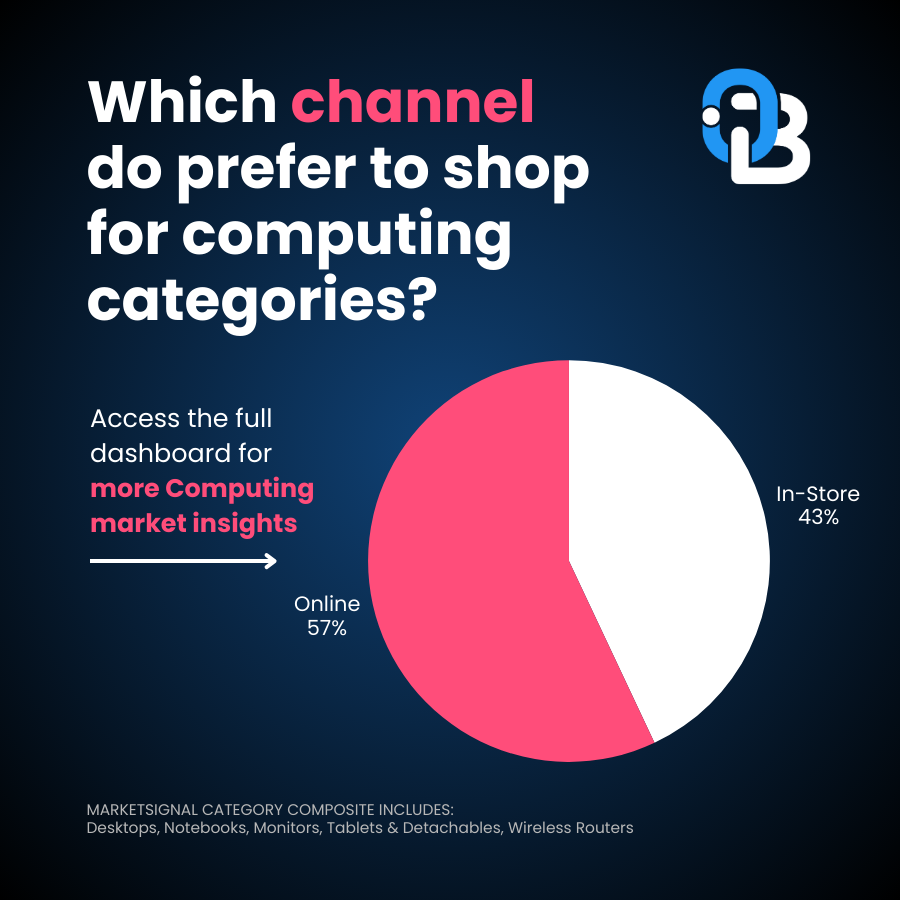
How are online and in-store sales trending for the Consumer Electronics market?
In Q3 2025, the majority of Computing sales were made online.
- In-store: 43% of purchases
- Online: 57% of purchases
OpenBrand’s Computing Trend Insights
Computing shoppers lean more toward online purchases than other Durable Goods markets. Unlike other Durable Goods markets (such as Power Tools), online sales take over half the market. This highlights a significant difference in how Consumer Electronics shoppers are making purchases versus other markets. The online channel is critically important for electronics retailers and brands.
Computing Consumer Demographics
Who is shopping most for Desktops, Monitors, Notebooks, Tablets & Detachables, and Wireless Routers? OpenBrand illustrates the typical buyer using survey results from our long-standing and census-balanced consumer durables tracking survey.
As of Q3 2025, Computing consumers showed the following traits:
- 63% of purchasers are homeowners, 33% rent
- 46% of purchasers are married
- 57% of purchases made were with males in the buying process; 43% were made with females involved
- 30% of purchases were made by Millennials, making up the biggest segment of shoppers, with Gen X buyers (26%) and Baby Boomers (23%) next. Want to see where Gen Z falls?
Purchase Drivers for Computing Products
The most frequently mentioned reasons for purchasing Computing products at a specific retailer were:
Why consumers select a specific retailer
- Competitive price — 58%
- Good selection of products — 34%
- Previous experience with store — 23%
- Convenient location — 16%
Get more Consumer Electronics: Computing market share trends
The market insights don’t stop here. For more retail sales data, market share, and insights on the Computing industry, access the Consumer Electronics: Computing MarketSignal dashboard now.
To see insights for other industries or find out how we can help power growth for your business, contact us today.