


Unit & Dollar Market Share

Trend & Period Comparison

SKU-Level & Feature Insights

Unmasked Retailer Data

Line Review Evidence

Independent Validation
SHARE, UNMASKED
Know where you're losing share, and who's taking it
Most traditional market share providers stop at the channel level. It shows the point you lost, but not the retailer where it moved, the SKU that took it, or the house-brand and low-distribution competitors it never counted in the first place. MarketShare models share down to the individual retailer and SKU, so the number you report is also a number you can act on.
You can't see how you performed at each individual retailer
Retail POS and syndicated providers report share in broad channel groupings that can hide retailer-specific performance and low-distribution or house-brand SKUs. Modeled market share breaks that open.
You can't validate the share number you already have
You have one number and no way to check it. When a retailer, a competitor, or your own leadership disputes it, a single source leaves you nothing to defend it with, and no read at all in the categories where retailers don’t report.
You can't tell which retailer, brand, or SKU drove the shift
Share shifts become decisions when you can see which retailer, brand, or SKU drove them — and, paired with pricing, promotion, and consumer signals, why.
You can’t tell a slow cycle from a real decline
Durables sell on multi-year replacement cycles, and seasonal categories go quiet for months at a time. In a tool built for weekly purchase rhythms, a category sitting in the trough of its cycle looks like share you lost.
MarketShare delivers modeled share that pinpoints where the movement actually happened.
Trusted by global brands, retailers, distributors, and suppliers














A Closer Look At OpenBrand's Modeled Market Share
How our share data helps act on market shifts
See exactly how you're performing at each retailer, not just across a channel
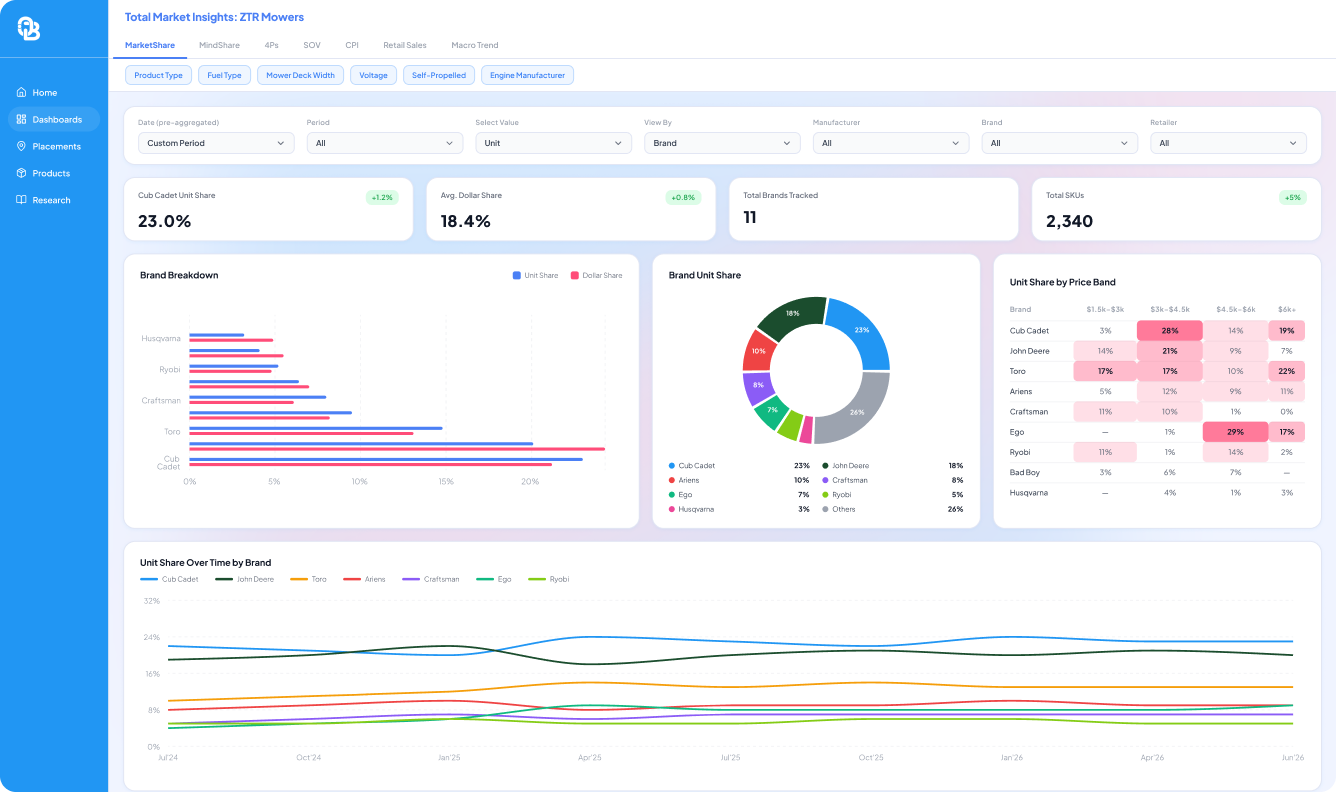
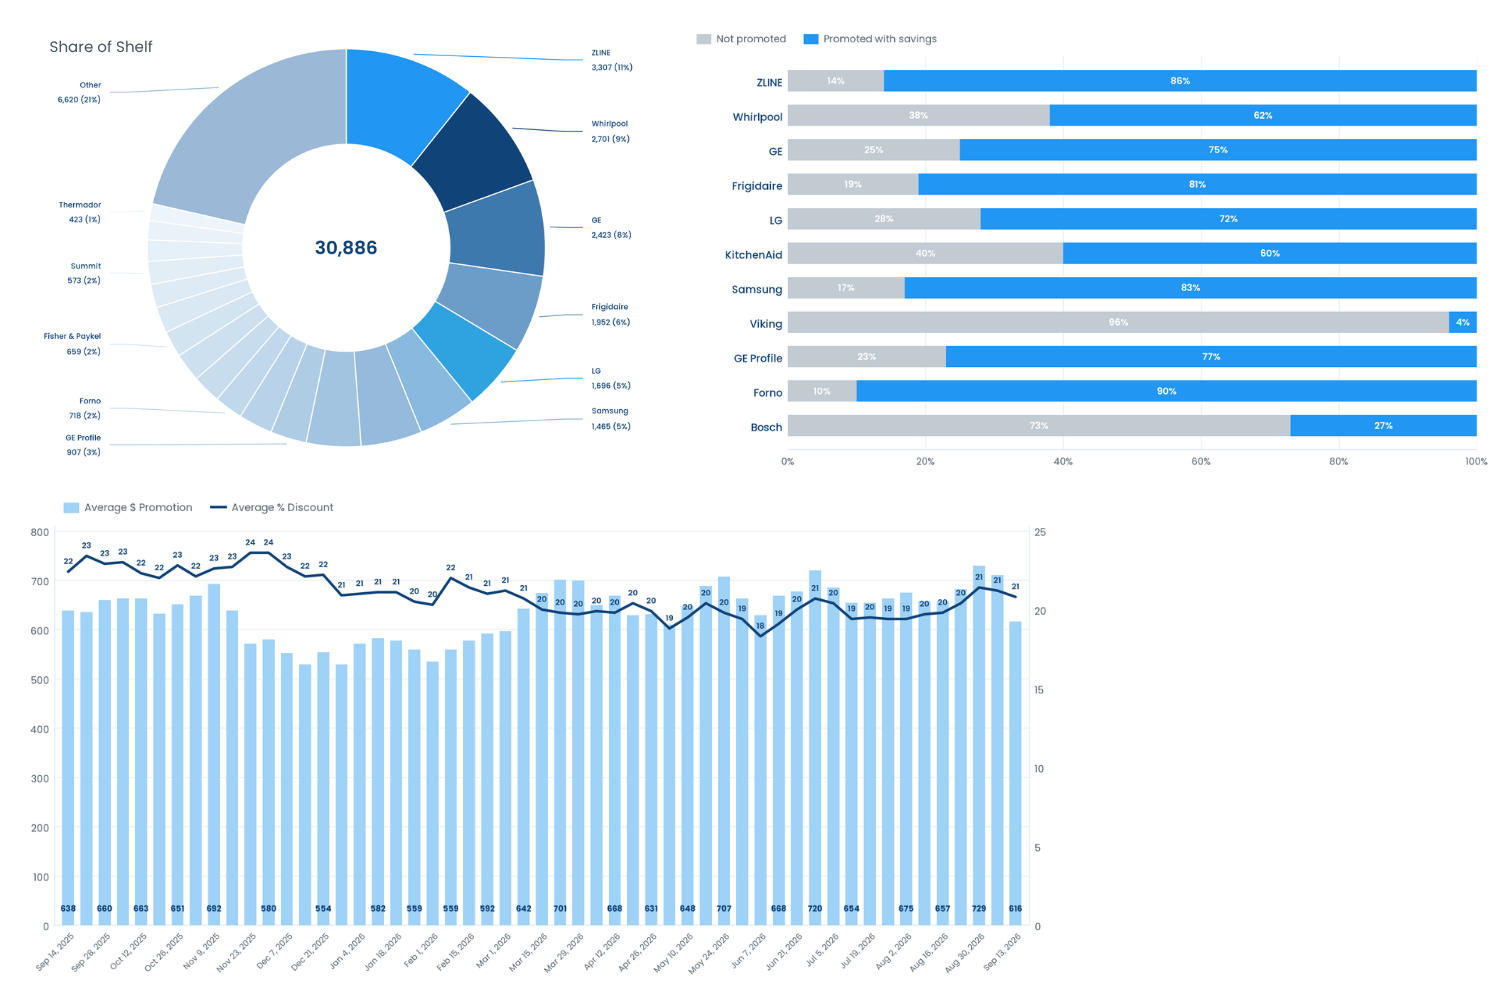
SKU, Configuration, Brand & Retailer-Level Share
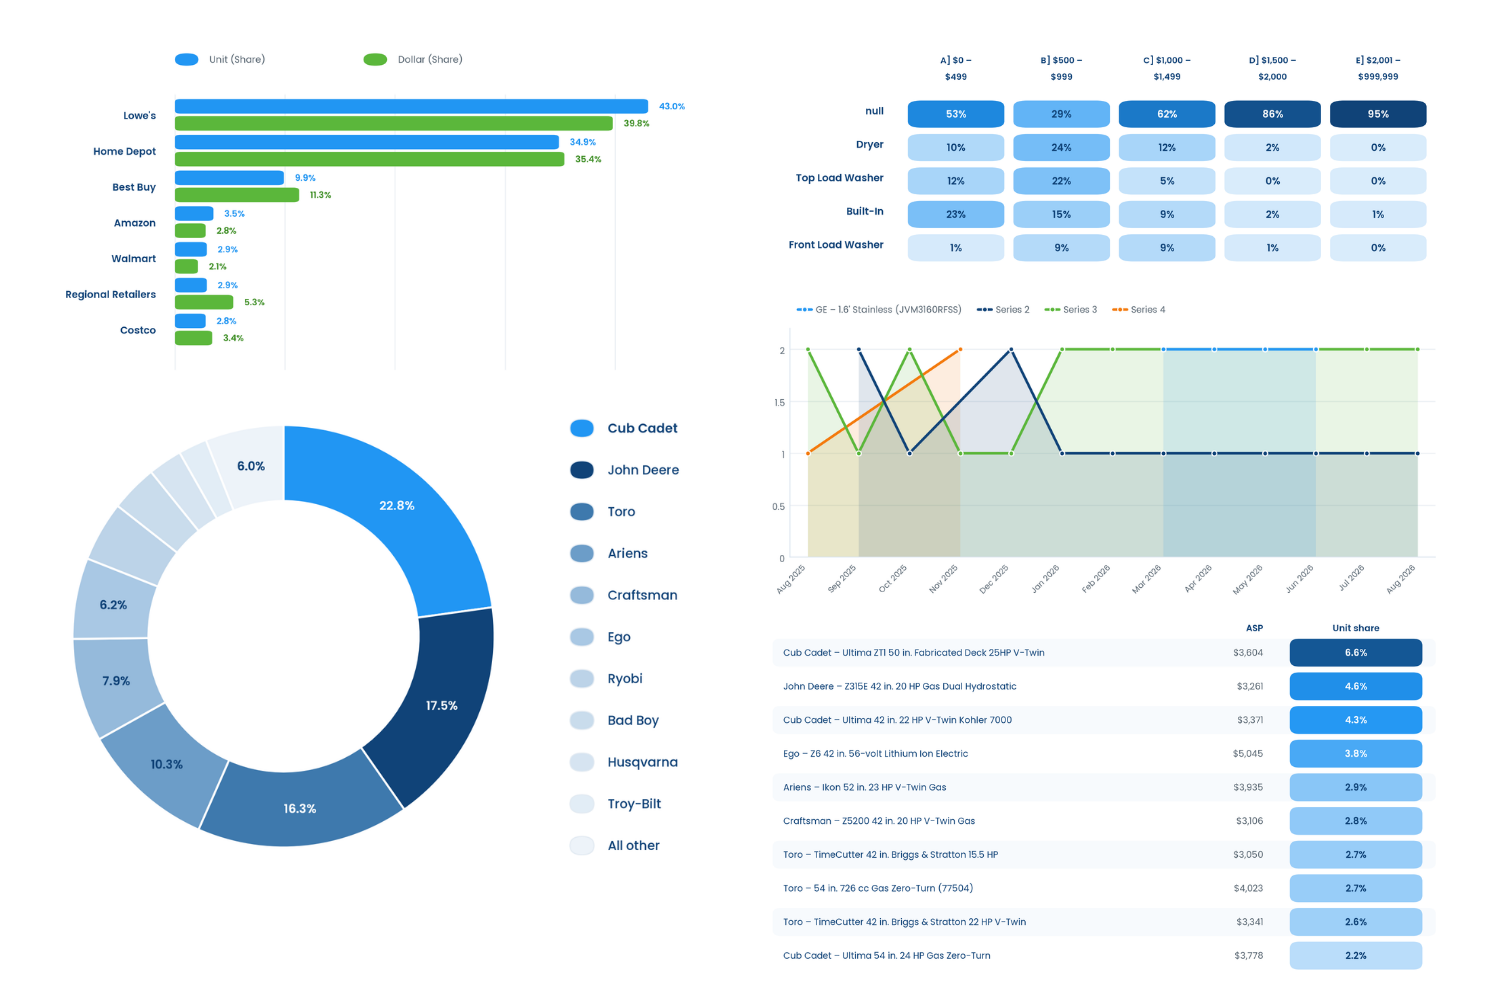
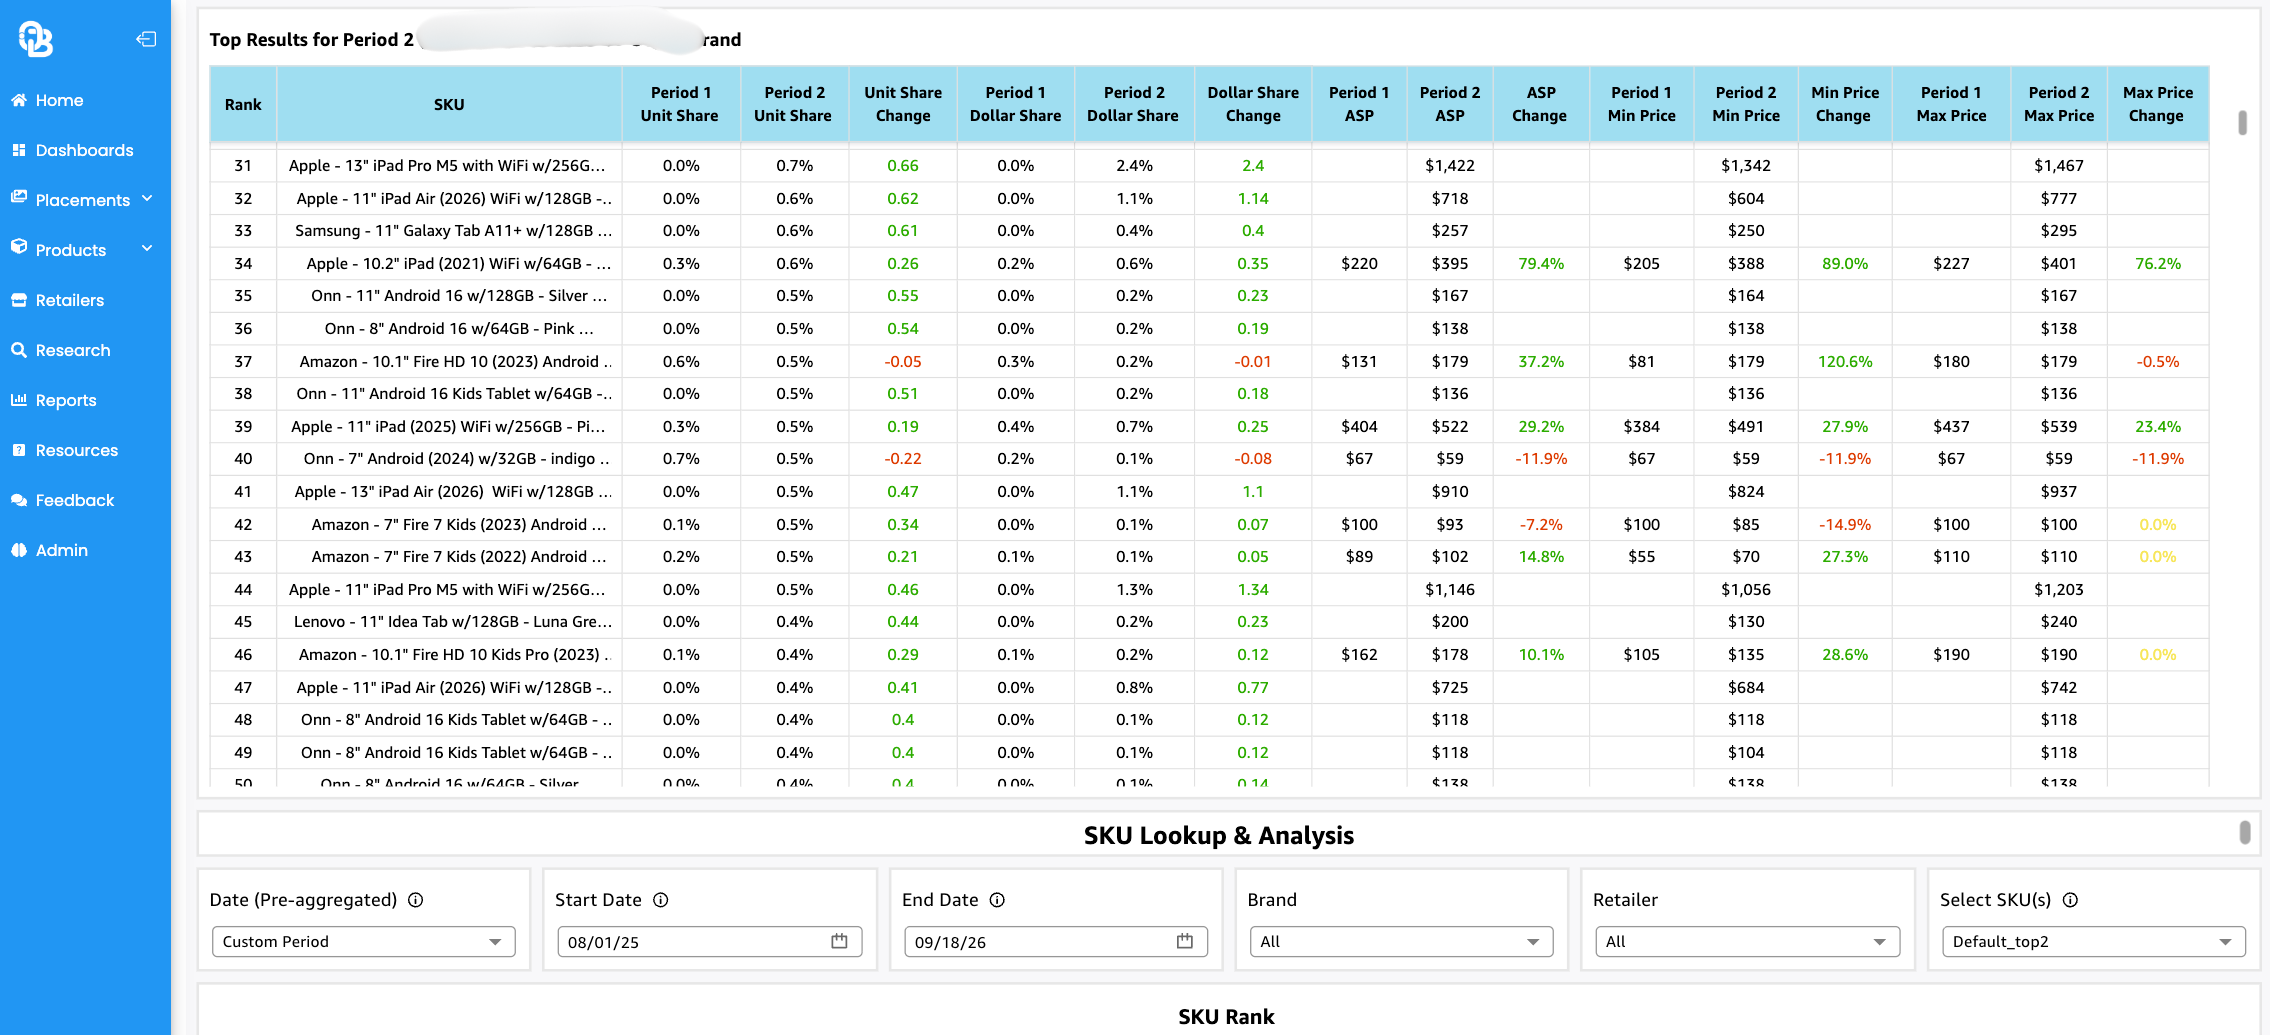
MarketShare reports share at each individual retailer, then drills to the SKU and the configuration beneath it, in both units and dollars. Nothing is rolled up into a blended channel total.
- See share at each individual retailer, not a blended channel
- Surface key SKUs — including retailer house brands — that aggregated data hides
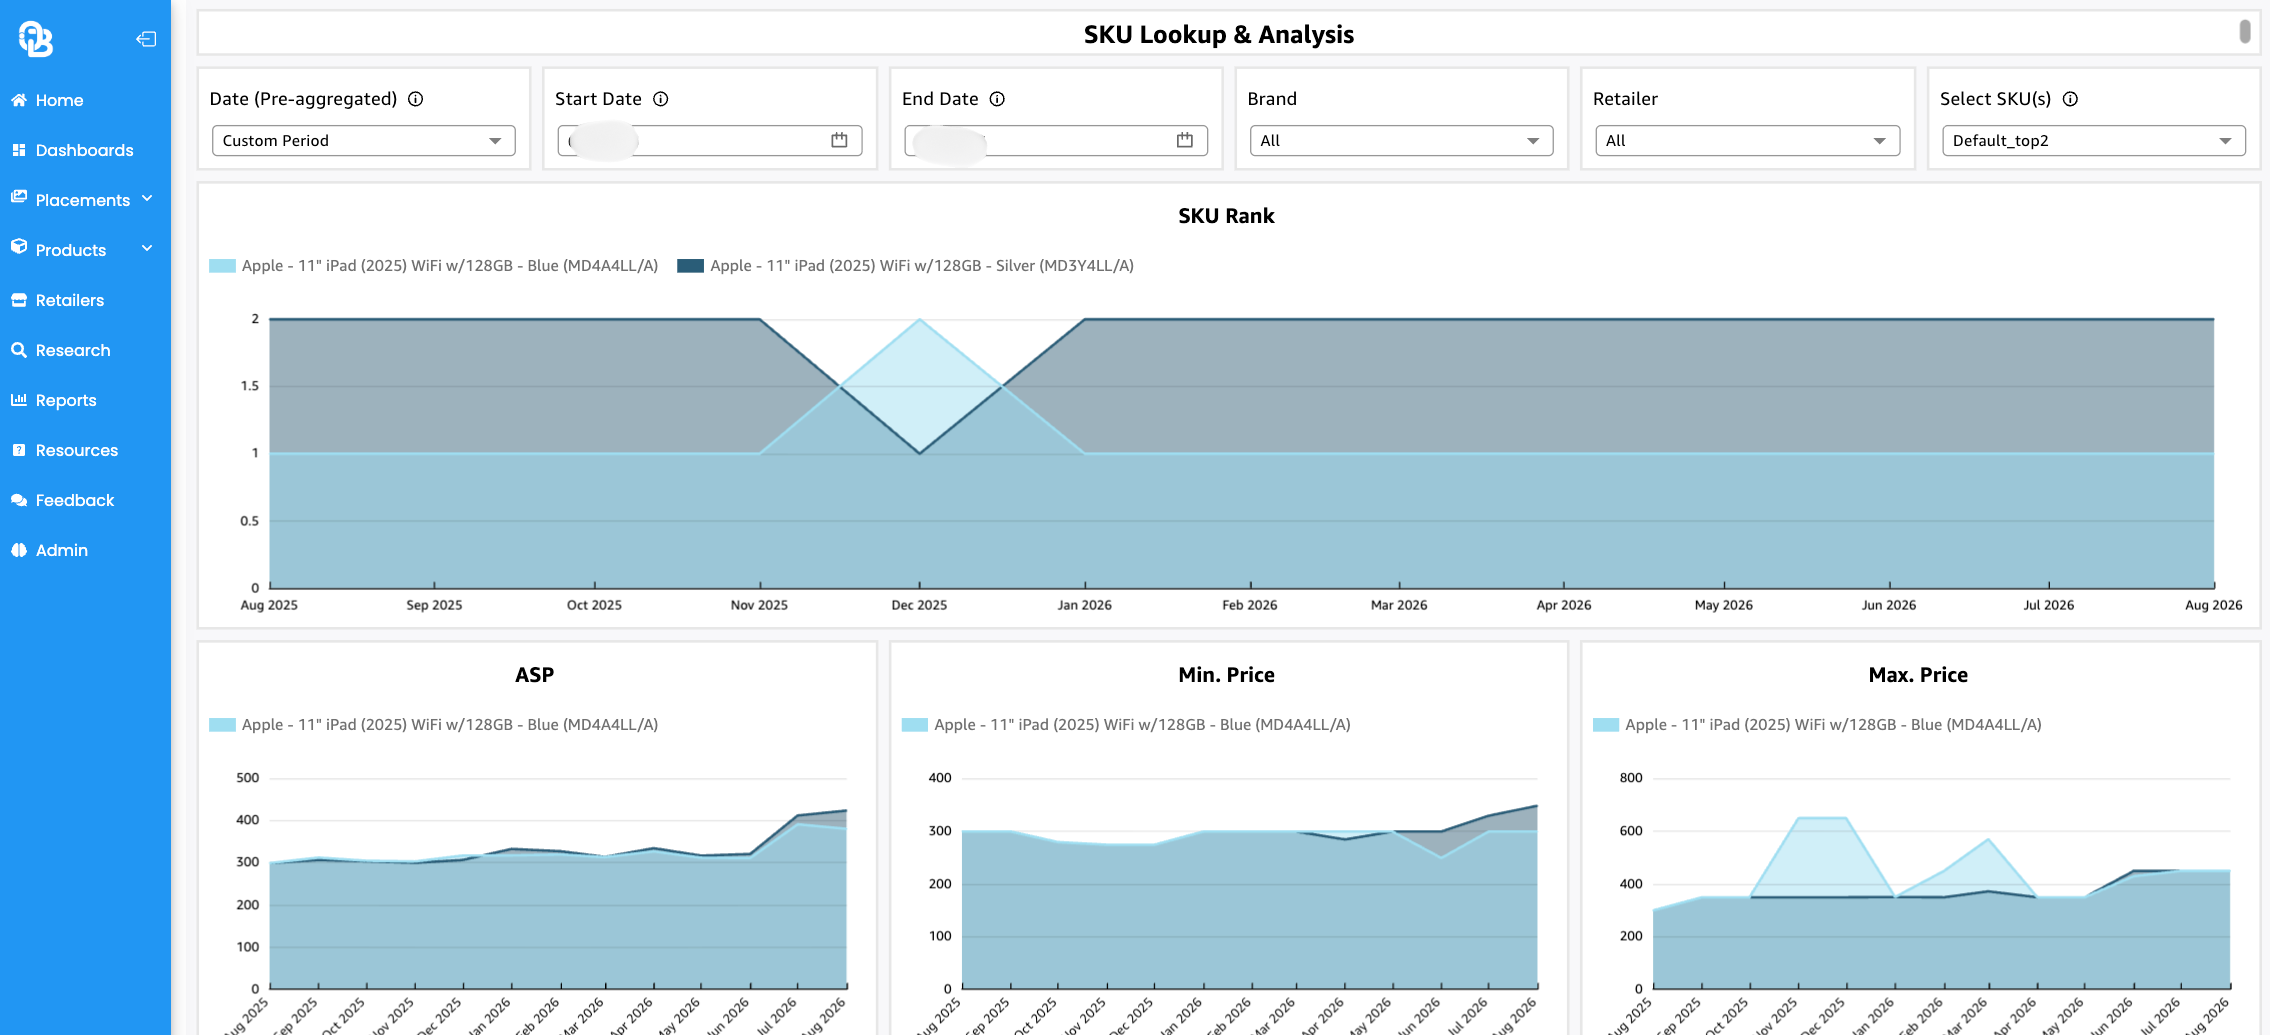
- Track which SKUs are gaining or losing share, and where
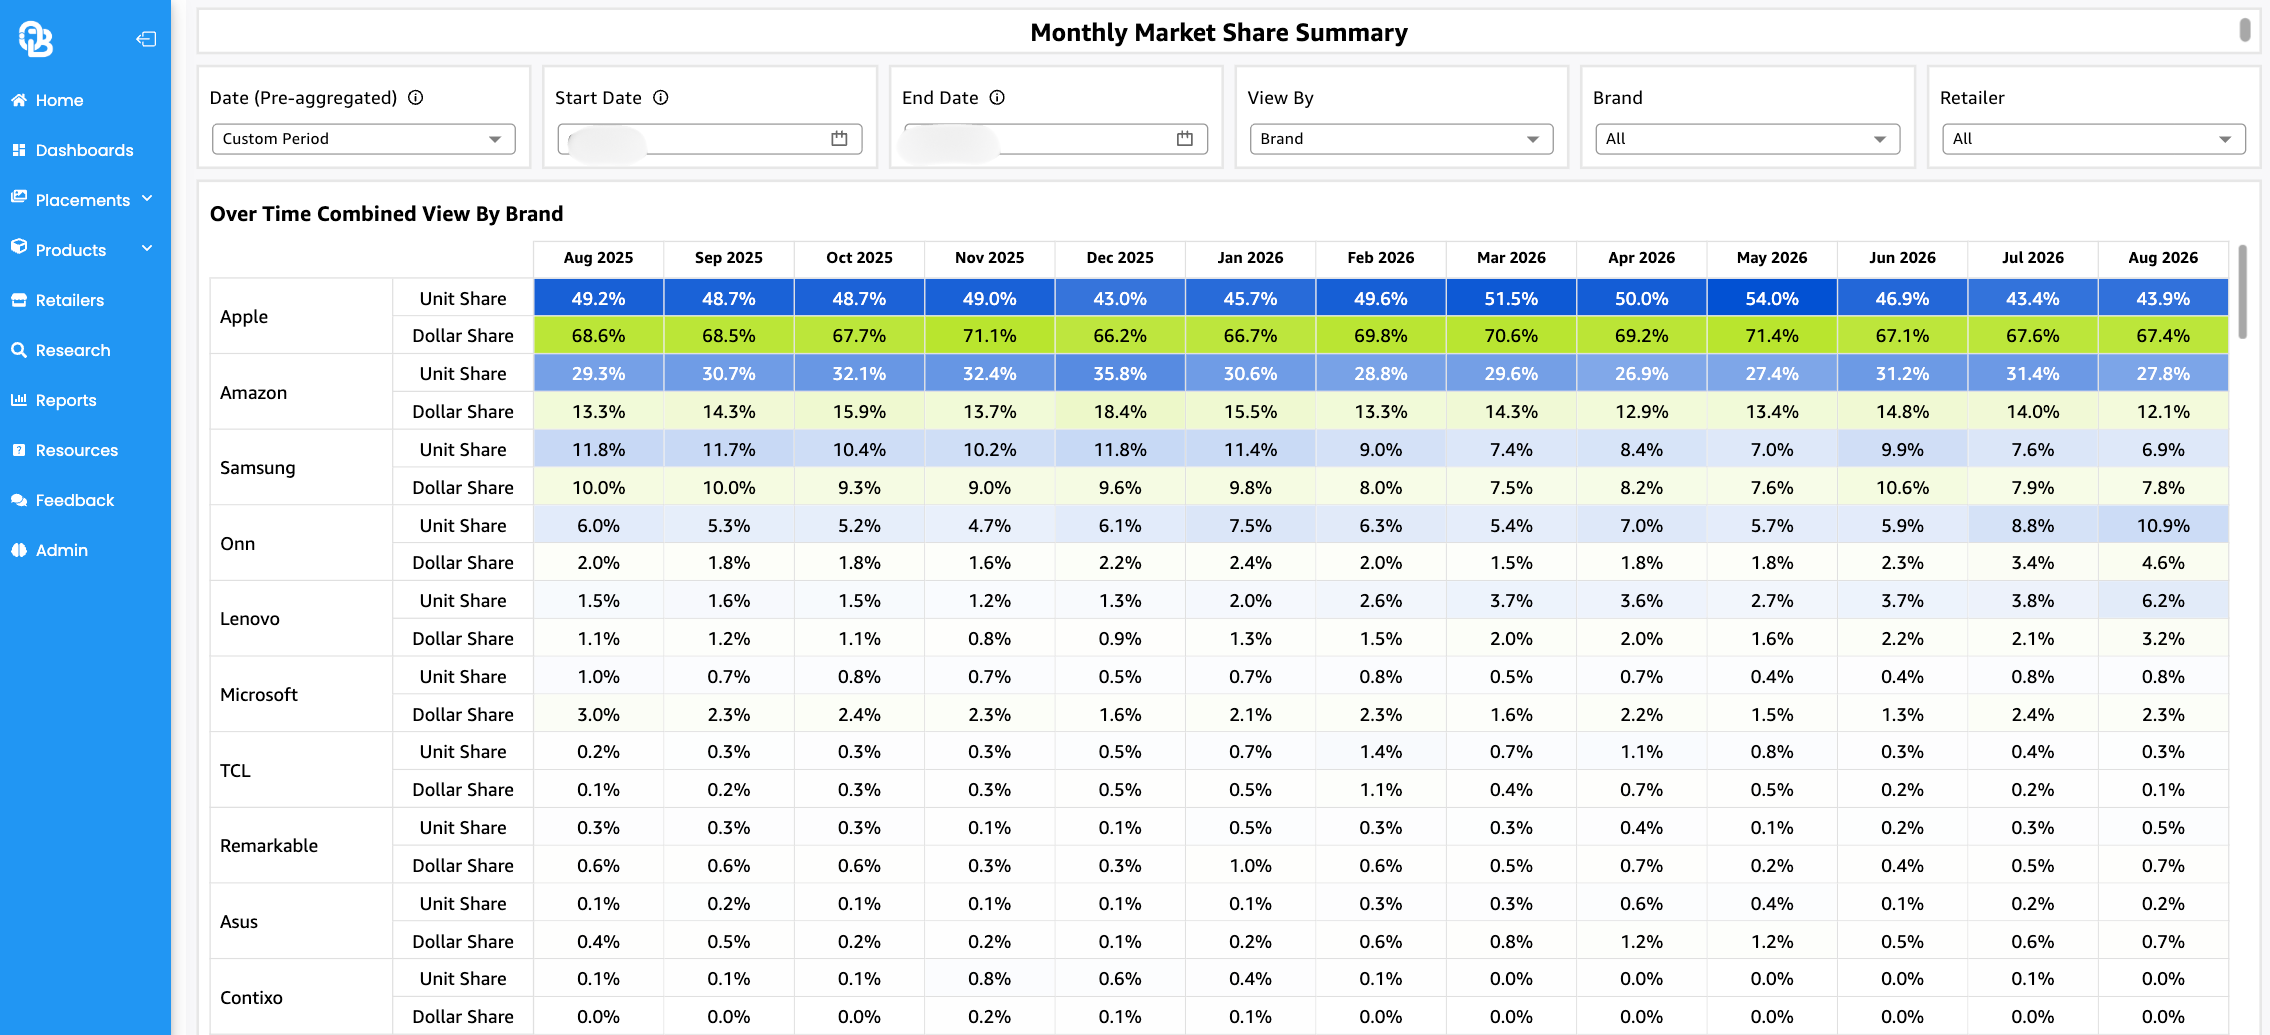
- Compare unit and dollar share side by side, with leaderboards by brand and retailer
- Break share down by configuration, such as battery-powered leaf blowers, not just category totals

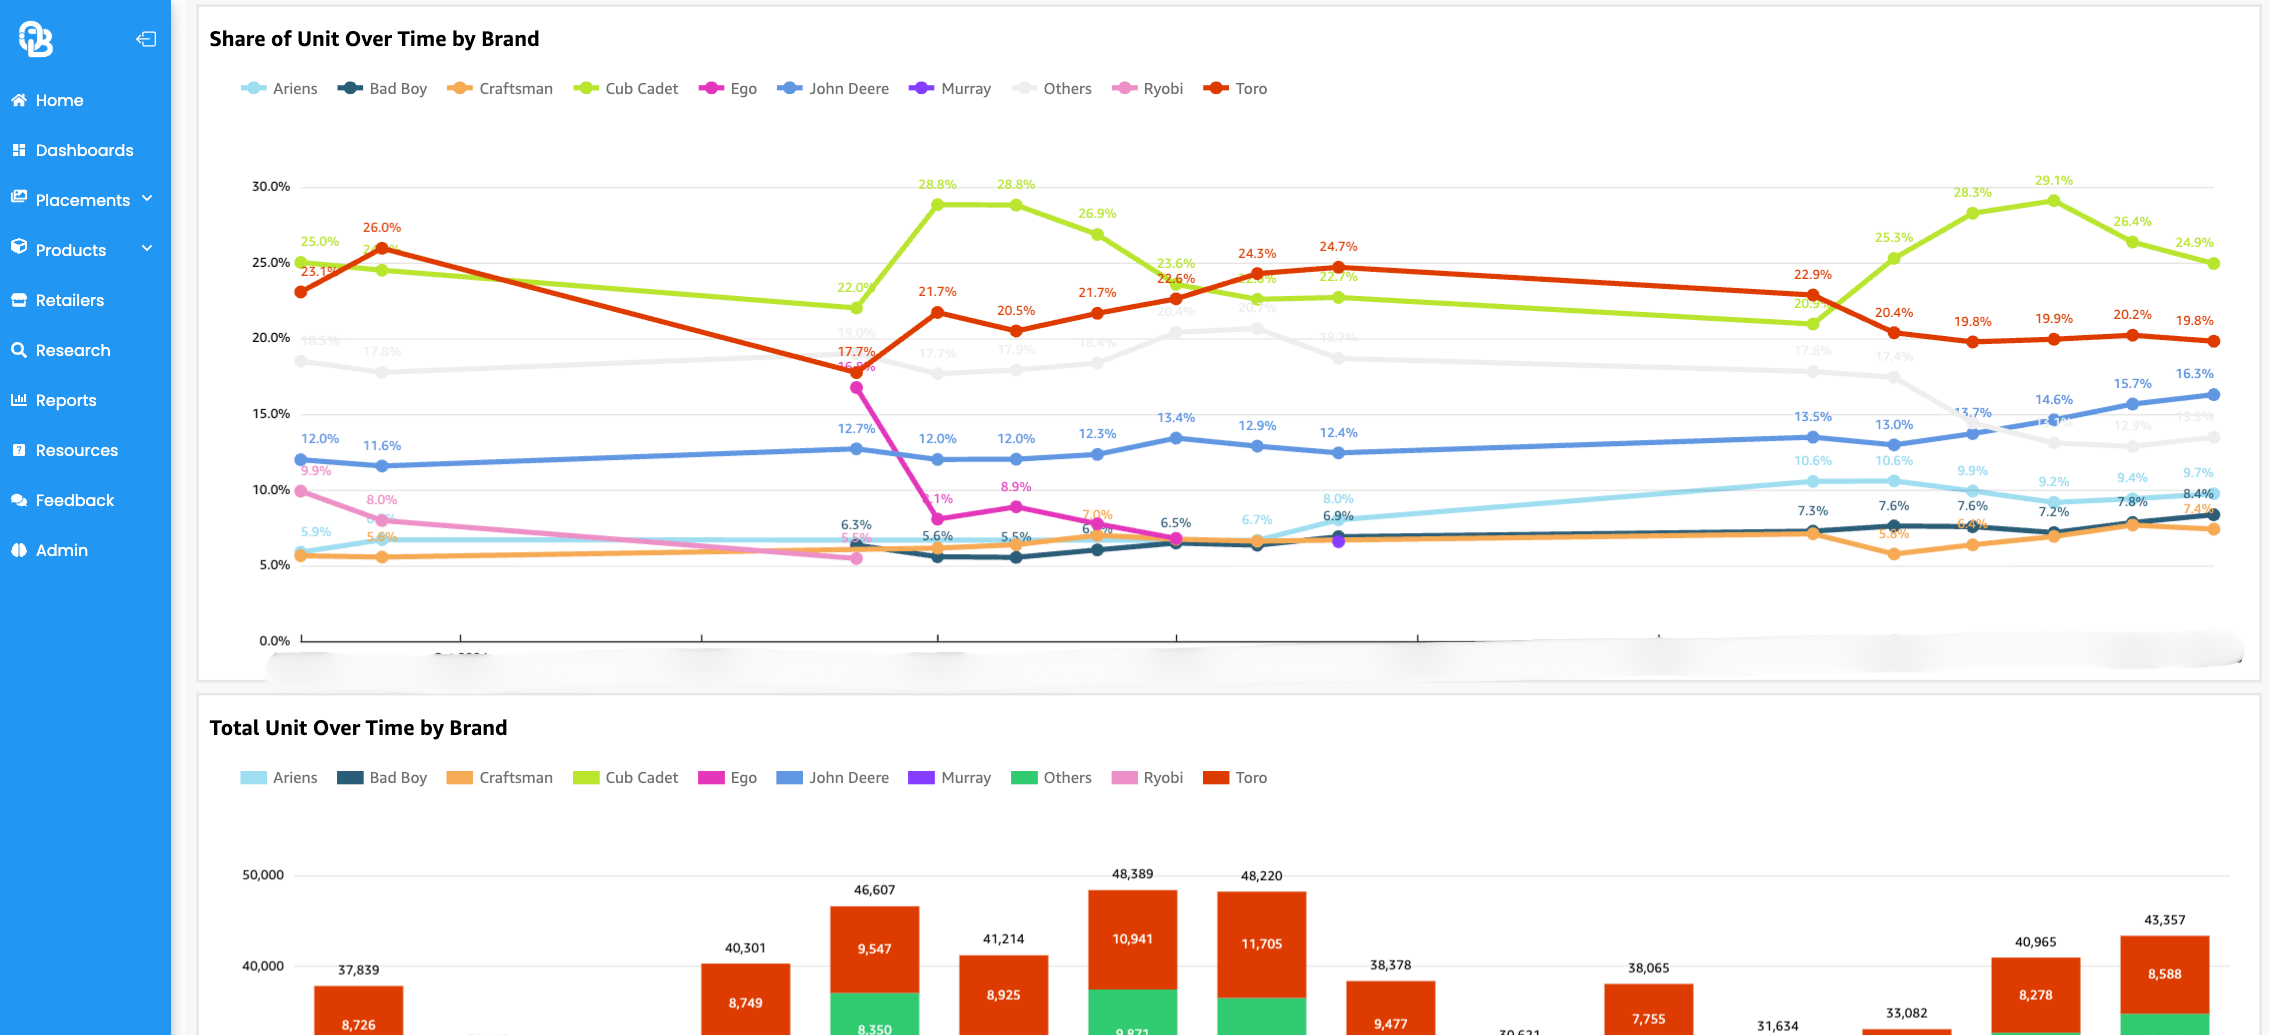
Watch share move over time, and know what changed
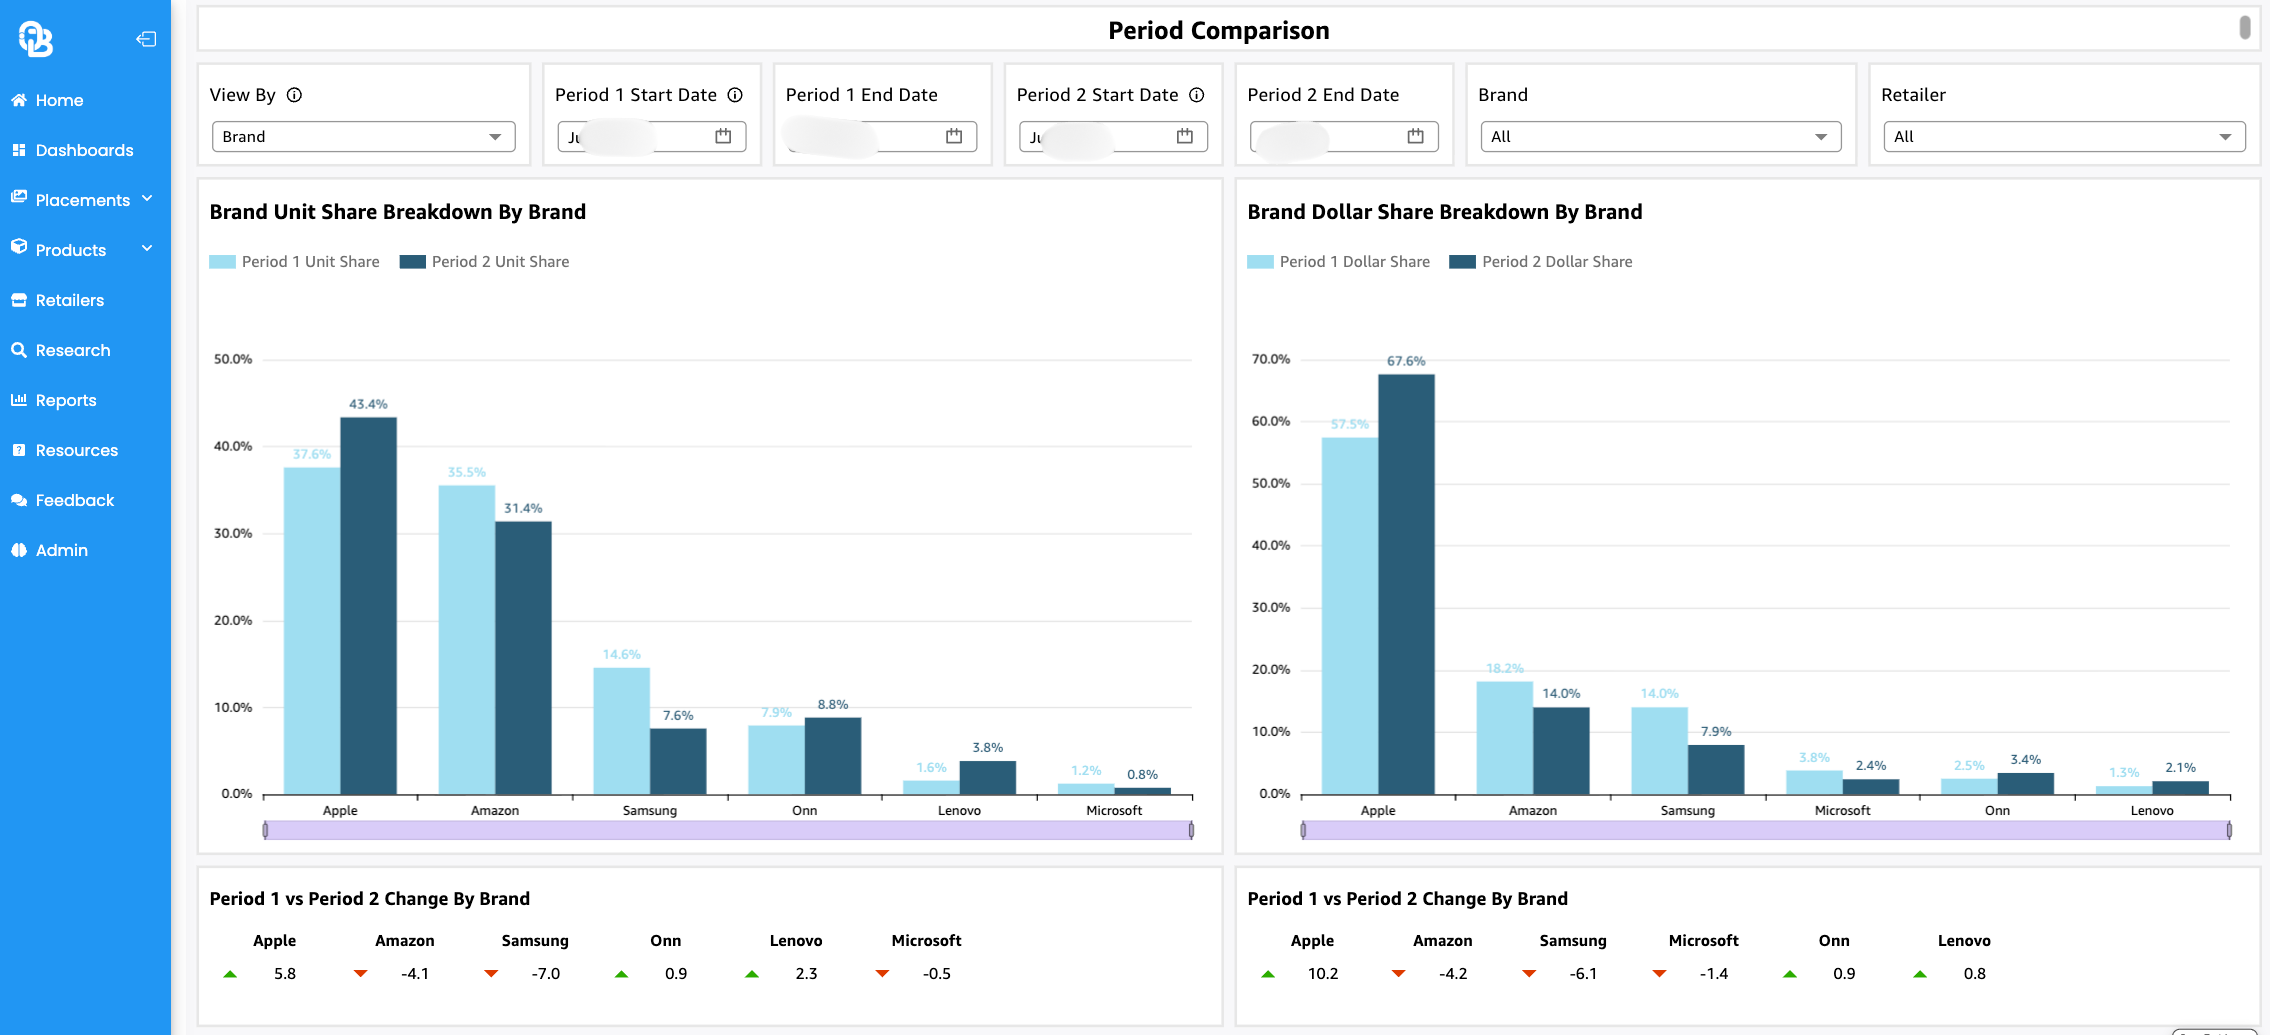
Trend & Period Comparison
Durables move on replacement cycles, not weekly rhythms. Track share month over month, quarter over quarter, and year over year with SKU-level drill-down, so you can tell a genuine competitive shift from a category sitting in the trough of its cycle.
- Compare share across months, quarters, and years
- Drill into the SKUs and retailers driving a shift
- Use historical trend to separate a blip from a pattern
- Work from up to four years of history, refreshed monthly
See what moved your share, not just that it moved
Assortment & Pricing Context
Share movement without a cause is a report, not a decision. MarketShare sits alongside OpenBrand pricing, promotion, and product data, so you can see how a competitor’s assortment change or price move shows up in the share they took.
- See how competitive assortment changes affect share at each retailer
- Tie share shifts to competitor pricing and promotion activity
- Spot assortment gaps and whitespace ahead of a line review
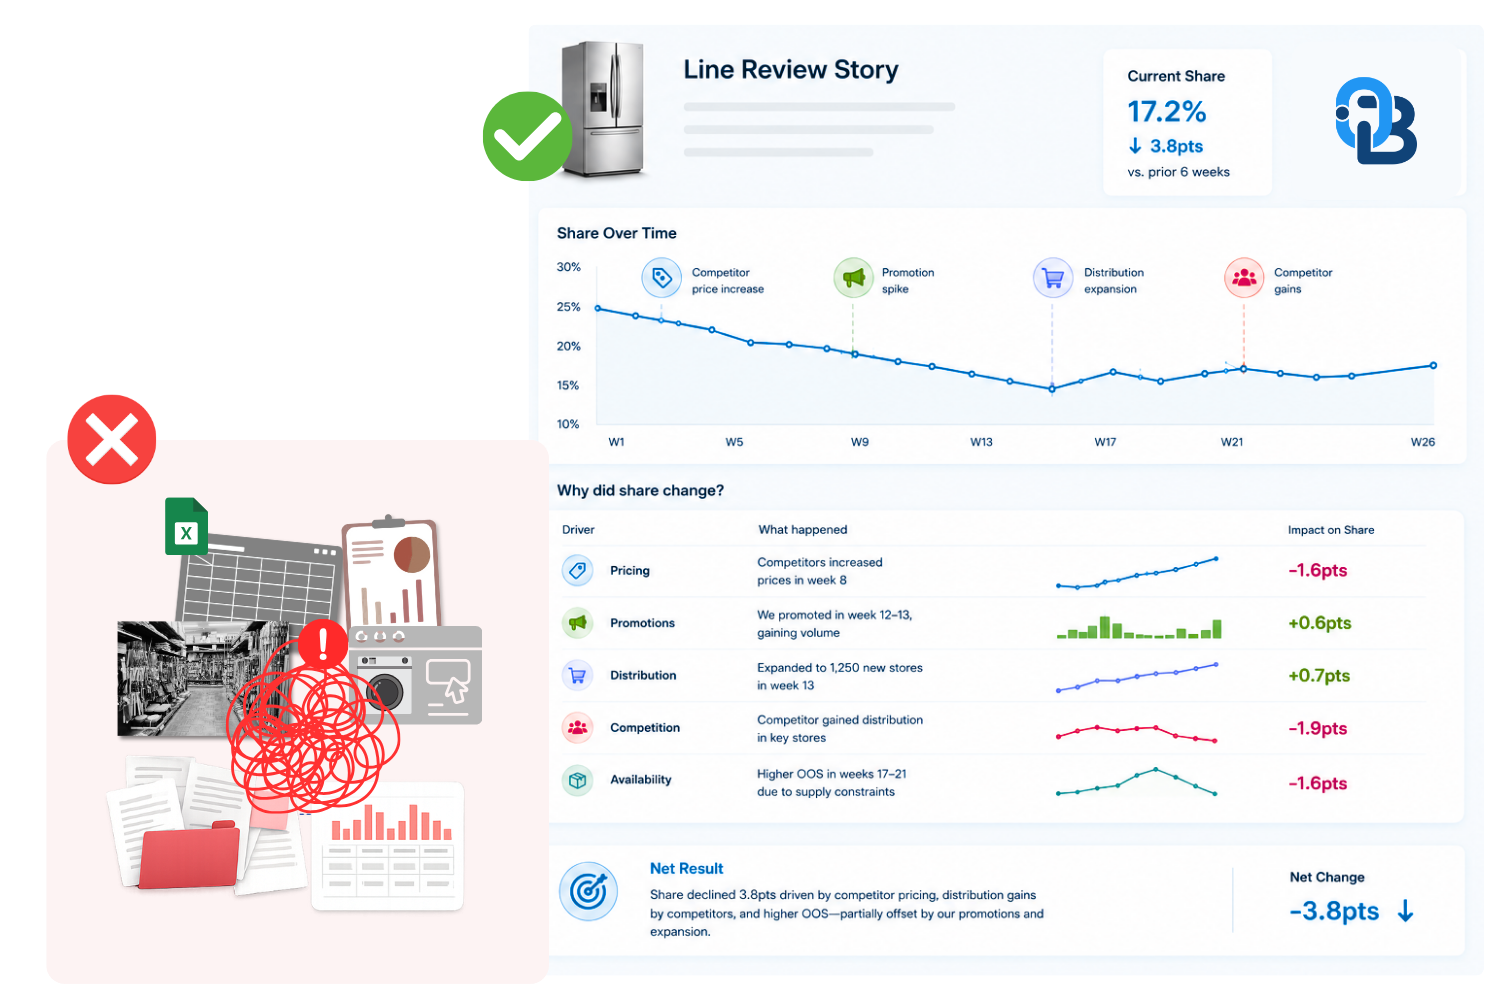
Walk into your next line review with retailer-specific proof
Retailer & Account Evidence
A category total doesn’t hold up in a retailer negotiation. MarketShare gives you retailer-specific performance built for line reviews, assortment calls, and account conversations.
- Bring retailer-specific share evidence to line reviews and negotiations
- Support assortment and SKU rationalization decisions
- Track competitor SKU moves at the retailer level
Check your numbers against an independent source
Independent Validation
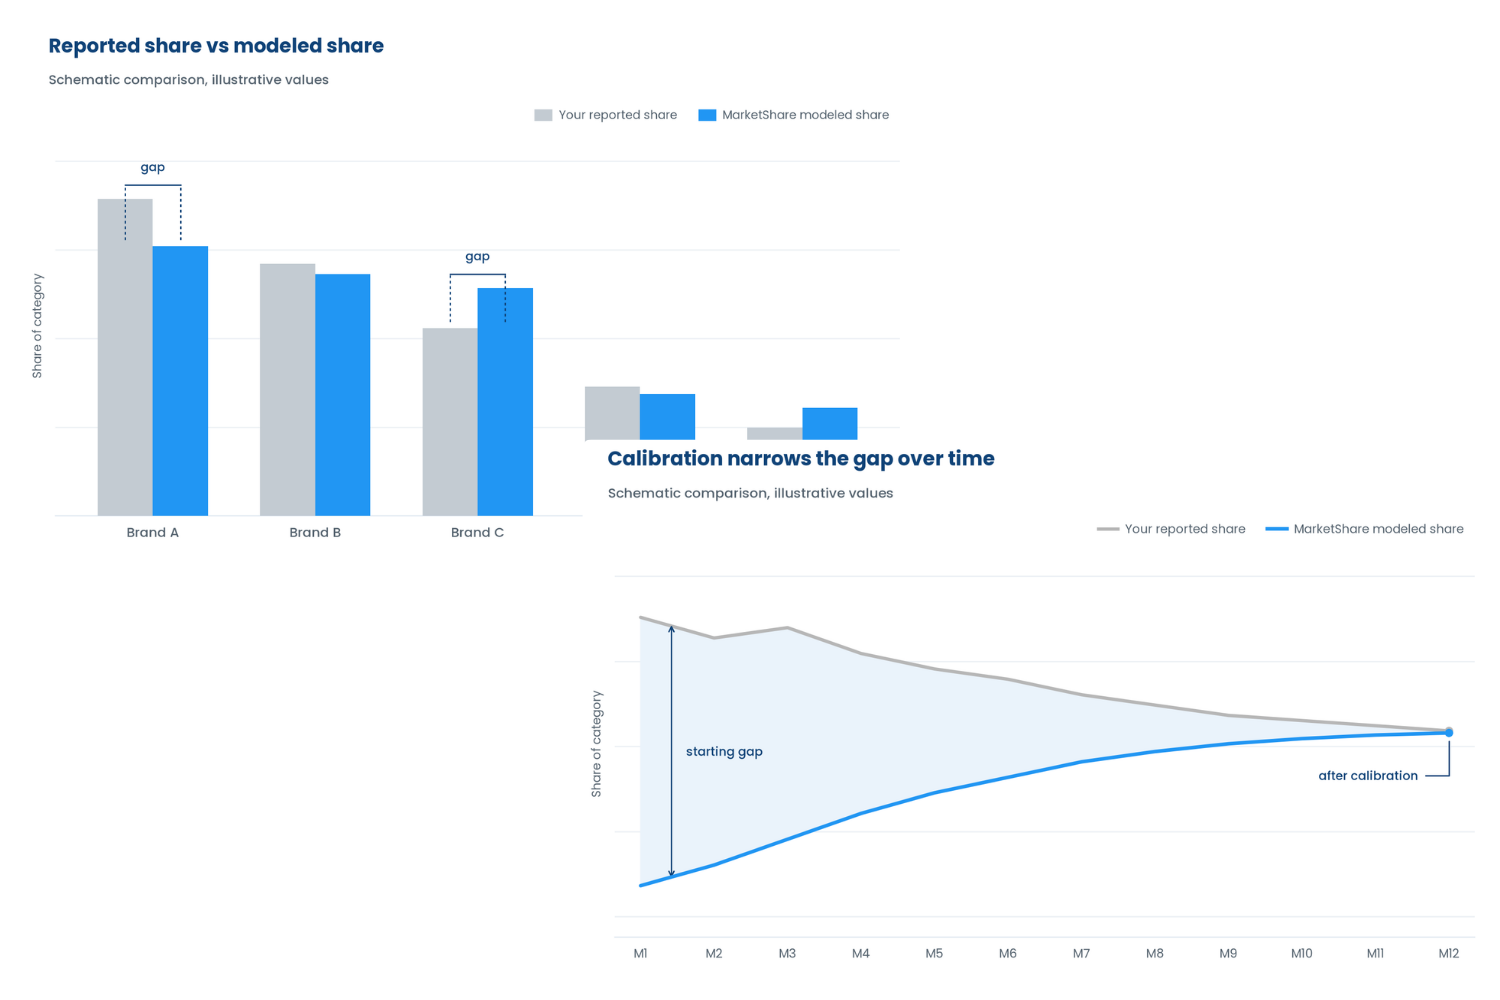
Whether you already buy POS or syndicated data or have no external read at all, MarketShare gives you a calibrated, multi-source view built to hold up against your own numbers.
- Validate existing POS or internal data with an independent read
- Get a primary share view where retailer or syndicated data falls short
- Refine accuracy over time through a calibration process built around your data
Demo Your Durables Market Share
Discover the retailer and SKU detail behind your category's market share
See how modeled share breaks your category down to the retailer and the SKU. Learn which retailer moved, which SKU took the share, how unit and dollar share compare, and which competitors your current data never counted.
Schedule now!

BUILT FOR DURABLES
Why modeled market share is a must-have in durables
Receipt-only providers are biased toward non-durables and can’t account for low-incidence products. Every variable you add shrinks the sample, and long replacement cycles thin it further, so a category sitting in its trough reads as share you lost. MarketShare is modeled around how durables actually sell.
1. Unmasks the share other data hides
Aggregated POS and syndicated data group retailers together, burying retailer-specific performance and low-distribution SKUs. MarketShare shows how SKUs perform at each individual retailer.
2. Built specifically for durable goods
Durable goods purchases are infrequent and complex, and retailers don’t always define categories, models, or variants the same way. Through the integration of six data sources, MarketShare is built for that reality, not adapted from a general retail data source.
3. Calibrated with brand and retailer feedback
MarketShare is calibrated with brand and retailer feedback over time, so it works as a second source to check your numbers, or a primary read where you don’t have one.
4. Turns share into a decision, not just a data point
Retailer-specific, SKU-level share only matters when you can act on it. MarketShare is built to go into a line review, an assortment call, or a negotiation as evidence.
Our data sources

WHY OPENBRAND FOR MODELED MARKET SHARE
Still relying on data built for CPG, not durable goods?
Most market share providers are built around frequent, lower-ticket CPG purchases, then stretched to fit durable goods. MarketShare is built for durable goods from the ground up, down to the SKU and the retailer.

| Other Market Share Providers | → | OpenBrand's Modeled Market Share |
| Built for frequent, lower-ticket CPG purchases | → | Built specifically for durable goods |
| Groups retailers together into broad channel totals | → | Reports share at each individual major retailer |
| Can mask low-distribution and house-brand SKUs | → | Surfaces the SKUs aggregated data hides |
| A single source that's hard to validate or defend | → | A calibrated, multi-source view built to compliment your own data |
| Leaves you to explain why share moved on your own | → | Ties share movement to the pricing, promotion, and consumer signals behind it |
Who It's For
Built for both sides of the market
For Retailers
Share is a critical part of your category strategy. It won’t tell you what to do next. That takes more: how shoppers choose between you and the store down the road, what competitors are charging, where assortment gaps are opening, and what inflation is doing to demand.
For Brands
Share is a critical part of your brand strategy. It won’t tell you what to do next. That takes more: what consumers considered before they bought, what competitors are charging and promoting, where assortment is shifting, and how pricing pressure is moving your category.
Category Coverage Across the Durables Industry
We cover nearly 80 durable goods product types across the major durables category groups in the US, delivering the depth and breadth that line reviews and assortment decisions require. Coverage is category-specific and grows monthly.
- Consumer Electronics
- Grills & Smokers
- Hardware
- Lawn & Garden
- Kitchen & Bath
- Major Appliances
- Outdoor Power Equipment
- Paint & Stain
- Power Tools
- Small Appliances
Frequently Asked Questions
Category Management, Commercial Strategy, and Insights / Market Intelligence teams own it. Product, Portfolio, Pricing, and Sales teams put it to work in line reviews, assortment decisions, and retailer negotiations.
MarketShare is OpenBrand’s modeled SKU- and retailer-level share layer. It shows who is winning and losing, and where, alongside the consumer “why” from MindShare and the pricing, promotion, and product context from Competitive Intelligence.
No. MarketShare is modeled from a multi-source mosaic — receipt, survey, web, and pricing/spec signals — and calibrated with brand and retailer feedback. It’s an estimate, not a transaction record.
Durables have lower purchase incidence and longer replacement cycles than CPG. MarketShare’s dynamic model weights its inputs differently across high, medium, and low incidence products, and trends share against multi-year replacement cycles rather than weekly rhythms, so a category sitting in the trough of its cycle isn’t misread as lost share.
Receipt panels are biased toward non-durables and cannot account for low-incidence products. Every variable you add shrinks the sample: for one major US retailer in a single month, 6.1 million receipts narrowed to 103 for corded line trimmers, 0.0017% of the sample. OpenBrand uses receipts as one input in a mosaic that also includes a consumer tracking survey, web and clickstream data, in-store collection, and market and economic data, with a dynamic model that weights those inputs by category and by incidence level.
A broad and growing set of major national retailers, including Amazon and Home Depot, plus regional retailers for select categories. Coverage is category-specific and grows monthly — confirm the current list for a specific category before publishing.
Nearly 80 durable goods product types, including Major Appliances, Outdoor Power, Power Tools, Kitchen & Bath, Paint & Stain, Small Appliances, Consumer Electronics, Lawn & Garden, Outdoor Cooking, and Hardware, with more added monthly.
Openbrand releases new durables market share data every month.
Beyond Market Share
Total Market Insights From OpenBrand
No single data source tells the whole story. Modeled market share tells you who’s winning and losing, at which retailer, down to the SKU. Competitive intelligence tells you what competitors are doing on product, pricing, and promotion. MindShare adds the consumer’s voice: what they report buying, what influenced the decision, and why share moved the way it did.
Consumer Insights

Understand the consideration, close, and leakage behavior behind your share with MindShare consumer-reported data
Pricing Data

Accurately monitor product, pricing, promotions, inventory, and media presence in real-time
OpenBrand CPI

Navigate tariff impacts and inflation, with the OpenBrand CPI for Durables and Personal Goods, available monthly
EXPLORE OUR DATA
Public Quarterly Market Dashboards
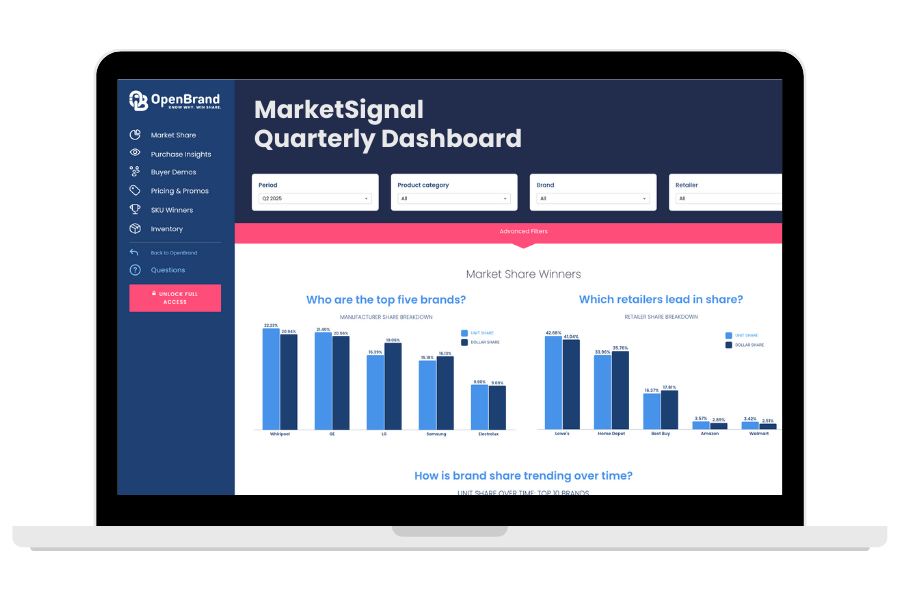
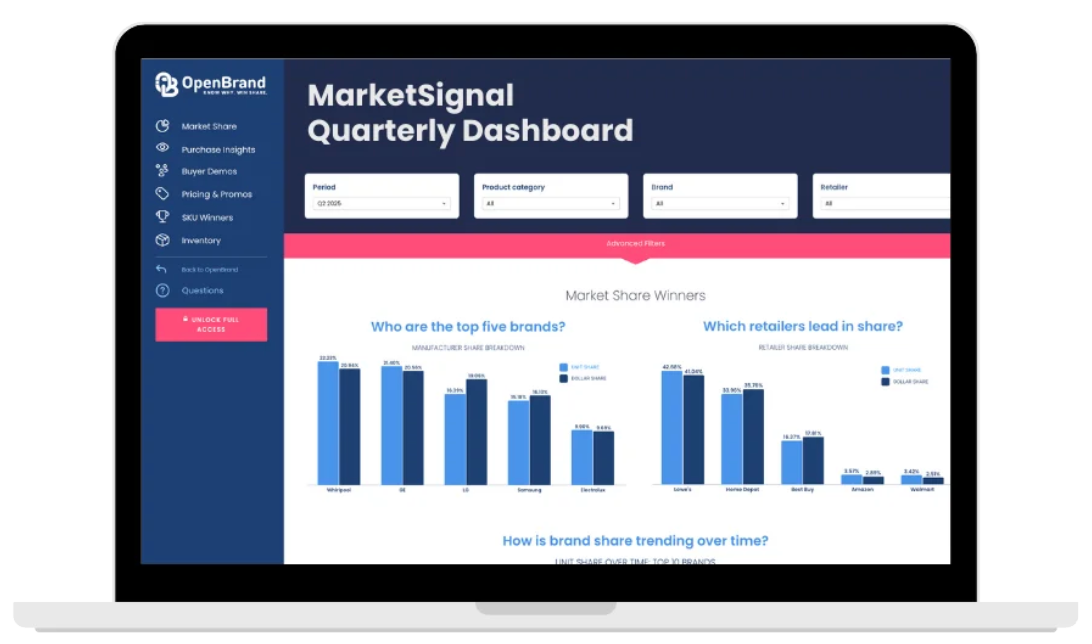
OpenBrand’s data is available to the public through MarketSignal, our quarterly overview dashboards, delivering market share, pricing, promotions, and purchase insights.
Read our latest blogs and insights

Consumer Price Index: Durable Goods | September 2026
This is the October 2026 release of the OpenBrand Consumer Price Index (CPI) – Durable Goods…

Kitchen & Bath Market Insights: Top Brands, Retailer Share & Trends
Kitchen and bath purchases rarely start with a wish list. They start with a leak, a failed fixture,…

Consumer Price Index: Durable Goods | August 2026
This is the September 2026 release of the OpenBrand Consumer Price Index (CPI) – Durable…

Paint & Stain Market Share Insights: Top Brands & Retailers (Q4 2025)
Home improvement demand held steady through the back half of 2025, and paint market share closed…
Ready to track how your share is shifting?
Get access to OpenBrand's modeled market share data
