
Trusted by global brands, retailers, distributors, and suppliers














Inside the Portal
Four tools. One place.

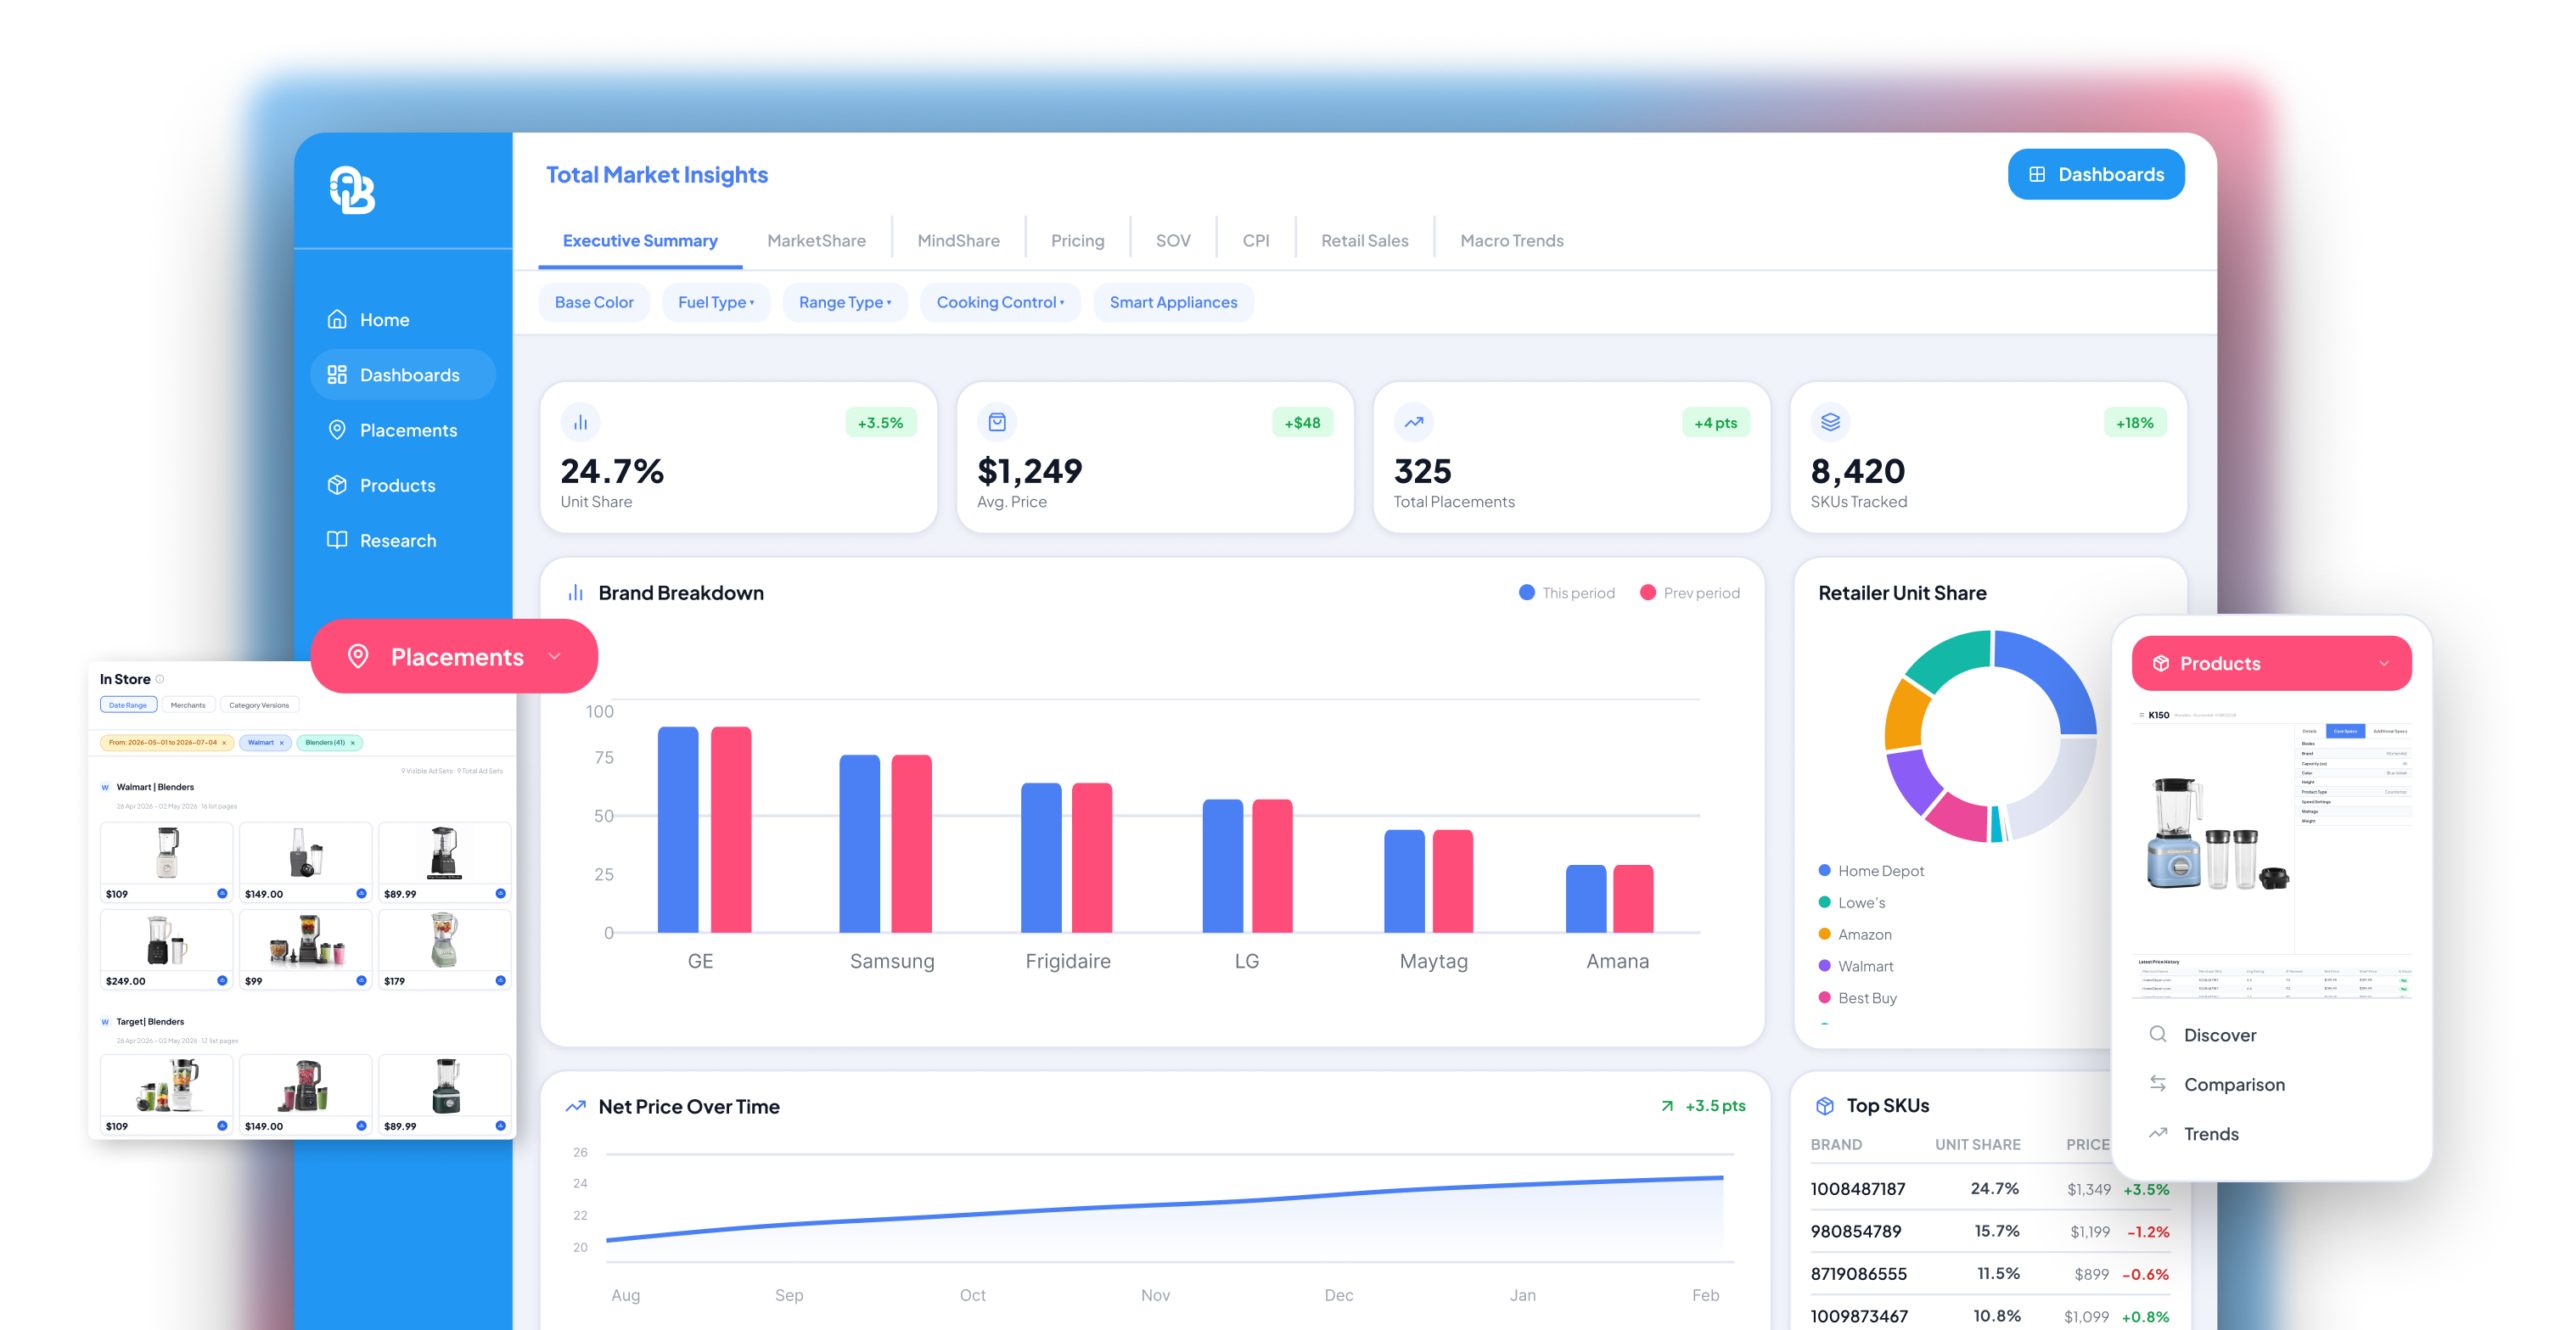
Category Data Dashboards
Market share, pricing, promotions, and consumer insights across the categories you track. Built for quick reads and deeper dives alike. Surface a trend in seconds or spend time understanding what’s driving it.

Comprehensive Product Library
SKU-level visibility into products across your category. Attributes, features, and specifications are structured so you can compare your lineup against the competitive set.


TOTAL MARKET INSIGHTS
Get the category read first
Total Market Insights helps teams see where movement is happening, spot the areas that need a closer look, and decide whether to drill in, export, report, or build the story.
PRODUCT LIBRARY
See the products driving movement
OpenBrand’s Product Library helps teams review specs, models, SKUs, and product families so they can understand what is really being compared and bring better context into market, pricing, and assortment decisions.
IN-STORE AD PLACEMENTS
See what showed up in-store
Use In-Store Ad Placements to review how products, pricing, promotions, tags, and placements appeared in physical retail. It gives teams visual evidence they can use in category, sales, pricing, competitive, and retailer conversations.
ANALYST REPORTING
Analysts explain what changed
OpenBrand analysts help teams make sense of the movement behind the data. Review category updates, product launches, retailer activity, competitive shifts, and market signals directly in the portal, then use that context to support the next report, deck, or business conversation.
Real-Time Insights Built to Improve Your Workflow
Move from market data to actionable next steps
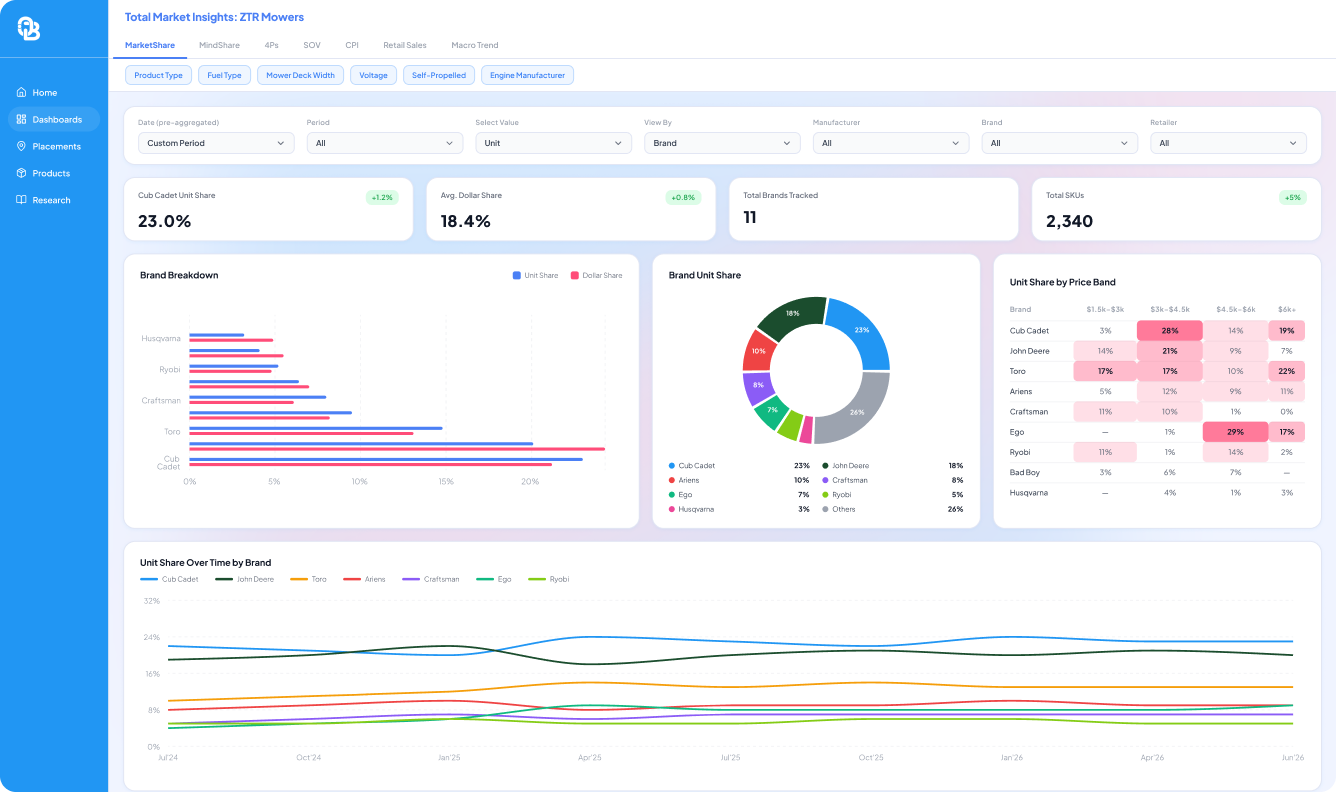
TOTAL MARKET INSIGHTS
Get the category read first
Total Market Insights helps teams see where movement is happening, spot the areas that need a closer look, and decide whether to drill in, export, report, or build the story.
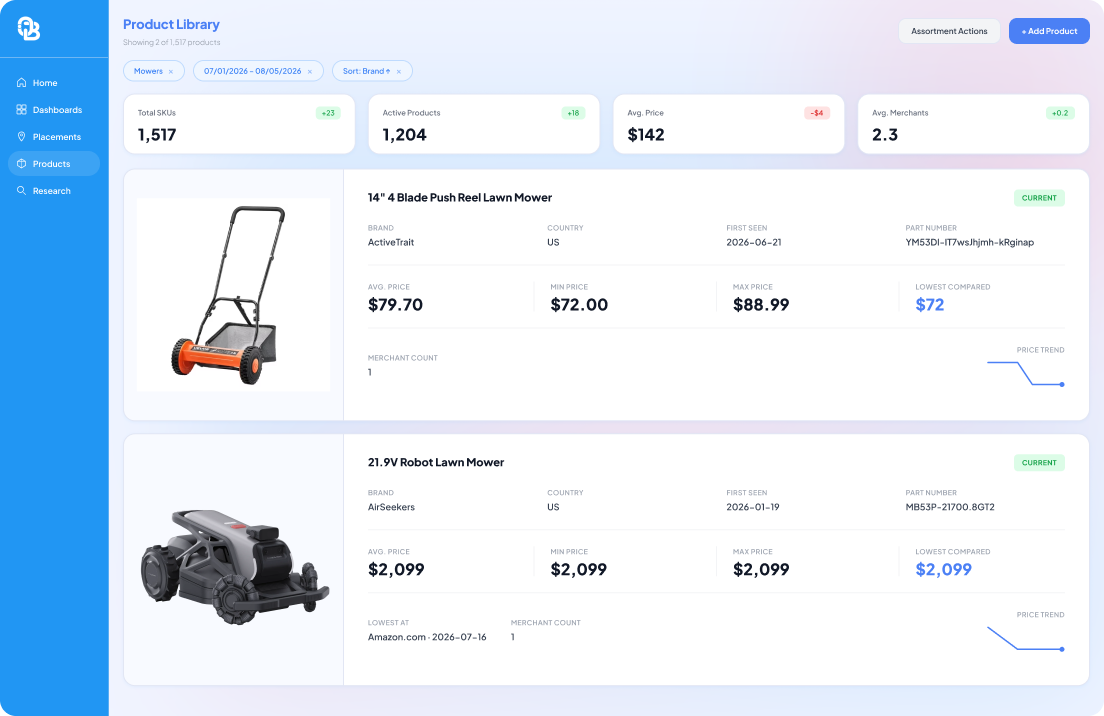
PRODUCT LIBRARY
Know what products drive movement
OpenBrand’s Product Library helps teams review specs, models, SKUs, and product families so they can understand what is really being compared and bring better context into market, pricing, and assortment decisions.
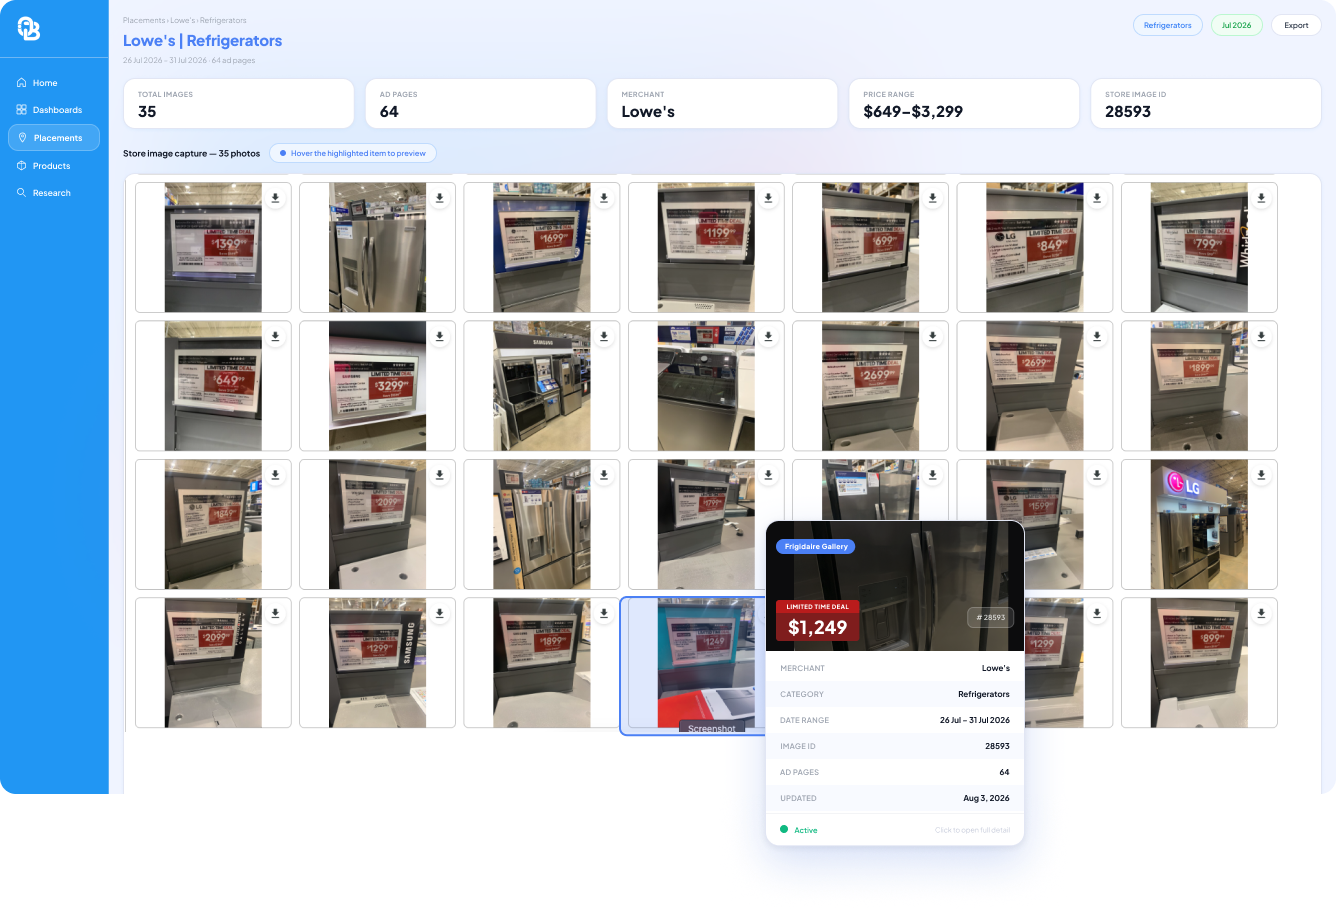
IN-STORE AD PLACEMENTS
See what showed up in-store
In-Store Ad Placements reveal how products, pricing, promotions, tags, and placements appeared in physical retail. It gives teams visual evidence they can use in category, sales, pricing, competitive, and retailer conversations.
ANALYST REPORTING
Analysts explain what changed
OpenBrand analysts help teams make sense of the movement behind the data. Review category updates, product launches, retailer activity, competitive shifts, and market signals directly in the portal, then use that context to support the next report, deck, or business conversation.
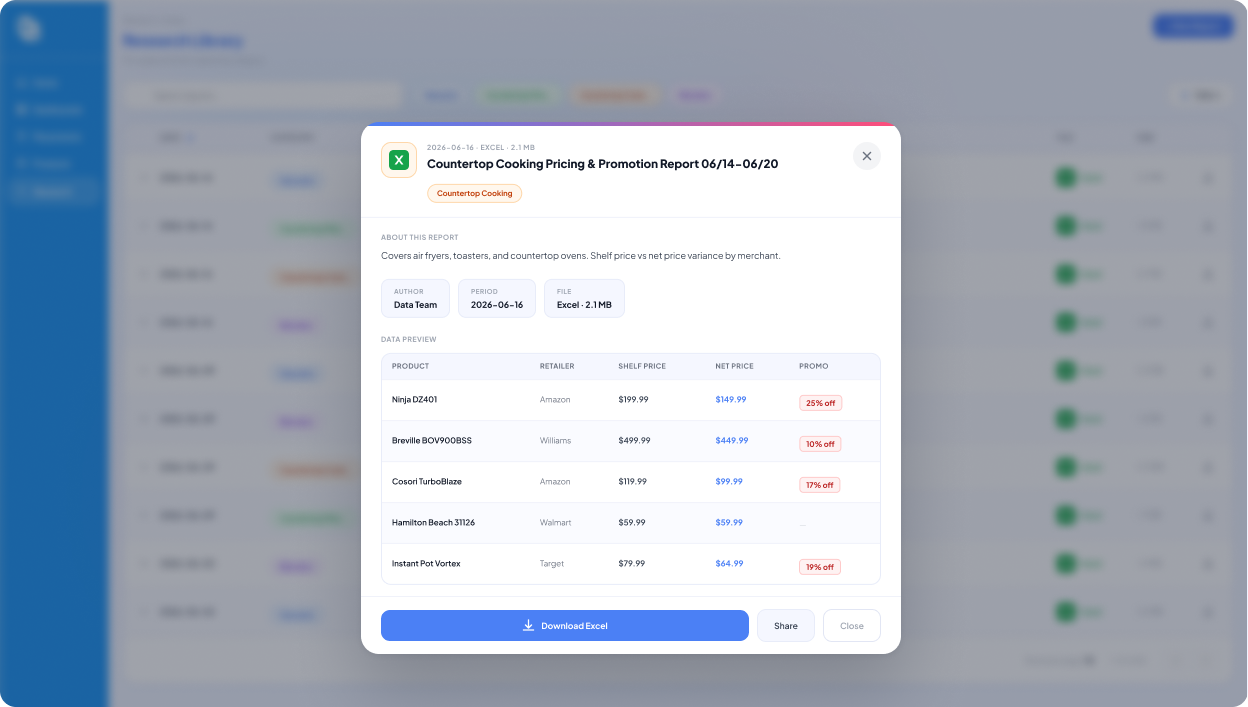
REPORTING READY INSIGHTS
Take the read into the next conversation
Export, report, or bring the read into decks, planning, retailer conversations, and internal workflows.

Start in OpenBrand. Take the read where it needs to go.
A closer look at THE OPENBRAND PORTAL
The full picture behind every market move
Total Market Insights
Your category at a glance. And deeper when you need it.
OpenBrand’s Total Market Insights dashboards surface market share, pricing, promotions, and consumer insights for every category you track – all in one place. The data is structured so you can get a quick read in under a minute or spend time drilling into what is driving a specific movement.
- Market share by brand, retailer, and time period, down to the SKU-level
- Average selling price and promotional rate trends
- Category-level consumer demand and purchase behavior
- Side-by-side competitive brand comparison
PRODUCT LIBRARY
Drill into the products behind the movement
In durables, the product details matter. Product Library helps teams review specs, models, SKUs, and product families so they can understand what is really being compared and bring better context into market, pricing, and assortment decisions.
- SKU-level specs, attributes, and features across your competitive set
- Product family mapping to track model lineage and assortment changes
- Side-by-side comparisons across manufacturers and retailers
- Filter by brand, category, retailer, or feature to find exactly what you need
IN-STORE AD PLACEMENTS
See what showed up in-store
Use In-Store Ad Placements to review how products, pricing, promotions, tags, and placements appeared in physical retail. It gives teams visual evidence they can use in category, sales, pricing, competitive, and retailer conversations.
- Photos from retail locations showing shelf placement, signage, and pricing
- Promotional tags, end caps, and featured placements captured
- See how your products appear next to the competition on the shelf
- Filter by retailer, region, category, or time period to see what is relevant
ANALYST REPORTING
Use the analyst read to explain what changed
OpenBrand analysts help teams make sense of the movement behind the data. Review category updates, product launches, retailer activity, competitive shifts, and market signals directly in the portal, then use that context to support the next report, deck, or business conversation.
- Written by analysts who track these categories as their primary work
- Reports are published when the data shows meaningful movement
- Coverage includes share shifts, pricing trends, product launches, and retailer activity
- Analyst notes appear directly in the portal alongside the data
Total Market Insights
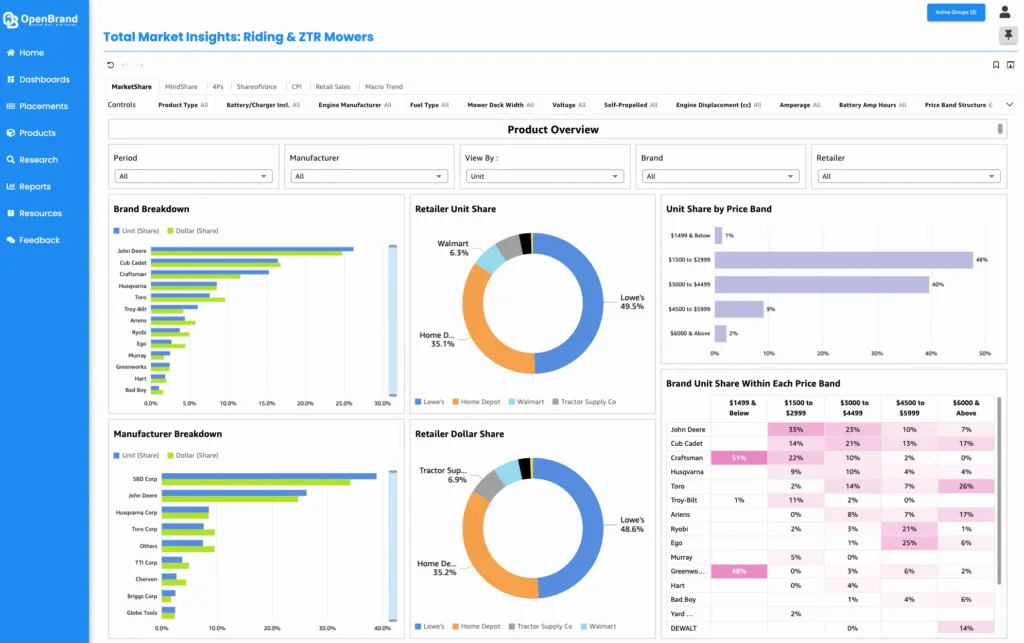
Your category at a glance. And deeper when you need it.
OpenBrand’s Total Market Insights dashboards surface market share, pricing, promotions, and consumer insights for every category you track – all in one place. The data is structured so you can get a quick read in under a minute or spend time drilling into what is driving a specific movement.
- Market share by brand, retailer, and time period, down to the SKU-level
- Average selling price and promotional rate trends
- Category-level consumer demand and purchase behavior
- Side-by-side competitive brand comparison
PRODUCT LIBRARY

Drill into the products behind the movement
In durables, the product details matter. Product Library helps teams review specs, models, SKUs, and product families so they can understand what is really being compared and bring better context into market, pricing, and assortment decisions.
- SKU-level specs, attributes, and features across your competitive set
- Product family mapping to track model lineage and assortment changes
- Side-by-side comparisons across manufacturers and retailers
- Filter by brand, category, retailer, or feature to find exactly what you need
IN-STORE AD PLACEMENTS
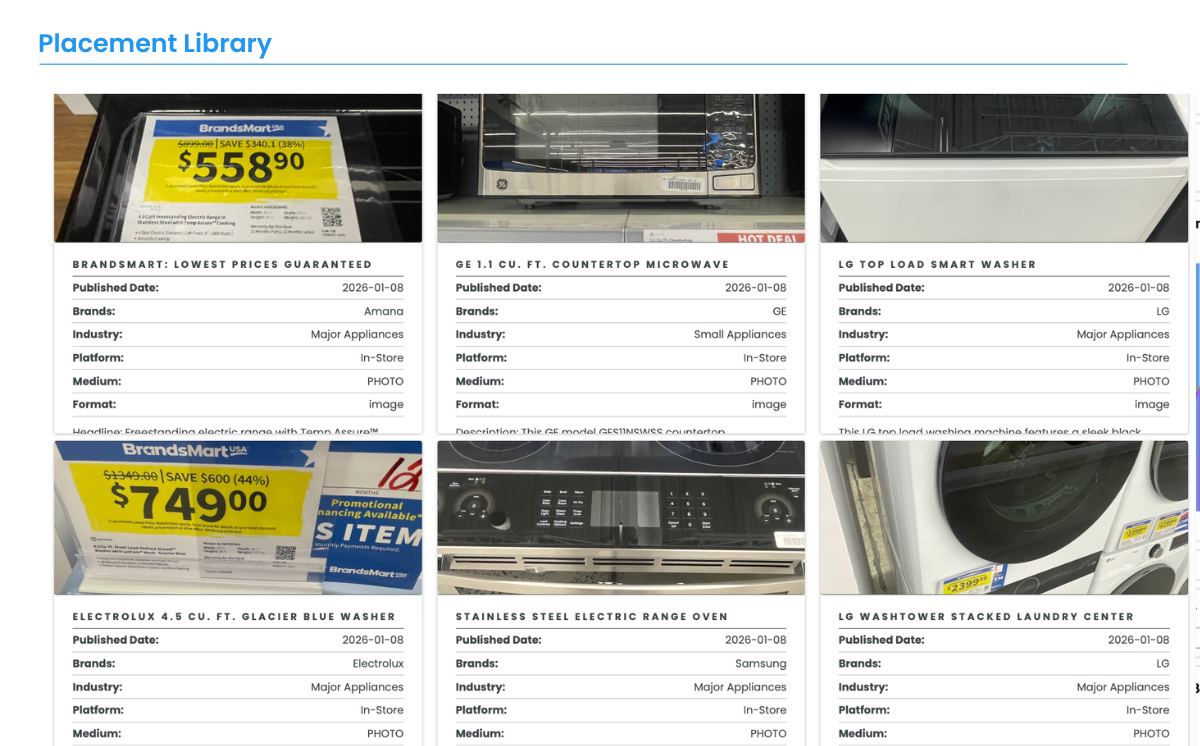
See what showed up in-store
Use In-Store Ad Placements to review how products, pricing, promotions, tags, and placements appeared in physical retail. It gives teams visual evidence they can use in category, sales, pricing, competitive, and retailer conversations.
- Photos from retail locations showing shelf placement, signage, and pricing
- Promotional tags, end caps, and featured placements captured
- See how your products appear next to the competition on the shelf
- Filter by retailer, region, category, or time period to see what is relevant
ANALYST REPORTING
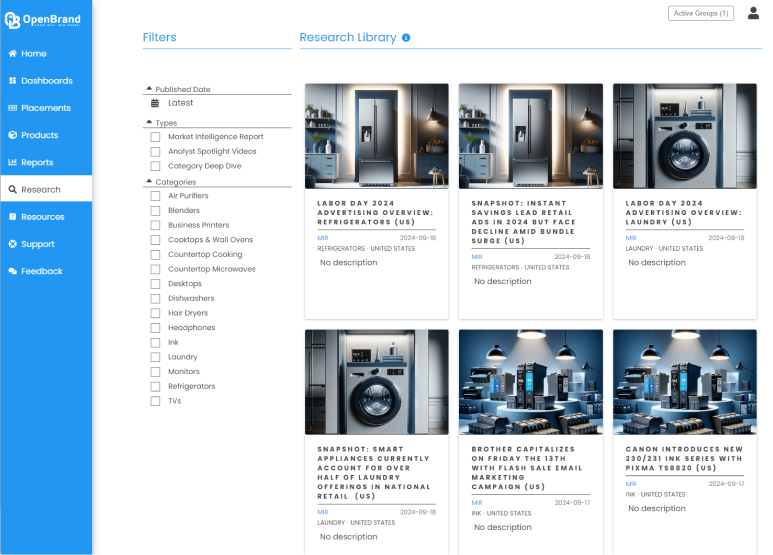
Use the analyst read to explain what changed
OpenBrand analysts help teams make sense of the movement behind the data. Review category updates, product launches, retailer activity, competitive shifts, and market signals directly in the portal, then use that context to support the next report, deck, or business conversation.
- Written by analysts who track these categories as their primary work
- Reports are published when the data shows meaningful movement
- Coverage includes share shifts, pricing trends, product launches, and retailer activity
- Analyst notes appear directly in the portal alongside the data
Total Market Insights
Your category at a glance. And deeper when you need it.
OpenBrand’s Total Market Insights dashboards surface market share, pricing, promotions, and consumer insights for every category you track – all in one place. The data is structured so you can get a quick read in under a minute or spend time drilling into what is driving a specific movement.
- Market share by brand, retailer, and time period
- Average selling price and promotional rate trends
- Category-level consumer demand and purchase behavior
- Side-by-side competitive brand comparison
PRODUCT LIBRARY
Drill into the products behind the movement
In durables, the product details matter. Product Library helps teams review specs, models, SKUs, and product families so they can understand what is really being compared and bring better context into market, pricing, and assortment decisions.
- Key callout
- Key callout
- Key callout
- Key callout
IN-STORE AD PLACEMENTS
See what showed up in-store
Use In-Store Ad Placements to review how products, pricing, promotions, tags, and placements appeared in physical retail. It gives teams visual evidence they can use in category, sales, pricing, competitive, and retailer conversations.
- Key callout
- Key callout
- Key callout
- Key callout
Why you need OpenBrand for durables market data
Still piecing together the market read?
Most tools give you another source to check. OpenBrand brings market data, product context, retail evidence, and analyst perspective into one portal built for durable goods.
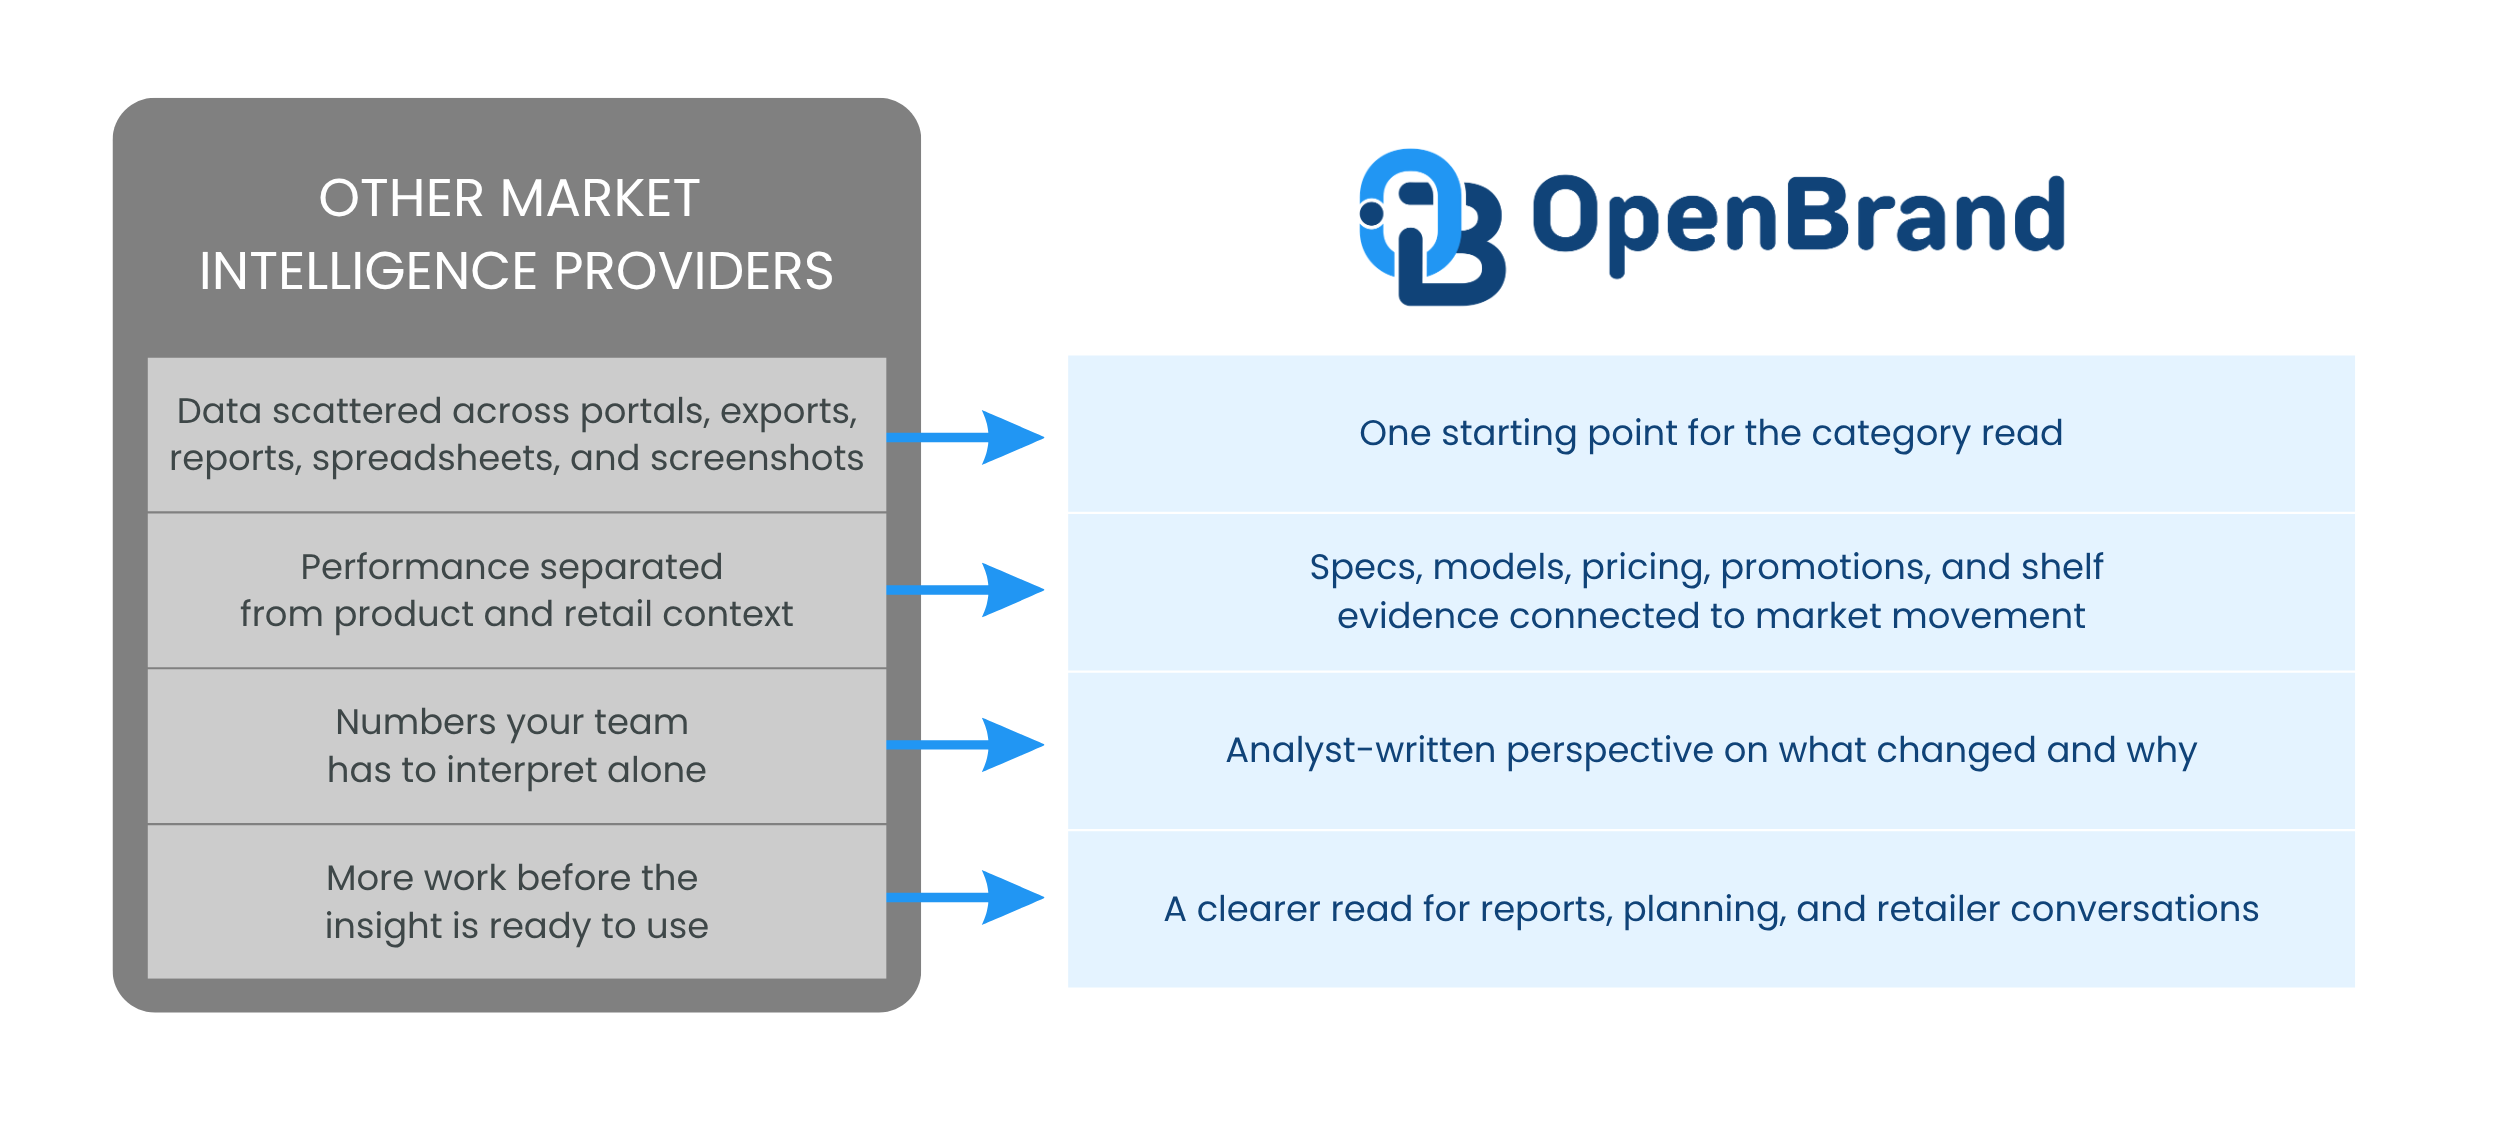
Most tools show the data. OpenBrand helps explain the read.
Dashboards, exports, and reports can show part of the picture. OpenBrand gives durable goods teams a clearer starting point, then adds the product context, retail evidence, and analyst perspective needed to understand what moved.
Built around the way durable goods markets work
A spec, model number, bundle, channel, retailer, or promotion can change the answer. OpenBrand brings that context into the market read so teams can compare products, pricing, and performance with more confidence.
Analyst reports help turn numbers into context
OpenBrand customers get access to in-portal analyst reports that break down category movement, product changes, retailer activity, and market signals. So teams are not left interpreting every shift from the raw data alone.
Take the read into the next conversation
Use OpenBrand to get oriented, drill into the details, review analyst context, and pull the data your team needs for reports, decks, retailer conversations, and internal planning.
See the market. Understand the movement. Take the next step.
Demo Our Market Intelligence Portal
See the market data available for your category
From market share to category shifts, competitive pricing, in-store ad placements, and recommendations from our analysts, request a brief intro demo to the OpenBrand Market Intelligence Portal to see the full picture of your category.
Frequently Asked Questions
The OpenBrand Market Intelligence Portal is where durable goods teams start when they need a quick read on the categories they track. It helps teams see market movement, drill into the context behind it, and pull the data they need for the next step.
A dashboard shows information. OpenBrand helps teams understand what the information means in a durable goods market, where product details, retailer context, pricing, promotions, availability, and in-store execution can all change the read.
Teams can review category movement, dig into product details, check in-store execution, read analyst-written market reports, export data, and bring the right context into planning, reporting, sales, pricing, category, and retailer conversations.
Total Market Insights is the category-level starting point inside OpenBrand. It helps teams get a high-level read on the categories they track, see where movement is happening, and decide where to drill in next.
Product Library helps teams understand the products behind the numbers. That includes specs, models, SKUs, product families, and other details that matter when comparing performance, pricing, assortment, and competitive movement.
In-Store Ad Placements show visual examples of how products, pricing, promotions, tags, and placements appeared in physical retail. Teams can use that evidence to support sales, category, pricing, competitive, and retailer conversations.
No. Many teams still need exports, spreadsheets, BI tools, and internal reports. OpenBrand helps teams start with more context before they take the data into those workflows.
The portal is most relevant for market intelligence, business insights, category management, merchandising, sales, account strategy, competitive intelligence, and pricing teams that need recurring market context for durable goods decisions.
Retail Pricing Intelligence
Posted pricing alone is not enough. Retail pricing teams need more than competitor price tracking to win. OpenBrand helps retailers interpret real competitive offers across pricing, availability, and promotions so retail teams can move, hold, and respond without sacrificing margin.
Line Review Market Data
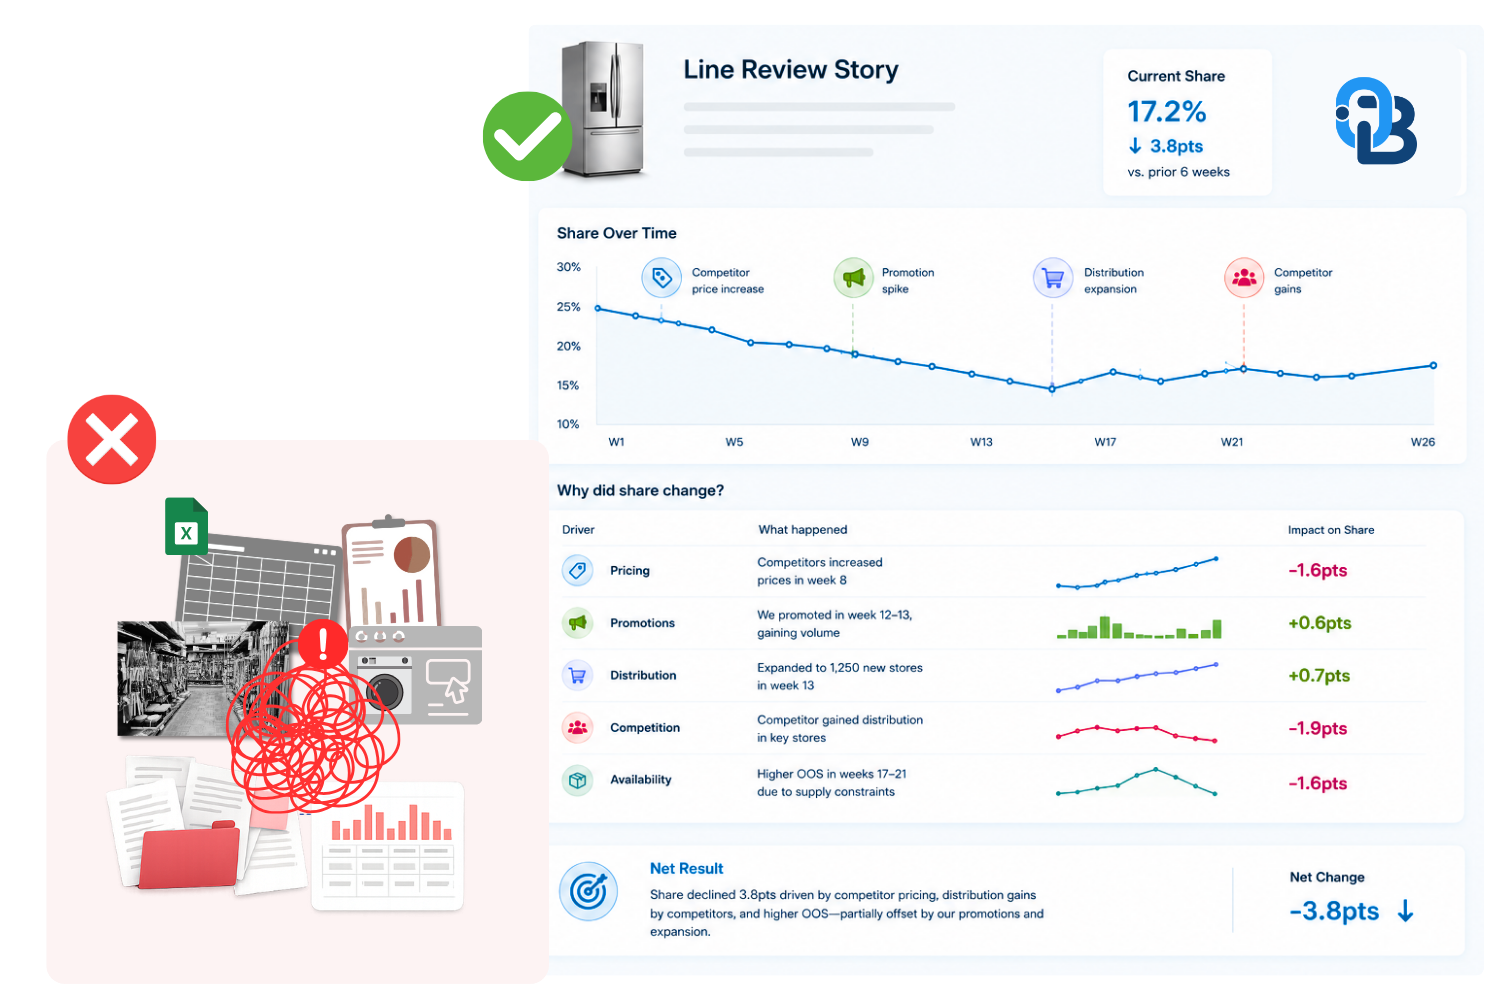
OpenBrand acts as a strategic partner for durable goods brands and retailers, delivering the market data needed to confidently and proactively defend shelf space and assortment recommendations.
Retailer Market Intelligence
Delivering insights at the retailer, brand, category, and model-level, helping you understand what’s driving share and why with unmatched accuracy.
Use Case: Retail Shopper Leakage
Understand how shopper demand shifts across competitors and retailers. Gain visibility into where leakage occurs so you can better interpret changes in performance.
EXPLORE OUR DATA
Public Quarterly Market Dashboards
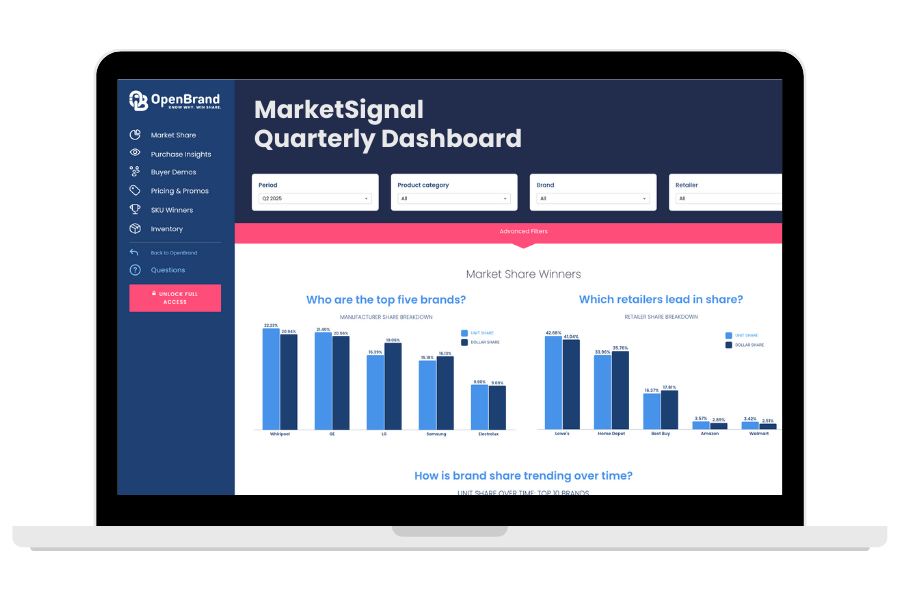
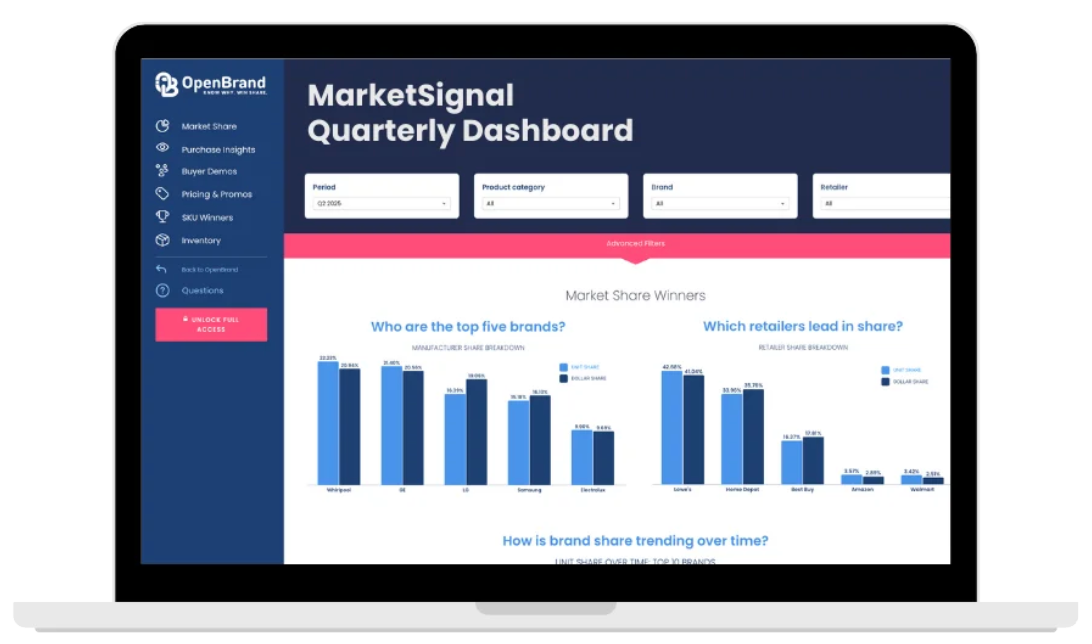
OpenBrand’s data is available to the public through MarketSignal, our quarterly overview dashboards, delivering market share, pricing, promotions, and purchase insights.
Read our latest blogs and insights
What Prime Big Deal Days 2026 Told Retailers and Brands: Category Reads
Prime Big Deal Days ran October 6-7, and the durables picture looked different from June’s…
Prime Big Deal Days: Bigger Discounts, Not Necessarily Lower Prices
Discounts went up, prices didn’t go downDuring Prime Big Deal Days, two-thirds of Amazon.com…
Consumer Price Index: Durable Goods | September 2026
This is the October 2026 release of the OpenBrand Consumer Price Index (CPI) – Durable Goods…

Kitchen & Bath Market Insights: Top Brands, Retailer Share & Trends
Kitchen and bath purchases rarely start with a wish list. They start with a leak, a failed fixture,…
