When you think about market share, you’re really thinking about the scoreboard. It tells you who’s winning and by how much. But here’s the thing—not all scoreboards are built the same.
In the world of consumer durables, market share data is about building the most reliable and actionable view from imperfect parts.
Durables are uniquely challenging: they are low-frequency, high-consideration purchases with long cycles and wide variations by region, retailer, and specification. No single data source can capture the full picture. Whether it’s receipts, credit card data, tracking surveys, or more, each has strengths, but also blind spots.
That’s where modeled market share stands apart. Instead of anchoring to one main signal that will often fall apart as you dig deeper into a category, we integrate a multitude of data sources, each weighted dynamically based on how strong and relevant the signal is for a given product or category. It’s a flexible, pragmatic approach designed for a market where traditional methods often fall short.

By accepting and leaning into the complexity, modeling across it, infusing deep industry expertise, and validating it with partners, we deliver the most accurate and consistent view of share performance available—a view that doesn’t fall apart as you dive deeper into the category with the added benefit of completely unmasked data.
At OpenBrand, we believe that modeled market share, using multiple data inputs, is the only score that truly reflects performance, especially for brands in low-frequency, high-consideration categories. This article dives into why.
- The Problem with Receipt-Based Market Share
- Where Receipt Panels Fall Apart in the Real World
- Why Modeled Market Share Works Better
- Built for Durables, Not Wall Street
- Request a Data Validation
The Problem with Receipt-Based Market Share
Many market intelligence providers rely heavily on receipt-based transaction data—email receipts, scanned purchases, and credit card data. It’s fast, it’s familiar, and for fast-moving consumer goods (CPG), it can be a solid standalone method for measuring market share. But durable goods are a different game entirely.
Receipt panels alone present clear limitations:
- They incentivise high-frequency CPG brand purchases, which leads to over-indexing for grocery products
- Fashion and beauty are often well represented
- They underrepresent categories with infrequent, high-investment purchases
- Their demographics are typically highly skewed towards populations that are low-frequency consumer durables buyers
Where Receipt Panels Fall Apart in the Real World
Let’s say you’re trying to understand market share for a brand of battery-powered zero-turn mowers (ZTRs) sold at a specific retailer. You want to know how your product is performing:
- At a specific retailer
- For a specific 42-inch deck size
- Within a certain price band
- In Q2, post-promotional period
In a receipt panel, each of those variables shrinks your sample. And as they compound, the data evaporates. By the time you’ve layered in brand × retailer × deck size × power type × timeframe, you’re often looking at a handful of receipts or none at all. The result? Asterisks. Missing data. Or worse, a false sense of confidence through precision.
Let’s walk through a real example using receipt data. This data shows all receipts for a major retailer in the US for March 2025. You’ll see how the sample thins as you add more variables. Bottom-mount fridges represent 0.0011% of the total receipt sample. Even quarterly, this would total 228 receipts.
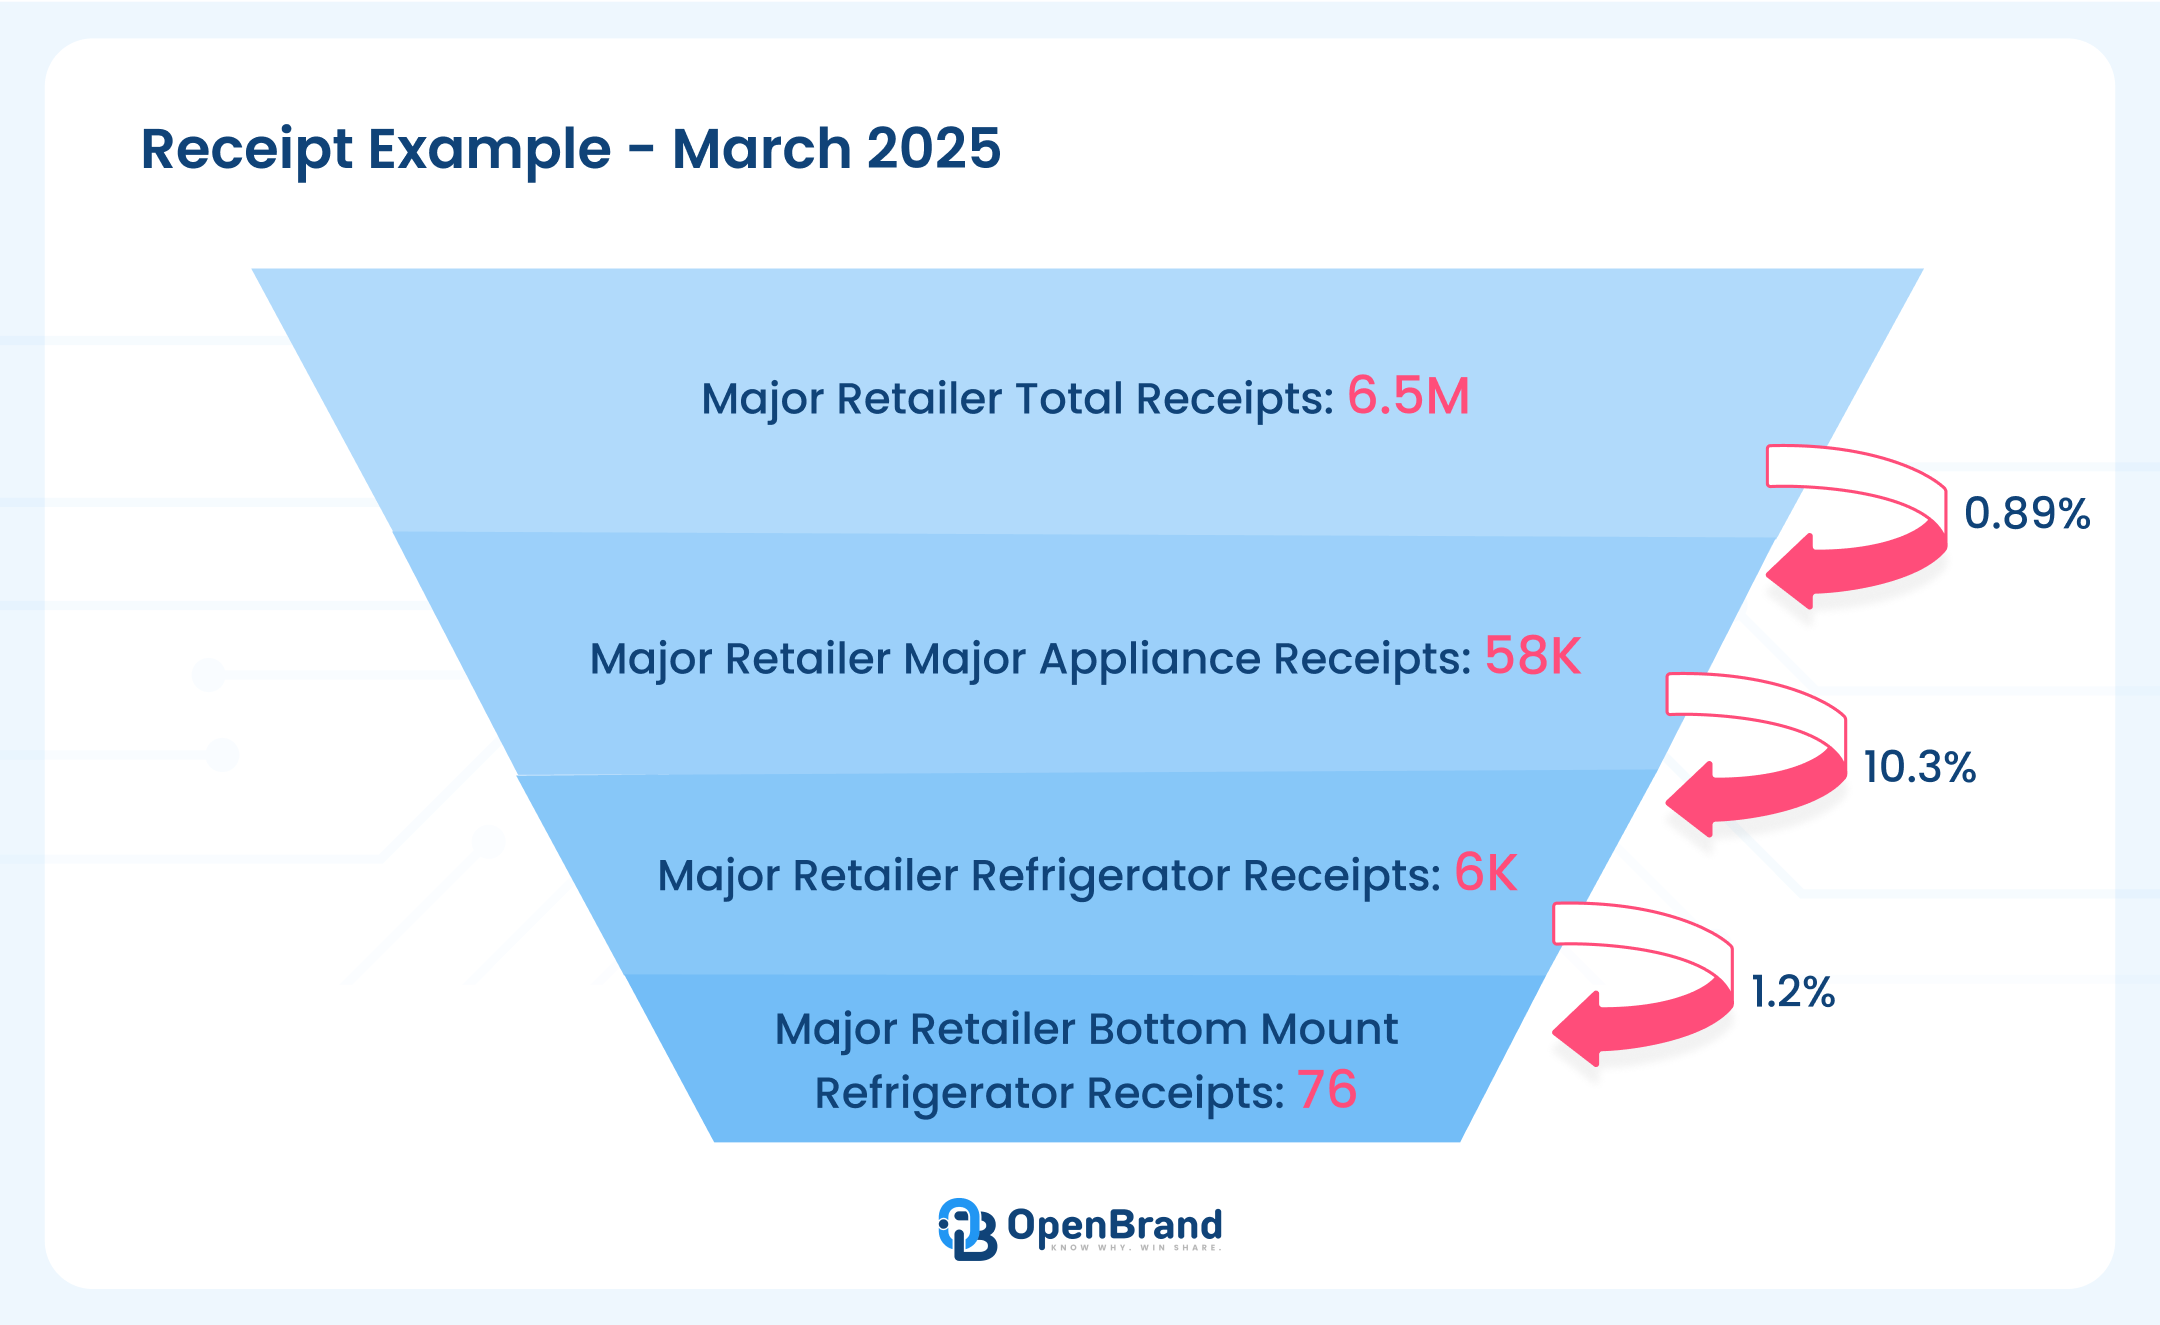
“This real data example illustrates how receipt volumes quickly dwindle as you drill into more granular cuts of the data. That’s exactly why we built a mixed modeling approach that adjusts by category and product type. In many cases, it’s not possible to measure durable goods performance at the level our customers need based on receipts alone.”
— David Fernie, VP of Data Science at OpenBrand
Now imagine applying that same methodology to categories like:
- Pesticides and seed treatments (seasonal, often regional, mostly in-store)
- Small appliances (broad SKU variety, often gift-driven, with sharp regional sales patterns)
- Outdoor grills (highly seasonal, high-ticket, and influenced by regional trends)
- Power washers (niche but competitive, often driven by specs and seasonal demand)
These aren’t edge cases. In a receipt-based model, effectively every durables category becomes an edge case.
Receipt-based panels alone simply don’t have the depth or structure to measure them with the fidelity you need to make confident decisions.
Why Modeled Market Share Works Better
Durables are different. Which is why we built a different model—one designed for long purchase cycles, low-frequency transactions, and complex category structures.
1. Optical Web Collection with AI Processing, Not Scraping
Our proprietary optical web collection mimics human browsing behavior. It captures cleaner, more complete product and pricing data, without relying on brittle scraping templates that break every time a webpage updates, delivering the most accurate, dependable, and robust web collection data.
2. Multi-Source Modeling for Confidence and Coverage
Our modeled market share is built on a robust foundation of diverse, high-fidelity data sources:
- Transaction Data: Accounting for more than $150 billion in transactions
- Optical Web Collection: Spanning hundreds of retailers and over hundred of thousands of unique part numbers
- Consumer Tracking Survey Data: Hundreds of thousands of annual responses, demographically and geographically balanced to the U.S. Census
- Clickstream Records: Based on tens of millions of real-world digital journeys—tracking search, consideration, and engagement
- In-Store Collection: Monthly audits across dozens of metro markets, across top national and regional retailers tracking inventory, pricing, and placement
Many durable categories, especially low-incidence or long-tail products, are sparsely represented or completely missing from receipt panels. That’s why we deploy a category- and product-type-aware mixed modeling approach. Our system dynamically adjusts the weight of each data source based on the availability and strength of signal, ensuring accuracy even when receipt data is limited or absent.

This enables us to deliver SKU-level market share with statistical confidence, even in the parts of the market where traditional methods fail to produce usable insights.
3. Designed for Depth, Not Just Direction
With OpenBrand, you can analyze:
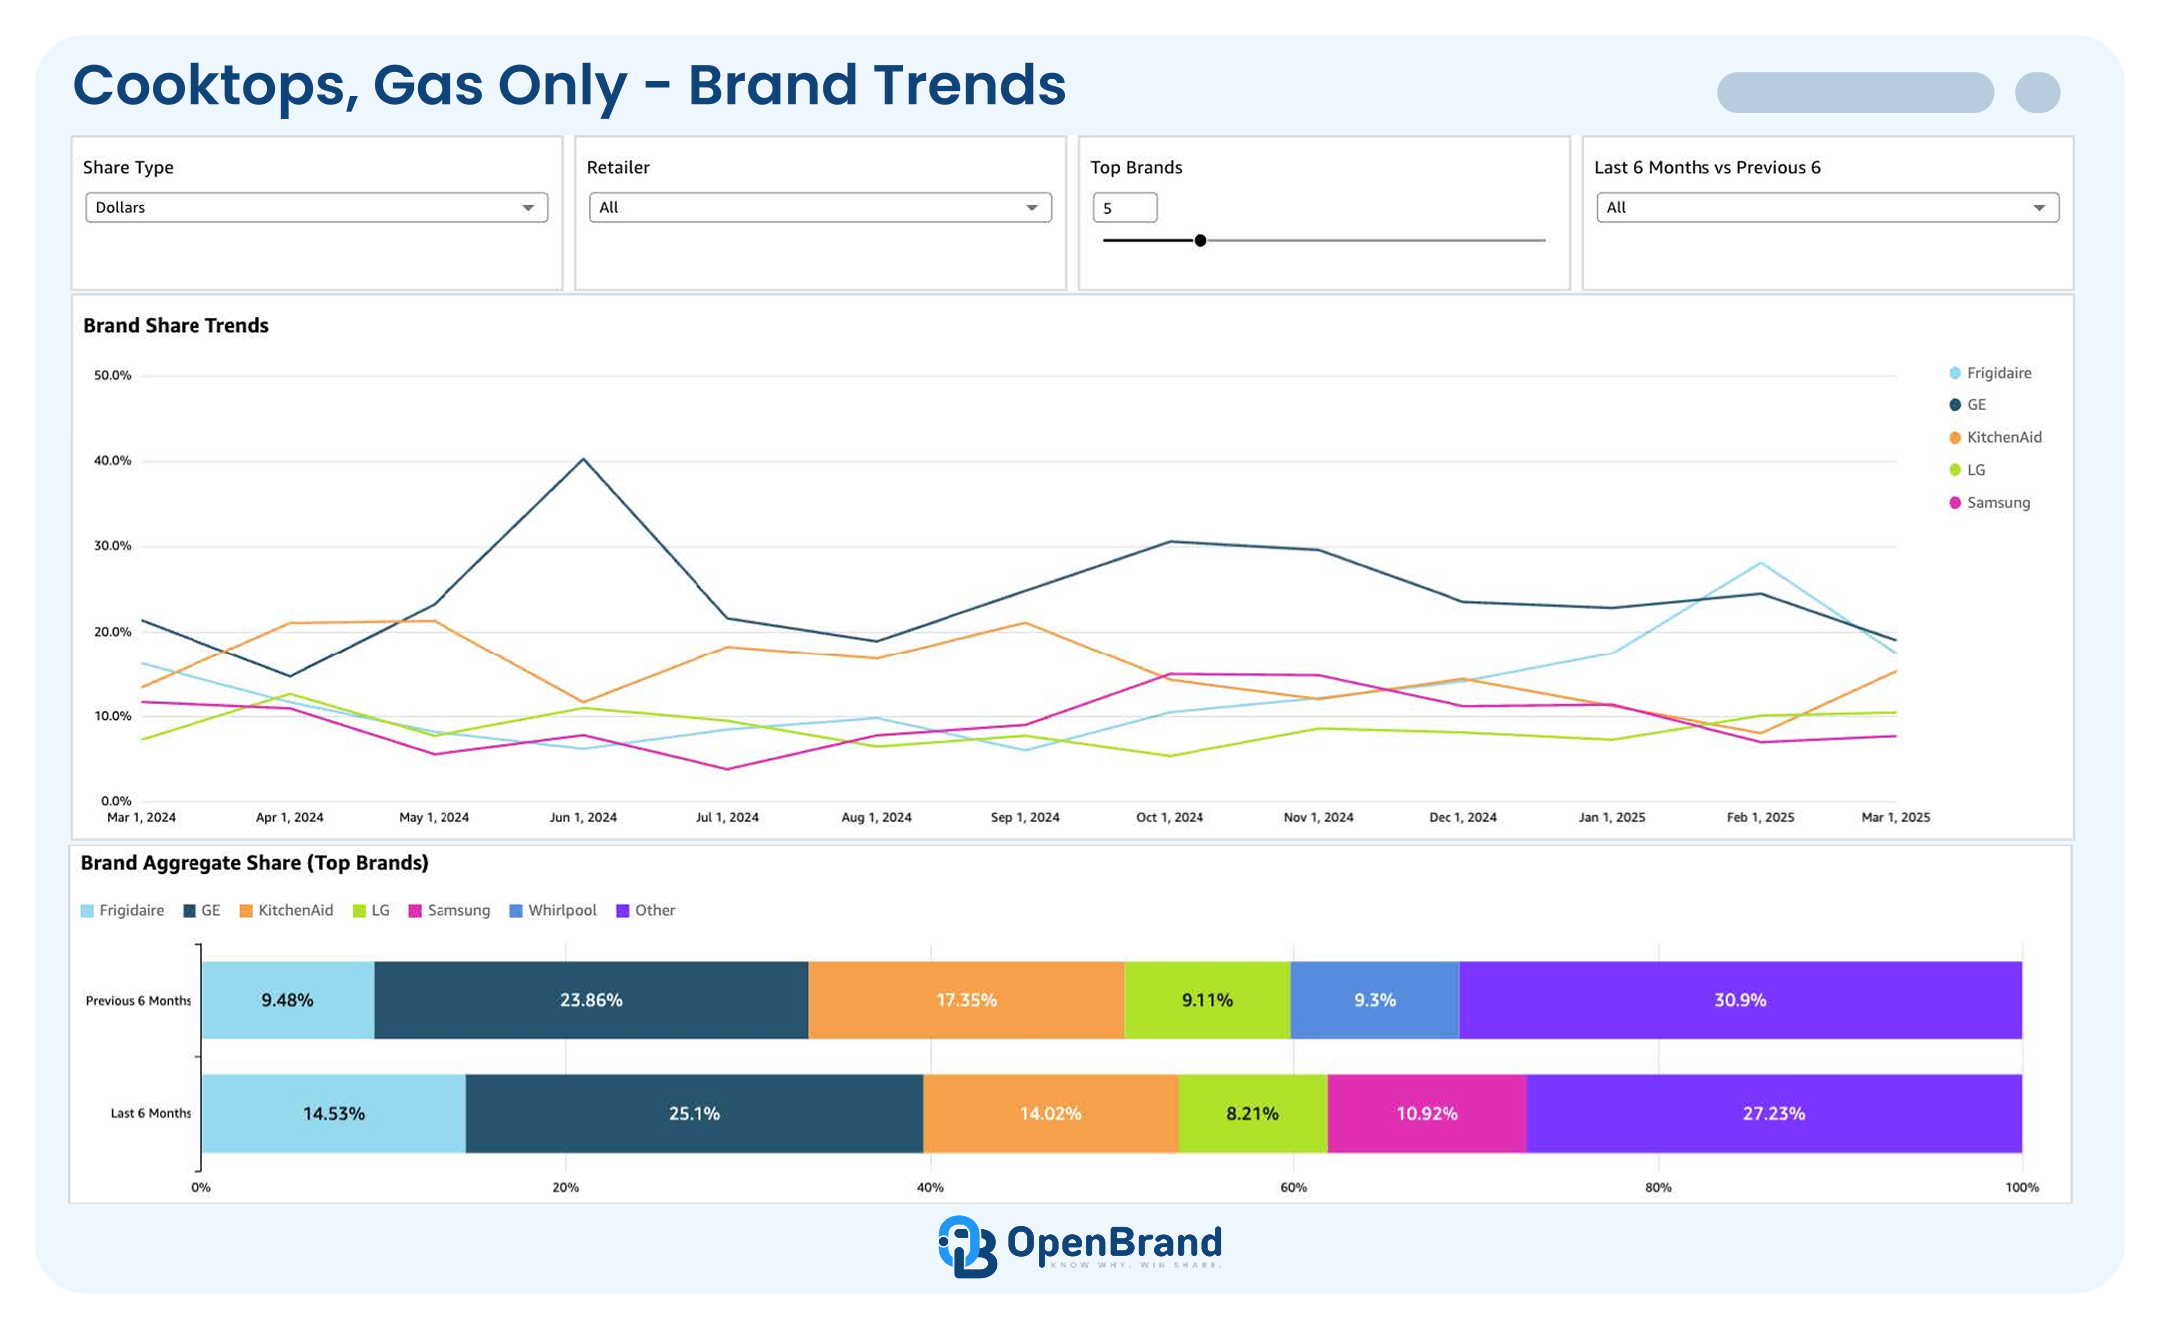
- Retailer and brand share trends
- Estimated gross units and dollars by brand, retailer & SKU
- Mix shifts between product attribution (like battery vs gas), or premium and entry-level SKUs
- Performance by spec, like deck width, fuel type, or horsepower
- Data is completely unmasked


Built for Durables, Not Wall Street
Here’s the truth: most receipt-based systems were initially built for hedge funds and then were repurposed for commercial use. They prioritize fast release company-level insights over accuracy and product depth, and often serve up directionally valid, but shallow data. Meeting the needs of manufacturers and retailers is the core of our business, and has been for over 20+years.
At OpenBrand, we’ve built a market measurement model that’s:
- Grounded in industry-specific taxonomies
- Backed by a team that knows the products and the retailers
- Able to handle the long tail of durable goods, not just high-volume SKUs
This isn’t market share guessing. This is precision data for decision-makers to ensure better outcomes.
Get the Data You Can Trust
Request a Market Share Data Validation
If your market share data can’t confidently answer product-specific questions at the intersection of brand, retailer, and spec, you’re not playing with a full view. And partial views lead to missed opportunities.
OpenBrand’s modeled market share gives you:
- Complete visibility into real category performance
- Confidence at the SKU level, not just macro trends
- Timely, validated data that’s built to support real strategy
So before your next strategic move, ask yourself:
Is your market share modeled for how your market actually works?
If not, let’s talk. We stand behind our data and will let you compare to what you are currently using by doing a data validation.
ABOUT THE AUTHOR