


Prime Day 2025 broke the mold. For the first time, Prime Day ran four full days, spanning July 8–11, twice the usual length, and emerged as Amazon’s biggest Prime Day ever in terms of total orders and dollars spent.
The extended timeframe gave analysts a bigger window into how consumer behavior and promotions evolved across multiple days, and that visibility offers powerful lessons for brands looking to optimize their strategy.
Our team at OpenBrand analyzed shopper behavior, promotional trends, and pricing effectiveness across durables categories to surface the highlights of Prime Day 2025 – and highlight where durables brands and retailers should focus heading into the next wave of key promotional events.
Download the full infographic now to see all the insights or read on below for a peek into how the data highlights this key takeaway: align promo planning, category prioritization, and retailer mix to drive bigger gains during the next big promotional event.
Durables-First Prime Day Data
Not all insights are created equal. As Prime Day set new records, OpenBrand delivered what others couldn’t: a complete view of the durables shopper journey. While most Prime Day recaps lump together consumer-packaged goods (CPG), perishables, and general merchandise, OpenBrand’s analysis focuses exclusively on durable goods buyers, categories, and price movements. [See how durables shoppers stand out from CPG.]
Our durables-first approach ensures your strategy is based on the right shoppers—those navigating high-consideration purchases where pricing, promotions, and category dynamics behave very differently than in CPG.
Prime Day 2025: Key Durables Market Insights
- Durables-only data showed actual purchase trends diverged from shopper intent, with customers purchasing more home goods and tools, but fewer small appliances
- 57% of shoppers spent over $100, often exceeding their budget due to value perception
- Promotions satisfaction strongly correlated with higher spend
- Retailers like Walmart and Best Buy captured spillover sales beyond Amazon
- Top planned categories: Home Improvement, Small Appliances
- Top purchased categories: Consumer Electronics, Outdoor Power
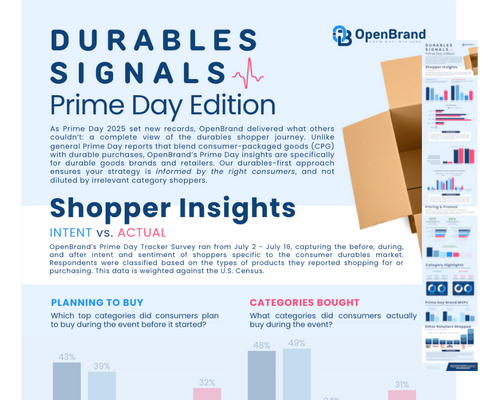
Durables Shopper Intent vs. Actual Behavior
OpenBrand ran a targeted Prime Day Tracker Survey from July 2 – July 16, capturing the before, during, and after intent and sentiment of shoppers specific to the consumer durables market. Respondents were classified based on the types of products they reported shopping for or purchasing, and all data is weighted against the U.S. Census.
Here are a few callouts of insights from OpenBrand’s Prime Day Tracker Survey.
What categories did consumers plan to purchase on Prime Day?
Consumers entered Prime Day planning to buy home improvement products and small appliances.
| Consumer Electronics | Home Goods | Tools | Major Appliances | Small Appliances |
| 43% | 39% | 18% | 11% | 32% |
What categories did consumers actually purchase on Prime Day?
When the carts closed, consumer electronics and outdoor power topped the list of actual purchases.
| Consumer Electronics | Home Goods | Tools | Major Appliances | Small Appliances |
| 48% | 49% | 24% | 16% | 31% |
Notably, these were also among the most heavily promoted categories, with steep discounts and high promotional volume, indicating that clear value and visibility may have played a role in redirecting shopper spend.

When it came to spend, nearly 60% of shoppers exceeded $100, even though most planned to spend less. That overspend was driven by perceived deal quality, and it wasn’t just about price. Consumers bought when value was clear and urgency was high.
Insights Repackaged: Spending outpaced intent in the $150–$500 range, revealing untapped elasticity in the mid-tier durables market. The strong performance in home goods and slight underperformance in small appliances suggest a potential need to reassess promotional depth, optimize product mix, and align inventory to where consumers are truly investing for the next big promotional event.
Why Promotions (and Perceptions) Drive Real Dollars on Amazon
Based on OpenBrand’s Prime Day Tracker Survey, Amazon met or exceeded expectations for 81% of Prime Day shoppers, particularly in fast-event categories like small appliances and electronics.
The perceived value of these deals mattered. OpenBrand found a direct correlation between promotion satisfaction and total spend. The better the perceived value, the higher the spend. Most consumers reported an expected spend of under $150.

However, our post-event survey indicated many spent more than expected – especially those who felt Amazon’s deals exceeded expectations. 51% reported spending $150-500. 15% crossed the $500 mark. By contrast, shoppers whose expectations were met were more likely to stick to budget.
| Spend | Spend | Promotions | Promotions | |
| PLANNED | ACTUAL | MET | EXCEEDED | |
| $50 or less | 11% | 8% | 11% | 5% |
| $50 - $150 | 40% | 33% | 35% | 28% |
| $150 - $500 | 38% | 47% | 45% | 51% |
| $500 - $1,000 | 11% | 11% | 8% | 15% |
| Over $1,000 | 1% | 1% | 2% | 1% |
Pricing & Promo Performance: Data-Backed Tactics
OpenBrand’s pricing and promotions data was collected in real time during the Prime Day sales event. Our optical processing technology interprets unstructured data with human-like understanding, enabling exceptional accuracy and market-scale visibility.
On Amazon specifically, Prime Day saw:
- 2,171 unique promotions
- 28% average discount across durables
- Highest discount %: Headphones, Smart Home, TVs
- Highest average savings: Exercise Equipment, Major Appliances
This created a promo environment where price-sensitive shoppers could stretch their budgets and brands with smart pricing strategies came out ahead.
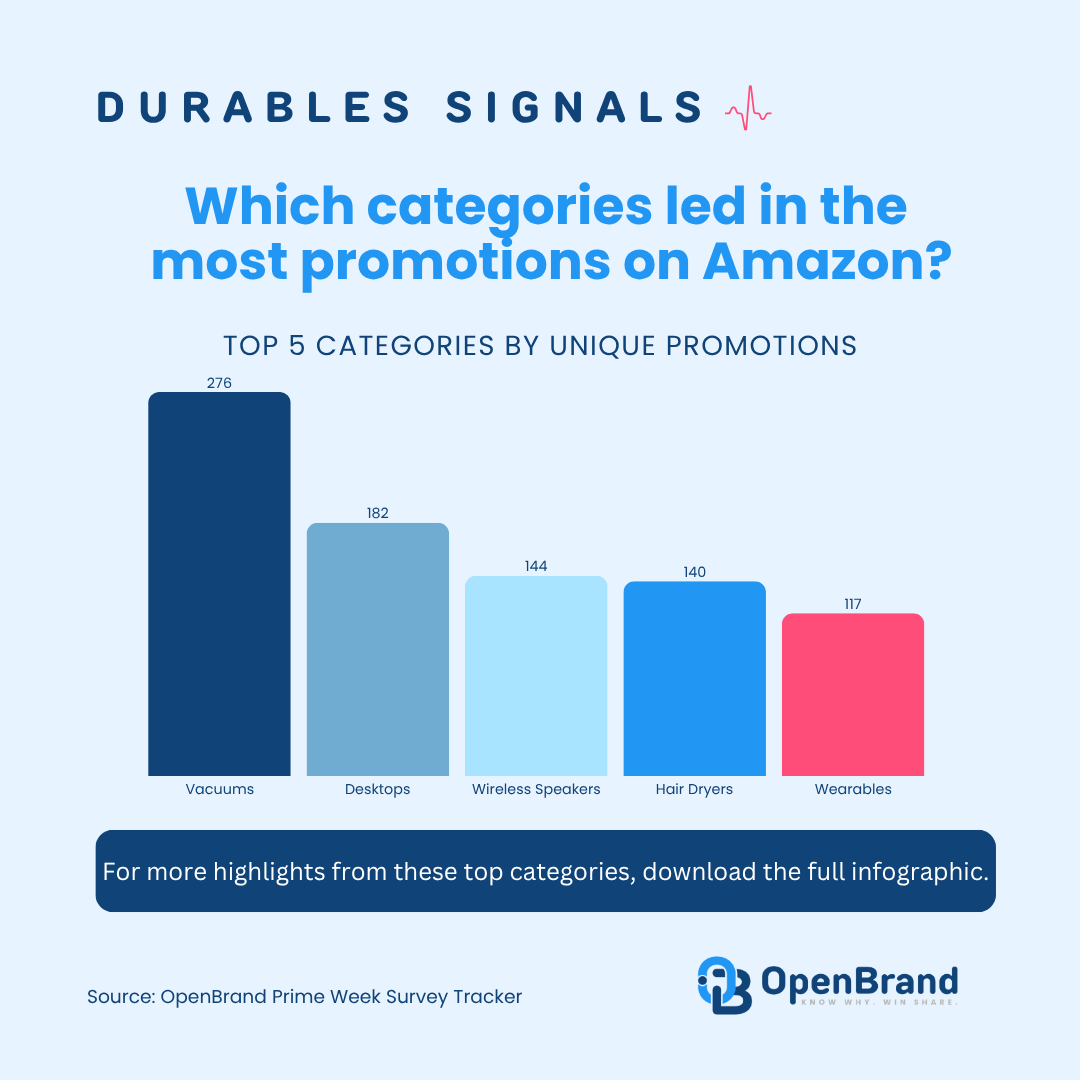
Top Prime Day 2025 Durables Categories
Top 5 Durables Categories by Unique Amazon Promotions
| Category | Unique Promotions |
| Vacuums | 276 |
| Desktops | 182 |
| Wireless Speakers | 144 |
| Hair Dryers | 140 |
Top 5 Durables Categories by Amazon Avg Dollar Savings
| Category | Avg $ Discount |
| Smartphones | $237.47 |
| Projectors | $234 |
| TVs | $221 |
| Notebooks | $213.09 |
Top 5 Durables Categories by Average Discount on Amazon
| Category | Avg % Discount |
| Smartphones | 27% |
| Projectors | 23% |
| TVs | 23% |
| Notebooks | 22% |
Insights Repackaged: Categories with the steepest discounts didn’t always win, but those with compelling value and perceived savings did. Know your category’s elasticity and tailor your offers accordingly.
Retailer Behavior: It’s Not Just Amazon
While Amazon remained the primary shopping hub, consumers also made significant purchases at:
- Best Buy
- Costco
- Lowe’s
- Walmart
This behavior highlights Prime Day’s halo effect: shoppers are primed to spend, but they’re looking across platforms.
Insights Repackaged
For Durables Brands: maximize Prime Day momentum across all retail partners. Don’t silo your strategy. Promote consistently and monitor cross-channel lift.
For Durables Retailers: Get in the game, and make sure you’re primed to stay competitive with pricing and promotional data that helps you act in real-time.
Get all the Prime Day 2025 insights and prepare for the next big event
If you’re planning for Q4 promotional events – Black Friday, Cyber Monday, Prime Big Deal Days – now is the time to rebuild your promotional playbook with data that cuts out the manual work so you can spend more time acting on what’s happening in the market.
For more Prime Day 2025 data, including category-specific highlights, brand winners, download the full infographic now.
Are you tracking the market in real-time? Let’s get you the insights you need — before the next big event hits. Book a 15-minute conversation now to get started.
Download the infographic now to see more Prime Day 2025 data
Read our latest blog post and insights

Consumer Price Index: Durable Goods | June 2026
This is the July 2026 release of the OpenBrand Consumer Price Index (CPI) – Durable Goods…
Prime Day 2026 Shopper Survey: Key Signals for Durables Brands and Retailers
Prime Day 2026 still drove strong shopper participation, but OpenBrand’s latest survey shows a…
What Prime Day 2026 Told Retailers and Brands: A Category-by-Category Read from OpenBrand’s Analysts
Prime Day is no longer a two-day Amazon event that the rest of retail watches from the sidelines.…

What Prime Day Data Reveals About Consumer Behavior and Retailer Strategy
Over the last decade, Amazon Prime Day has evolved from a short-lived retail event into a…