


The Outdoor Power Equipment (OPE) market closed out 2025 with noticeable shifts in how share is won and defended across retailers and brands.
Q4 is always a defining quarter for the category. Seasonal demand, aggressive promotions, and heightened competition create conditions where even small execution differences can lead to meaningful share movement.
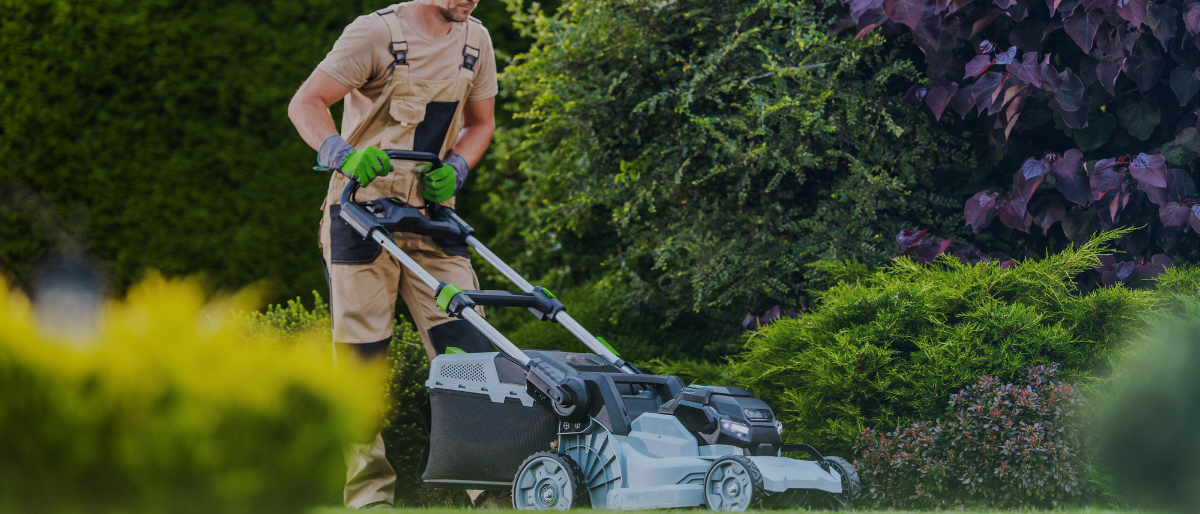
Our public MarketSignal dashboard shows that while category leaders remain firmly in place, momentum is beginning to shift, particularly as Amazon gains traction and value-driven brands continue to scale.
Key Takeaways
According to OpenBrand’s Q4 2025 OPE market intelligence data:
- Walmart continues to attract significant shopper traffic and is gaining share, but its draw rate still outpaces its close rate, signaling additional opportunity in conversion, assortment, and fulfillment.
- Ego continues to outperform expectations, maintaining a top-tier position in dollar share despite more limited consumer awareness relative to legacy brands.
- Home Depot and Lowe’s remain the defining forces in OPE, supported by Ryobi’s scale at Home Depot and a strong mix of Craftsman and Ego at Lowe’s.
- Women and Millennials are playing a larger role in shaping demand, influencing growth in battery-powered equipment, smart features, and more accessible product positioning.
Explore these and the rest of our latest insights or dive into the dashboard to see how the market is moving.
SOURCE: All data insights in this article cover OpenBrand Q3-Q4 2025 market intelligence data within an OpenBrand aggregate category of several products including Mowers, Handhelds, Snow Throwers and Pressure Washers.
Who are the top Outdoor Power Equipment retailers by market share?
According to OpenBrand’s Q4 2025 market intelligence data, the top OPE retailers are Home Depot and Lowe’s, leading in both unit and dollar share, with Amazon gaining ground in Q4.
Q4 performance points to a relatively stable competitive landscape, with incremental movement rather than major disruption across top retailers. Check out the retailer share growth from Q3 to Q4 2025, as well as the quarter-over-quarter (QoQ) percentage point (ppt) change below.
Note: OpenBrand’s share split is based on our retailer panel, which currently consists of Home Depot, Lowe’s, Amazon, Walmart, Ace Hardware, Best Buy, and Tractor Supply Co. These retailers make up a majority of non-individual dealer sales in the OPE industry.
Outdoor Power Equipment Retailer Unit Share Winners
| OPE Retailer | Q3 2025 Unit Share | Q4 2025 Unit Share | QoQ Change |
| Home Depot | 37.0% | 36.8% | -0.2 ppts |
| Lowe’s | 26.8% | 25.8% | -1 ppts |
| Amazon | 15.5% | 15.8% | +0.3 ppts |
| Walmart | 13.6% | 14.1% | +0.5 ppts |
| Ace Hardware | 5.9% | 6.2% | +0.3 ppts |
Outdoor Power Equipment Retailer Dollar Share Winners
| OPE Retailer | Q3 2025 Dollar Share | Q4 2025 Dollar Share | QoQ Change |
| Home Depot | 37.4% | 38.4% | +1.0 ppts |
| Lowe’s | 34.4% | 30.4% | -4.0 ppts |
| Amazon | 8.4% | 10.8% | +2.3 ppts |
| Walmart | 8.1% | 9.3% | +1.2 ppts |
| Ace Hardware | 5.3% | 9.5% | +4.2 ppts |
OpenBrand’s OPE Retailer Trend Insights
Amazon converts at the highest rate, turning efficiency into share gains. Amazon’s performance in Q4 highlights the importance of conversion over reach. With the highest close rate among major retailers (71.6%), it is able to translate a smaller shopper base (14.3% draw rate) into steady gains in both unit and dollar share. Its strength during key promotional periods further reinforces its role as a high-efficiency channel in the category.
Home Depot leads with scale and consistency across the funnel. Home Depot remains the most complete performer in OPE, combining the highest shopper reach (38% draw rate) with a strong close rate (68.3%). This balance allows it to maintain leadership in unit share while also expanding dollar share in Q4. The data points to continued strength in both traffic generation and higher-value product mix.
Lowe’s faces dollar share pressure despite stable traffic and units. Lowe’s held relatively steady in unit share and continues to attract strong shopper consideration, but its decline in dollar share (-4.0 pts QoQ) signals pressure in pricing or product mix. While it remains a key destination for shoppers, particularly those leaving Home Depot, Q4 results suggest challenges in maintaining value per transaction during a highly promotional period.
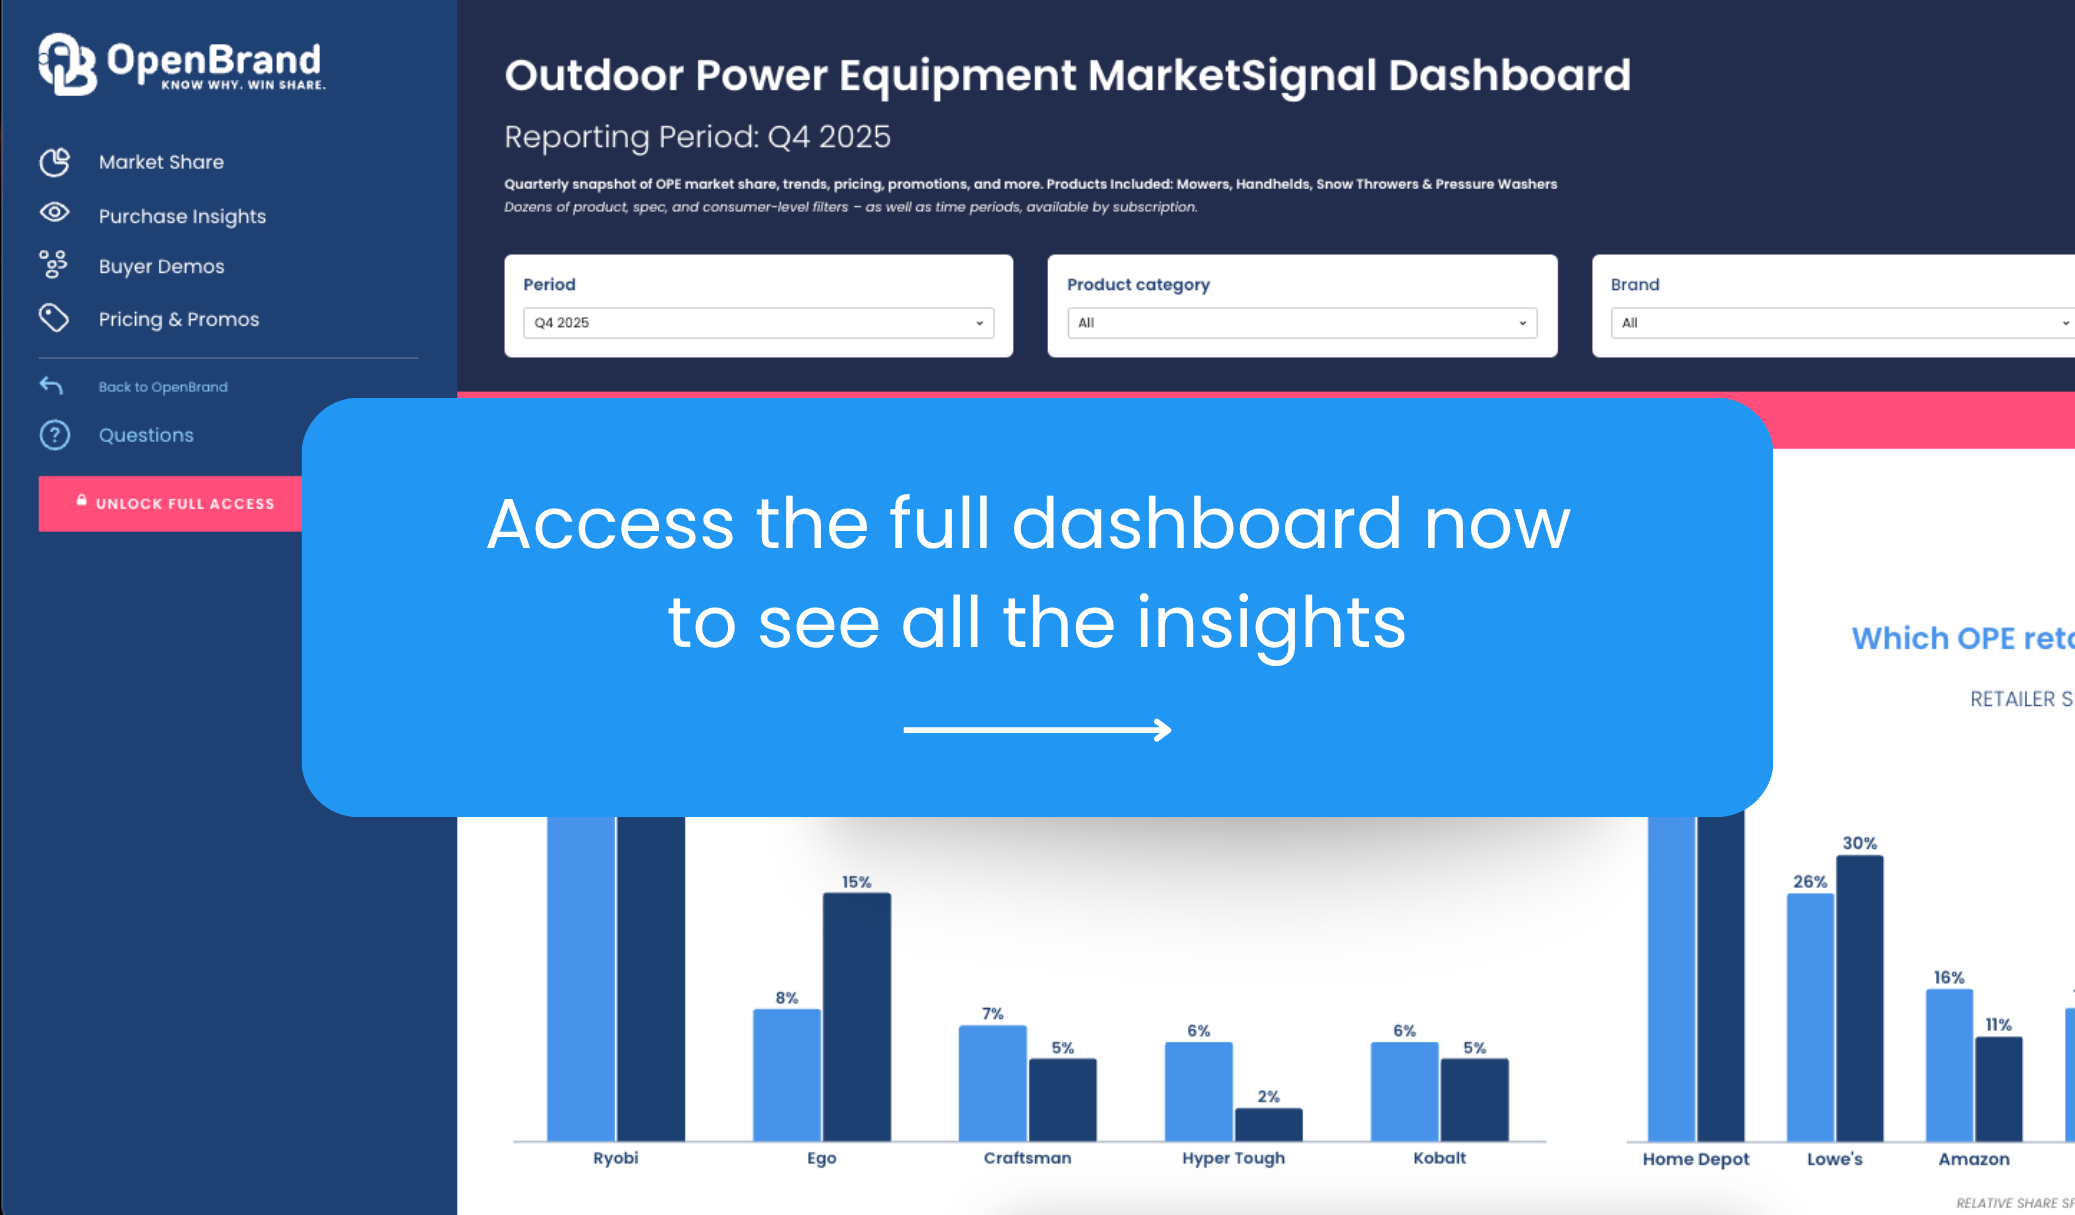
Outdoor Power Equipment Retailer Draw Rates
| Retailer | Q4 2025 Draw Rate | Q4 2025 Close Rate |
| Home Depot | 38% | 68% |
| Lowe’s | 33% | 57% |
| Walmart | 18% | 62% |
| Amazon | 14% | 72% |
| Ace Hardware | 7% | 60% |
OpenBrand’s OPE Retailer Trend Insights
Q4 continues to highlight the gap between attracting shoppers and converting them.
Walmart remains one of the most frequently considered retailers but continues to trail in conversion relative to its reach. Amazon, by contrast, converts at one of the highest rates, turning a smaller audience into stronger share gains.
Home Depot continues to lead in both reach and close rate, reinforcing its position as the most balanced retailer in the category. Lowe’s remains a critical alternative destination, particularly for shoppers who begin their journey at Home Depot.
Learn more about the impact of our leakage analysis: do you know who is winning your lost shoppers?
Who leads the Outdoor Power Equipment market share by brand?
According to OpenBrand’s Q4 2025 market intelligence data, the top three Outdoor Power Equipment brands are Ryobi, Craftsman, and Ego.
Outdoor Power Equipment Brand Unit Share Winners
| OPE Brand | Q3 2025 Unit Share | Q4 2025 Unit Share | QoQ Change |
| Ryobi | 22.2% | 23.9% | +1.8 pts |
| Craftsman | 10.2% | 9.2% | -1.0 pts |
| Ego | 7.8% | 8.4% | +0.6 pts |
| Hyper Tough | 6.1% | 5.7% | -0.4 pts |
| Kobalt | 5.1% | 5.5% | +0.4 pts |
Outdoor Power Equipment Brand Dollar Share Winners
| Outdoor Power Equipment Brand | Q4 2025 Dollar Share |
| Ryobi | 20% |
| Ego | 14.9% |
| Craftsman | 6.4% |
| Kobalt | 4.5% |
| Hyper Tough | 2.3% |
For more brand share insights, including share trend over time, access our public OPE dashboard now.
OpenBrand’s OPE Market Trend Insights
Ryobi converts scale into sustained category dominance. Ryobi continues to lead the OPE category by a wide margin, growing unit share to 23.9% in Q4 while maintaining strong conversion (72.2% close rate). Its ability to pair high consideration (12.1%) with efficient conversion reinforces its position as the default choice for many shoppers. This performance is further amplified by its exclusive alignment with Home Depot, allowing it to scale both reach and consistency across the purchase funnel.
Ego drives outsized dollar share through premium positioning. Ego continues to outperform on value, capturing 14.9% of dollar share on just 8.4% unit share. This gap highlights its strength in higher-priced products and its ability to convert shoppers seeking premium performance. While its consideration levels trail more established brands, its ability to monetize demand once in the funnel makes it one of the most efficient revenue drivers in the category.
Challenger brands compete through conversion, not consideration. Brands like DEWALT, Black & Decker, and John Deere demonstrate that high awareness is not required to win in OPE, but strong conversion is. Each posts close rates above 60%, with several exceeding 70%, indicating that when these brands enter the consideration set, they are highly competitive. Leakage data reinforces this dynamic, with DEWALT and Black & Decker capturing a meaningful share of Ryobi’s lost shoppers, signaling that value, trust, and positioning can overcome scale disadvantages at the point of purchase.
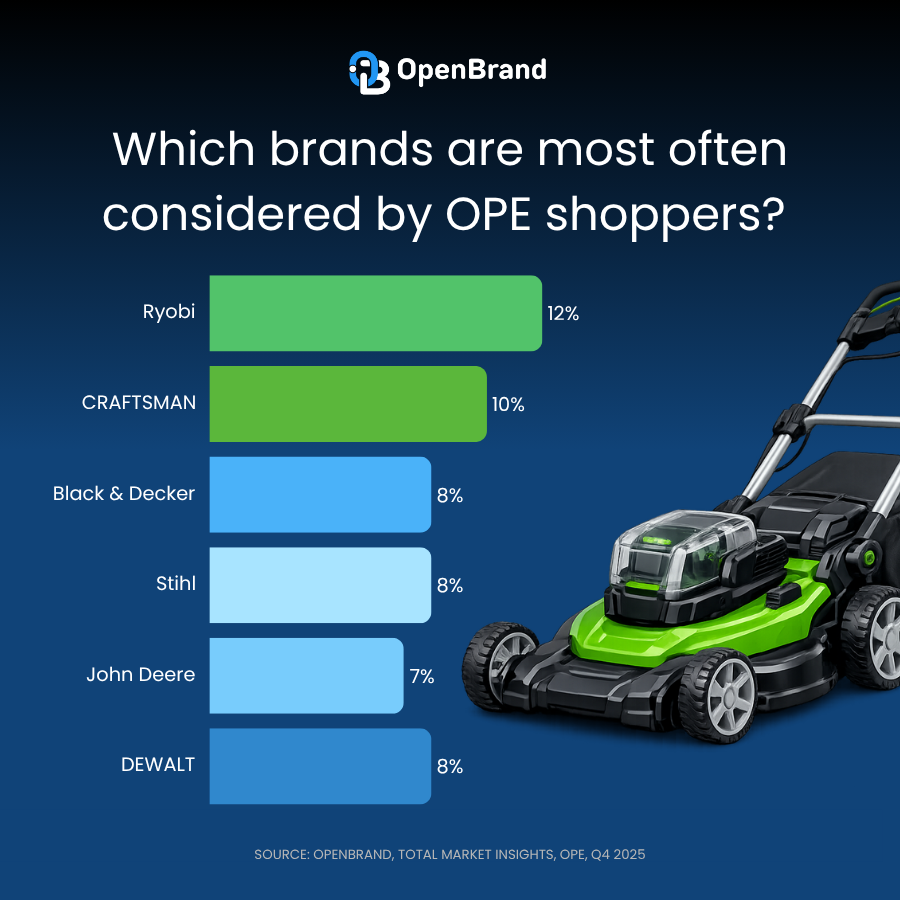
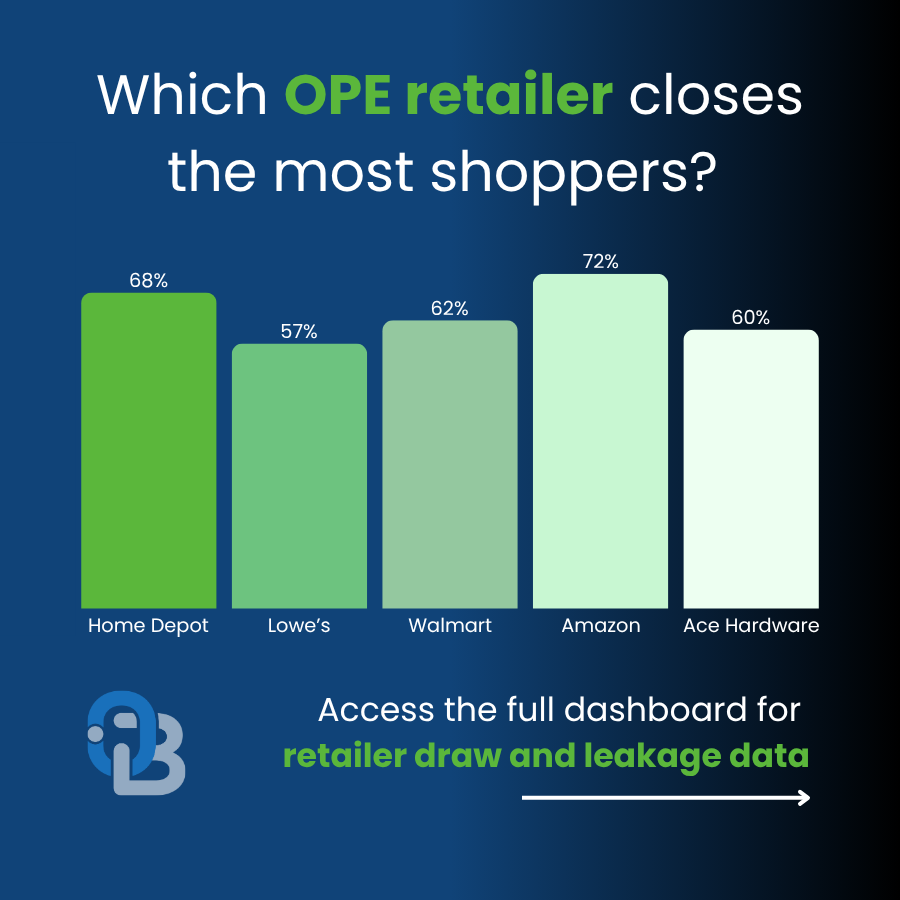
Brand Consideration Rates
When purchasing Outdoor Power Equipment, consumers consider the following three brands most often:
| Brand | Q4 2025 Consideration | Q4 2025 Close Rate |
| Ryobi | 12% | 72% |
| Craftsman | 10% | 63% |
| Stihl | 8% | 71% |
| DEWALT | 8% | 62% |
| Black & Decker | 8% | 75% |
| John Deere | 7% | 77% |
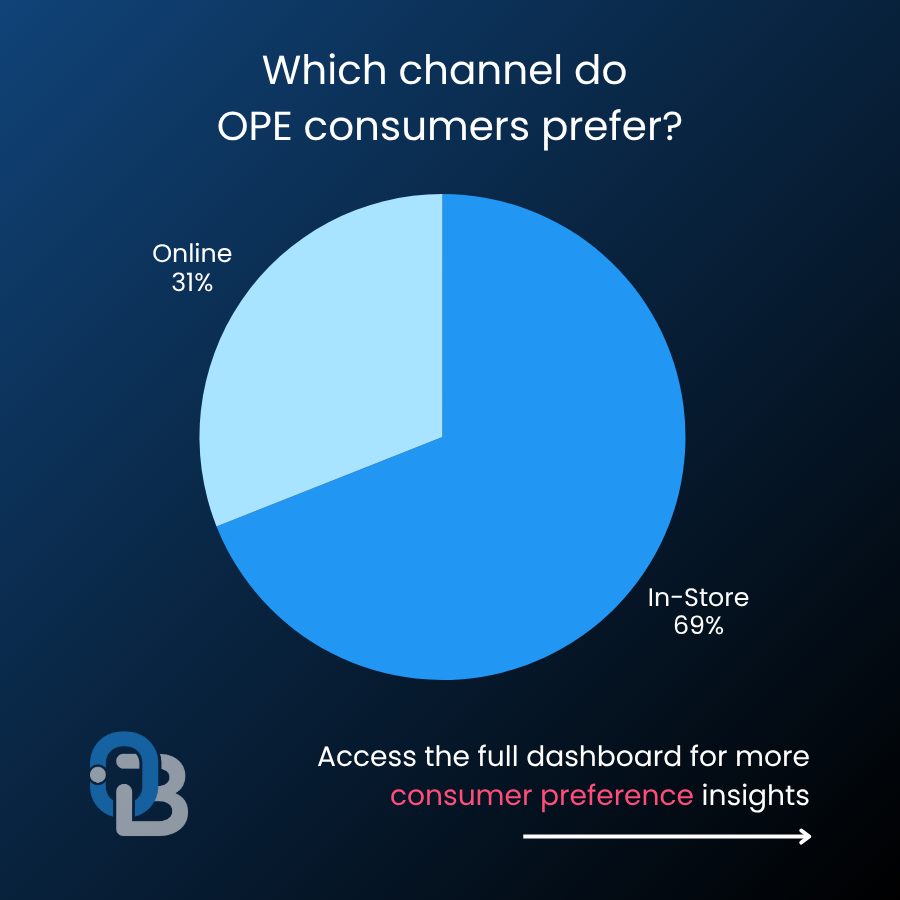
How are online and in-store sales trending for the Outdoor Power Equipment market?
According to OpenBrand’s MindShare consumer survey insights, Q4 2025, brick-and-mortar stores continued to dominate OPE sales, though online purchases have carved out nearly a third of the market:
- In-store: 69% of purchases
- Online: 31% of purchases
OpenBrand’s OPE Channel Trend Insights
Outdoor Power Equipment Consumer Demographics
OpenBrand’s consumer tracking survey provides a census-balanced view of who is purchasing Outdoor Power Equipment and how that profile is evolving over time.
In Q4 2025, the typical OPE buyer reflects a category still closely tied to homeownership and maintenance-driven needs:
- 76% of purchasers are homeowners, while 21% rent
- 55% of purchasers are married
- 69% of purchases were made by males only in the buying process, compared to 31% by females only
- Millennials accounted for 32% of purchases, followed by Gen X at 28%
OpenBrand’s OPE Consumer Trend Insights
OPE Purchase Drivers
Why do consumers select a specific retailer for purchase? According to OpenBrand, the most mentioned reasons for purchasing Outdoor Power Equipment at a specific retailer were:
Why consumers select a specific retailer
- Competitive price — 50.5%
- Good selection of products — 30.3%
- Convenient location — 20.7%
- Previous experience with store — 19.2%
Key OPE Pricing and Promotions Insights
Driving Share & Strategy in Q4 2025
Promotional activity played a critical role in shaping Outdoor Power Equipment performance in Q4 2025, particularly during key retail events such as Prime Big Deal Days and Black Friday/Cyber Week.
OpenBrand’s Pricing and Promotion Insights
- Promotional activity remained consistently high throughout Q4.
Across the full quarter, average promotional values stayed elevated, indicating sustained reliance on discounting rather than short-term spikes tied only to major events. - Discount rates were stable across the quarter.
Average discount percentages held within a relatively tight band week-to-week, suggesting that retailers maintained consistent promotional depth rather than increasing discounts late in the quarter. - Pricing variability was driven more by product mix than discounting changes.
While average net prices fluctuated throughout Q4, discount rates remained steady, pointing to shifts in product mix and assortment as the primary driver of pricing changes. - Promotional execution was continuous, not event-dependent.
Despite the presence of major retail moments in Q4, the data shows that promotions were deployed consistently across weeks, reinforcing that pricing strategy is an always-on lever in OPE. - Sustained discounting reinforces price sensitivity in the category.
The persistence of promotions and stable discounting levels aligns with broader purchase behavior, where price remains the top driver of retailer selection.
See more pricing and promotions data on the MarketSignal dashboard.
OPE Industry Outlook and Emerging Trends
What to expect in 2026 for the US Outdoor Power Equipment market?
The OPE market enters 2026 with continued momentum behind electrification, evolving consumer expectations, and increased pressure on retail execution. While category leaders remain stable, the drivers of growth are shifting.
OPE demand is stabilizing, but growth will hinge on the housing market.
With 75.5% of purchases tied to homeowners, the category remains closely linked to housing activity. As demand normalizes, future growth will depend heavily on homeownership trends, new construction, and ongoing property maintenance cycles.
Consumers remain highly value-focused, especially in digital channels.
With 50.5% of shoppers citing price as the primary purchase driver and discounting remaining consistent throughout Q4, value continues to dominate decision-making. This is especially evident online, where pricing transparency and comparison shopping are highest.
Cordless has effectively become the default fuel type.
The continued strength of brands like Ryobi (23.9% unit share) and Ego (14.9% dollar share) reflects growing consumer preference for battery-powered ecosystems, driven by convenience, lower maintenance, and platform compatibility.
Marketplaces are reshaping retail dynamics.
Amazon’s combination of the highest close rate (71.6%) and steady share gains highlights how marketplaces are influencing pricing expectations, fulfillment speed, and conversion behavior across the category.
Technology will define long-term competitive advantage.
As Millennials lead the category (32.4% of purchases), demand is shifting toward ease of use, connectivity, and performance. Brands that invest in battery innovation, smart features, and integrated ecosystems will be best positioned to win long-term.
Get more insight into Outdoor Power Equipment market trends
The market insights don’t stop here.
For more retail sales data, market share, and insights on the Outdoor Power Equipment industry, access the Outdoor Power Equipment MarketSignal dashboard now.

To see insights for other industries or find out how we can help power growth for your business, contact us today.
Frequently Asked Questions: Outdoor Power Equipment Market Share
Who has the highest market share in the Outdoor Power Equipment category?
According to OpenBrand’s Q4 2025 data, Home Depot leads all retailers in both unit share (36.8%) and dollar share (38.4%). Among brands, Ryobi holds the top position with 23.9% unit share and 20% dollar share — the largest of any single brand in the category.
Which OPE brand has the best close rate?
According to OpenBrand’s Q4 2025 data, John Deere leads all tracked brands with a 77% close rate in Q4 2025, followed by Black & Decker at 75% and Ryobi at 72%. These rates indicate that when shoppers consider these brands, they convert to purchase at a very high frequency.
Is Amazon gaining share in Outdoor Power Equipment? Y
es. According to OpenBrand’s Q4 2025 data, Amazon gained unit share (+0.3 ppts) and dollar share (+2.3 ppts) from Q3 to Q4 2025, and leads all retailers in close rate at 72%. Its growth reflects increasing consumer comfort with purchasing OPE online, particularly during promotional events like Prime Big Deal Days.
What percentage of OPE purchases happen online vs. in-store?
According to OpenBrand’s Q4 2025 data, in-store purchases continue to dominate at 69%, while online accounts for 31% of sales. Amazon is the primary driver of online momentum in the category.
Who is the typical Outdoor Power Equipment buyer?
Based on OpenBrand’s Q4 2025 consumer tracking survey, the typical OPE buyer is a homeowner (76%), married (55%), and male (69%). Millennials represent the largest generational segment at 32% of purchases, followed by Gen X at 28%.
What drives consumers to choose a specific retailer for OPE purchases?
According to OpenBrand’s Q4 2025 data, competitive price is the top driver, cited by 50.5% of shoppers. This is followed by good product selection (30.3%), convenient location (20.7%), and prior store experience (19.2%).
Why is Ego punching above its weight in dollar share?
According to OpenBrand’s Q4 2025 data, Ego captures 14.9% of dollar share on just 8.4% unit share in Q4 2025. This gap reflects its premium price positioning and its ability to convert shoppers who are specifically seeking high-performance, battery-powered equipment — making it one of the most revenue-efficient brands in the category.
Where can I access the full OPE market share data?
OpenBrand’s public OPE MarketSignal dashboard provides a quarterly snapshot at no cost, including brand share trends over time, draw and close rates, pricing and promotions data, and consumer demographics. To get current and historical market share data, contact OpenBrand today.