


From Prime Day in July to Prime Big Deal Days in the Fall and Amazon’s sales during Black Friday and Cyber Week, each new Prime sales Event reshapes how consumers shop, how brands promote, and how the broader market responds.
With continuously record-breaking participation across Amazon and its major retailer competitors, this latest Prime Event revealed meaningful shifts in spend, shopper intent, and promotional behavior across the durables market.
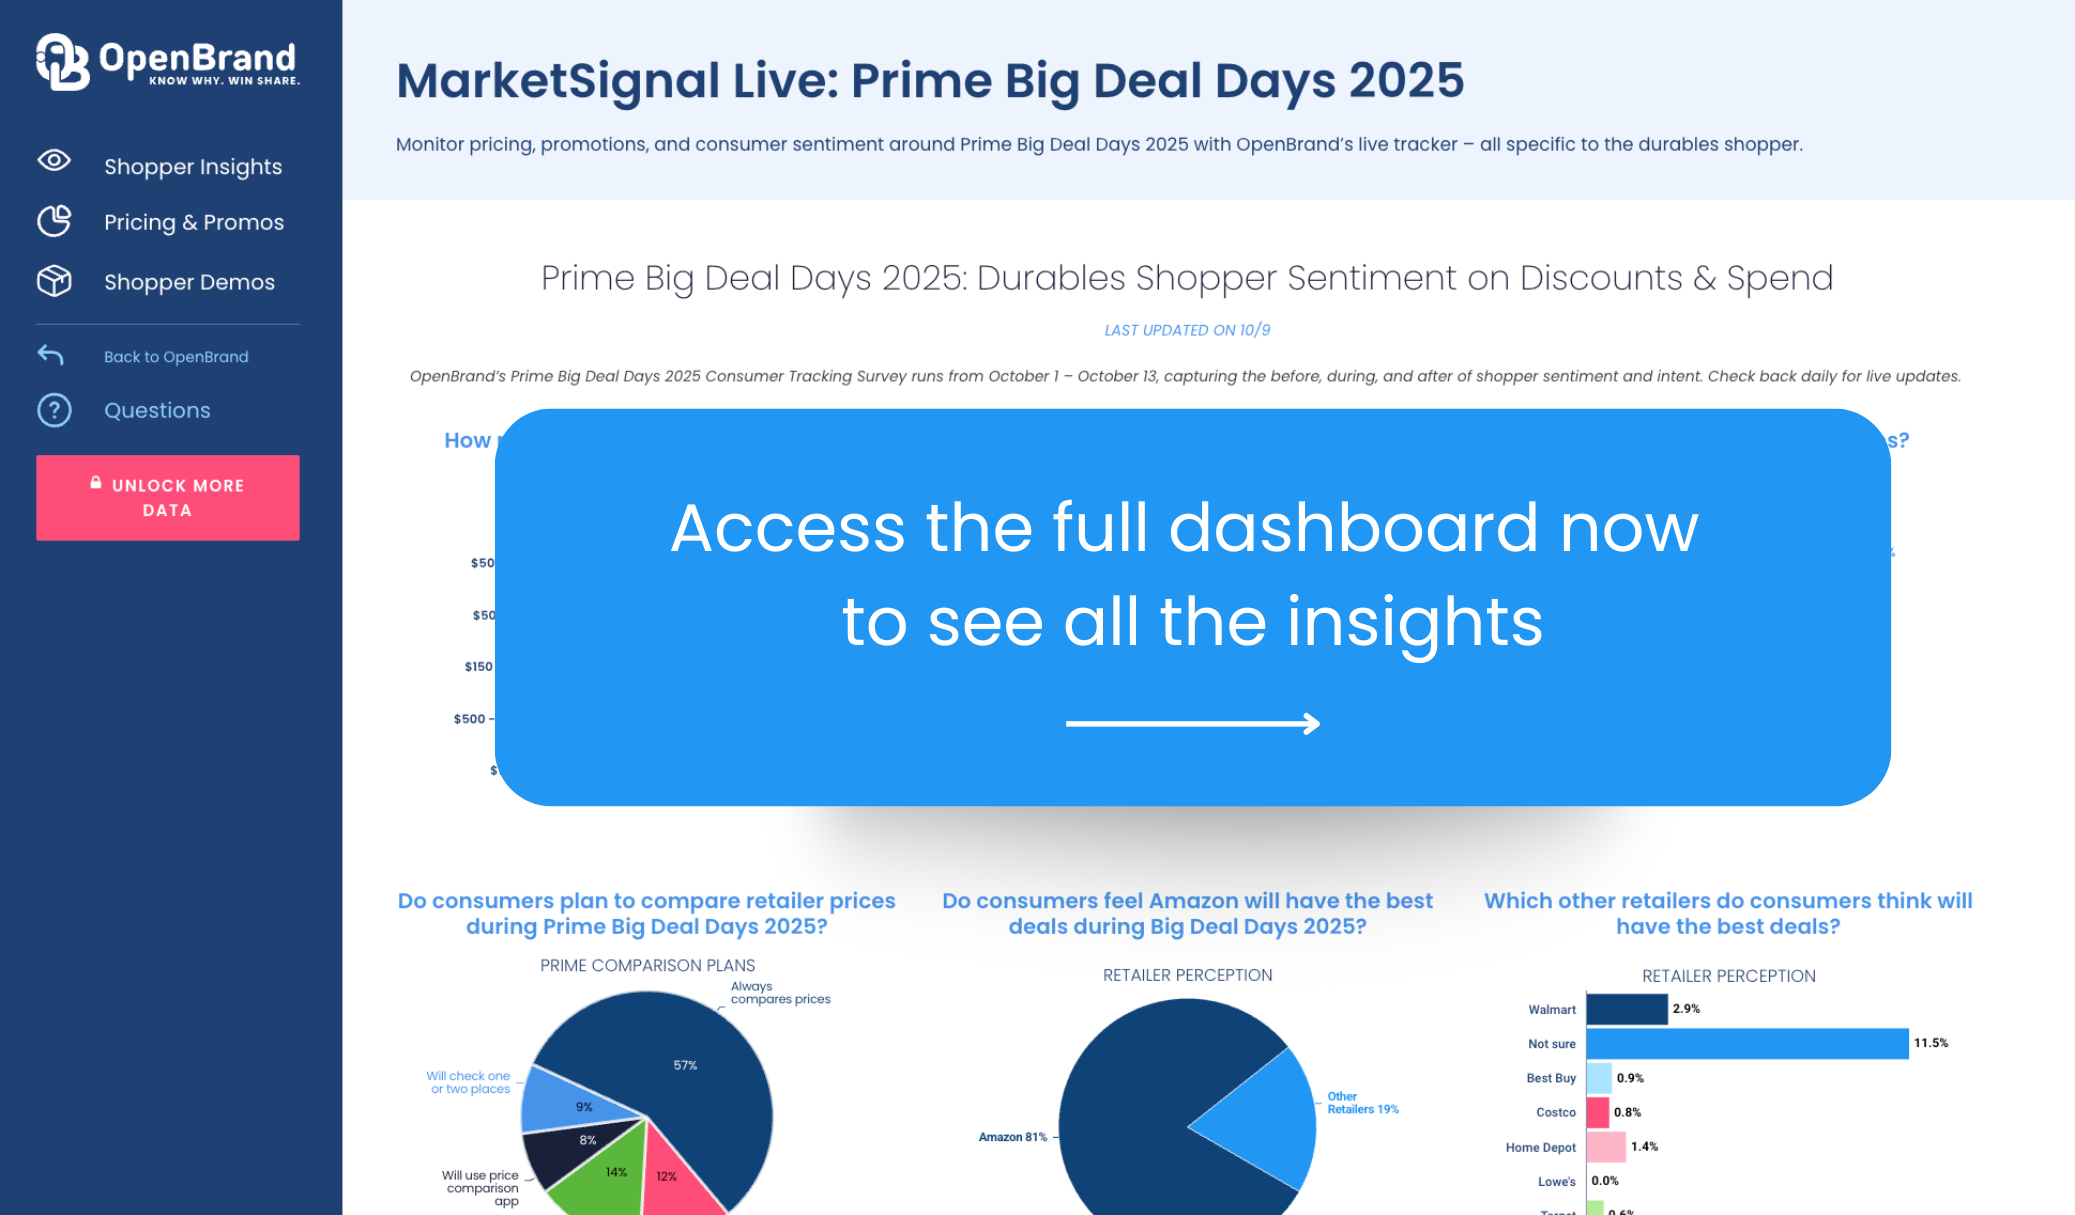
OpenBrand’s real-time Prime Day Sales Trends Trackers capture these movements as they happen, offering a category-level view into pricing, promotions, and shopper sentiment across the full event window.
SOURCE: All data insights in this article cover the rolling four quarter period ending Q1 2025 within the OpenBrand Market Measurement suite. This category covers an aggregate of several products including Refrigerator, Clothes Washer, Clothes Dryer, Dishwasher, Freezer, Free-Standing Range, Cooktop, Wall Oven, Compact Refrigerator, and Built-In Range.
Prime Big Deal Days 2025: Key Durables Market Insights
- Consumer intent vs. action diverged. Shoppers planned to buy Home Improvement (43%) and Small Appliances (35%), but actual purchases centered on Consumer Electronics (31%), Home Goods (30%), and Tools (12%)
- Consumer budgets tightened. The share spending under $150 rose from 57% planned to 67% actual, signaling increased price sensitivity or low promotional appeal
- Discounts deepened. Average markdowns ranged 20–25%, led by Recreation (TVs, Headphones) and Communication (Smartphones, Monitors, Wearables)
- Amazon still led (81%), but nearly 1 in 5 shoppers credited other retailers, with Walmart strongest among competitors
- Comparison is routine. 57% of shoppers always compare prices; only 14% buy solely on Amazon
- 9,345 unique promotions were tracked across durables
Durables-First Prime Day Data & Insights
Not all insights are created equal. As Prime events continue to set new records, OpenBrand delivers what others cannot: a complete view of the consumer durables shopper journey.
Most Prime Event recaps blend together consumer-packaged goods (CPG), perishables, and general merchandise. OpenBrand’s analysis focuses only on durable goods—where the products, price movements, and promotional dynamics behave entirely differently. [See what makes durables shoppers unique compared to CPG.]
By concentrating on high-consideration categories, OpenBrand provides clarity where it matters most: understanding how shoppers make complex purchase decisions, how promotions influence conversion, and how price perception shapes outcomes across the durables market.
OpenBrand’s live Prime Event Trackers presents a view of shopper behavior, promotional trends, and pricing effectiveness across durables categories to highlight where durables brands and retailers should focus heading into the next wave of key promotional events.
Check out the tracker now or read on below for a peek into data highlights for Prime Big Deal Days 2025.
Durables Shopper Intent vs. Actual Behavior
OpenBrand’s targeted Prime Consumer Tracker Survey runs before, during, and after the event, capturing intent and sentiment of shoppers specific to the consumer durables market. Respondents are classified based on the types of products they reported shopping for or purchasing, and all data is weighted against the U.S. Census.
Here are a few callouts of the data from OpenBrand’s latest survey on Prime Big Deal Days 2025.
What categories did most consumers purchase on Prime Big Deal Days 2025?
While most consumers entered Prime Big Deal Days planning to buy consumer electronics and home goods, the data below reveals how plans shifted once deals went live.

While these were still the top categories purchases, each saw nearly a 15-point gap between what consumers expected to buy and what they actually purchased.
In fact, every major durables category underperformed against pre-event intent, signaling that shoppers were more cautious and selective once live pricing and promotions appeared.
| Category | Planned Purchases | Actual Purchases | Change |
| Consumer Electronics | 44.9% | 30.7% | -14.2 ppt |
| Home Goods | 44.2% | 30.3% | -13.9 ppt |
| Large Appliances | 12.1% | 9.4% | -2.7 ppt |
| Small Appliances | 35.1% | 19.6% | -15.5 ppt |
| Tools | 22.2% | 12.3% | -9.9 ppt |
Small Appliances saw the steepest drop — from 35% planned to under 20% purchased — suggesting limited perceived value or competing category appeal.
This pattern indicates intent compression, where consumers start the event with broad shopping interest but narrow their spending to the most compelling promotions and visible deals once the event begins.

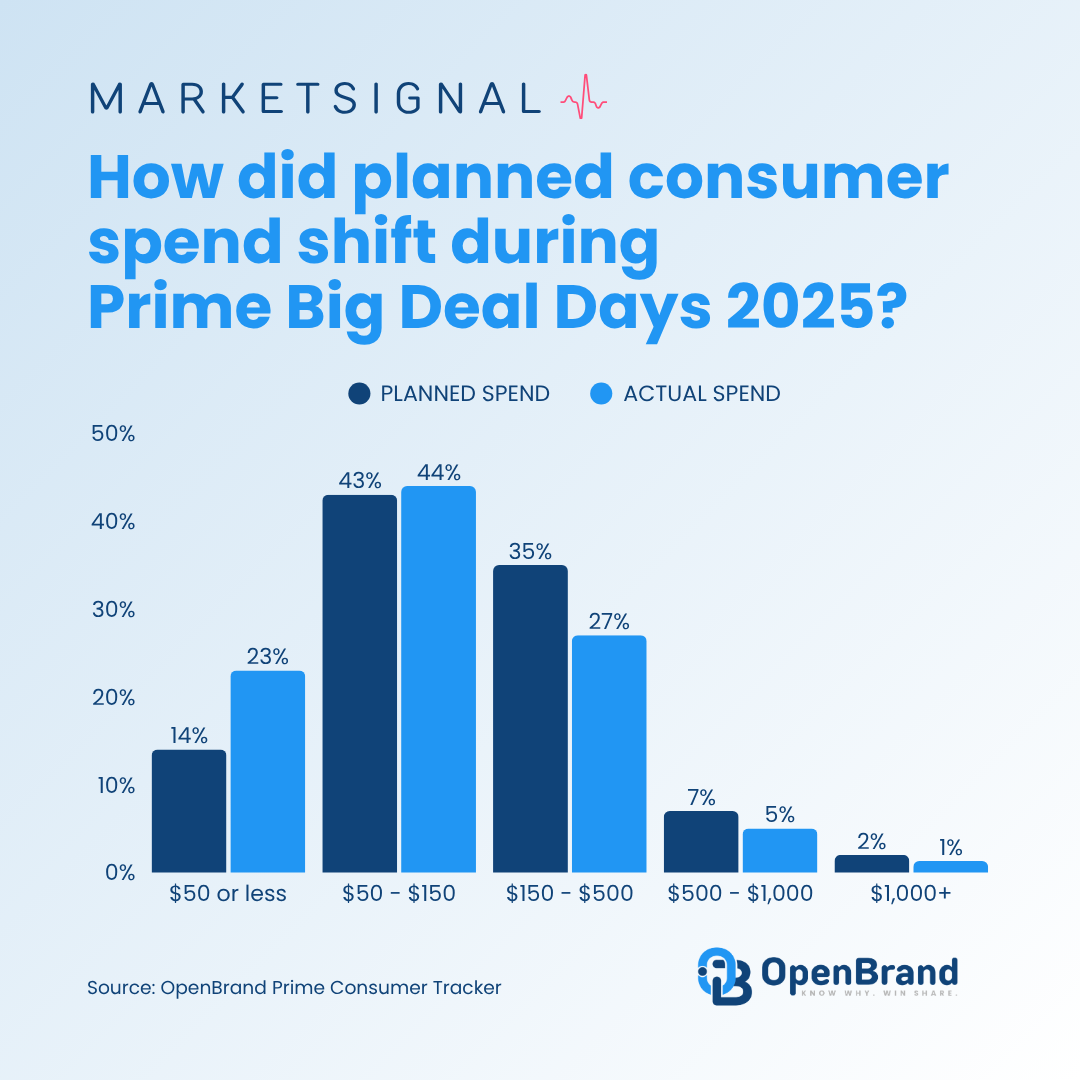
How much did consumers spend during the Prime Big Deal Days Event?
Nearly 60% of shoppers spent less than $150, even though most planned to spend more.
| Price Band | Planned Spend | Actual Spend | Change |
| $50 or less | 14% | 23% | +9 ppt |
| $50 - $150 | 43% | 44% | +1 ppt |
| $150 - $500 | 35% | 27% | -12 ppt |
| $500 - $1,000 | 7% | 5% | -2 ppt |
| $1,000+ | 2% | 1.3% | -0.7 ppt |
OpenBrand’s Insights Repackaged:
- A Return to Cautious Spending? The data points to a return to disciplined spending, even within deal-heavy environments — a shift that could reflect broader inflation fatigue or promotional fatigue in late 2025.
- Spending consolidated in the lower tiers, with the share of shoppers spending under $150 rising from 57% planned to 67% actual.
- The mid-tier ($150–$500) bracket fell by more than 7 points, showing reduced elasticity for higher-ticket items compared to previous events.
- This suggests consumers were more selective and budget-conscious, prioritizing categories with visible value and tangible discounts rather than larger discretionary purchases.
- Compared to July’s Prime Day 2025, this is a shift. Consumers planned to spend less, but ultimately spent more.
Pricing & Promo Performance: Data-Backed Tactics
OpenBrand’s pricing and promotions data was collected in real time during the Prime Big Deal Days sales event. Our optical processing technology interprets unstructured data with human-like understanding, enabling exceptional accuracy and market-scale visibility.
Across the internet, Prime Big Deal Days saw:
- 9,345 unique promotions
- 23% average discount across durables
- Highest discount percent: Vacuums at an average of 27.6% and TVs at an average of 26.9%
- Highest average savings: TVs at $384
While average discounts ranged from ~20% to 25%, the real takeaway lies in how shoppers responded to price-to-value balance by category.
| Category | Average Net Price | Average Savings | Average Discount |
| Recreation (TVs, Headphones) | $457 | $146 | 24.7% |
| Communication (Printers, Monitors, Smartphones, Tablets, Wearables) | $431 | $103 | 24.4% |
| Home Improvement (OPE & Tools) | $250 | $77 | 23.6% |
| Appliances (Large & Small) | $206 | $63 | 20.6% |
OpenBrand’s Key Takeaways
- Recreation and Communication categories (including TVs, headphones, and mobile devices) led the pack with discounts around 25%, generating the highest dollar savings per purchase.
- Home Improvement followed closely, signaling strong value-driven engagement even in mid-tier price ranges.
- Appliances saw more modest discounts (around 20%), suggesting brands maintained tighter control on margin while still leveraging deal visibility.
- Despite similar percentage discounts, higher-ticket categories produced greater perceived value, reinforcing why consumers often shift their actual spending toward them once events begin.
To see the breakdown by product, check out the latest Prime tracker.
Retailer Behavior: How Shoppers Compared Deals and Where They Found the Best Value
What started as a single-platform sales event has evolved into a retail ecosystem moment. Each new Prime Event now sparks participation across the entire marketplace, with major retailers launching competing promotions and consumers using every tool available to compare prices in real time.
For durables shoppers, that means “Prime” no longer begins and ends with Amazon. Now, it defines a multi-retailer, multi-channel buying window where value perception, pricing transparency, and promotional timing determine who wins the sale.
Price Comparison Is Now a Standard Behavior
Durables shoppers are entering each event more analytical than ever. According to OpenBrand’s tracker, 57% of consumers say they always compare prices, while another 9% check one or two other sources before purchasing.
Even in a Prime-branded event, only 14% of shoppers say they buy exclusively on Amazon. Nearly one in five now use dedicated price comparison apps, confirming that deal validation is part of the modern shopping routine.
| Price Comparison Behavior | Share of Shoppers |
| Always compares prices | 57.2% |
| Will check one or two places | 8.9% |
| Will use a price comparison app | 7.7% |
| Only shops Amazon | 14.2% |
| Might compare but no plans | 12.1% |
OpenBrand’s Insights Repackaged: Shoppers are consciously verifying value across platforms before committing to a purchase, even during sales event like Prime Days.
Amazon Still Leads, but Competitors Earn Credibility
Amazon continues to set the benchmark for deal quality, with 81% of shoppers naming it as offering the best discounts. Still, nearly 19% credited other retailers, proving that the competitive halo around Prime Events is real and growing.
| Retailer | Share of Shoppers Naming “Best Deals” |
| Amazon | 81.2% |
| Other Retailers (combined) | 18.8% |
| – Walmart | 2.9% |
| – Best Buy | 0.9% |
| – Costco | 0.8% |
| – Home Depot | 1.4% |
| – Not Sure | 11.5% |
Walmart continues to hold the strongest non-Amazon position, followed by Best Buy, Costco, and Home Depot—all of which benefit from spillover traffic as shoppers cross-check pricing and promotions during the Prime window.
Get all the Prime Big Deal Days insights and prepare for the next big event
If you’re planning for other promotional events, now is the time to rebuild your promotional playbook with data that cuts out the manual work so you can spend more time acting on what’s happening in the market.
Are you tracking the market in real-time? Let’s get you the insights you need — before the next big event hits. Book a 15-minute conversation now to get started.