




Apple ended Q1 2026 with 19.1% of computing units, its highest position in five quarters and more than four points above where it sat a year ago. The computing market share story underneath that number is less settled. Samsung and Amazon both gave up ground, and Lenovo posted the largest single-quarter gain of any tracked brand while holding the weakest close rate in the category.
Best Buy and Amazon define retail in desktops, notebooks, monitors, tablets, and wireless routers, but they win on opposite measures. Amazon moves more units. Best Buy captures more dollars. The distance between those two facts is the most useful thing in the quarter’s retailer data.
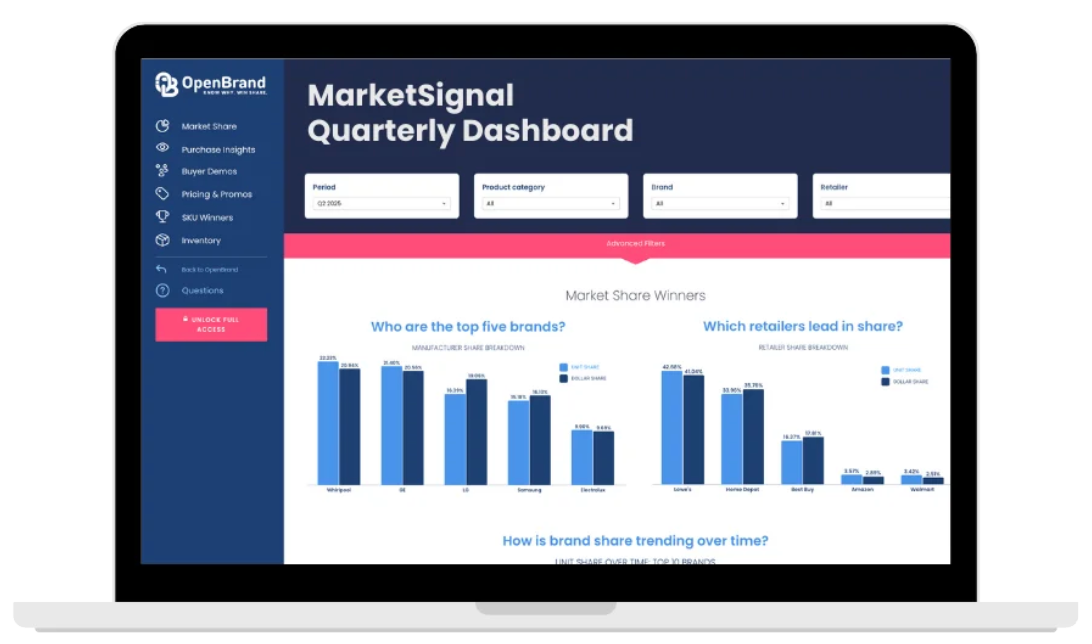
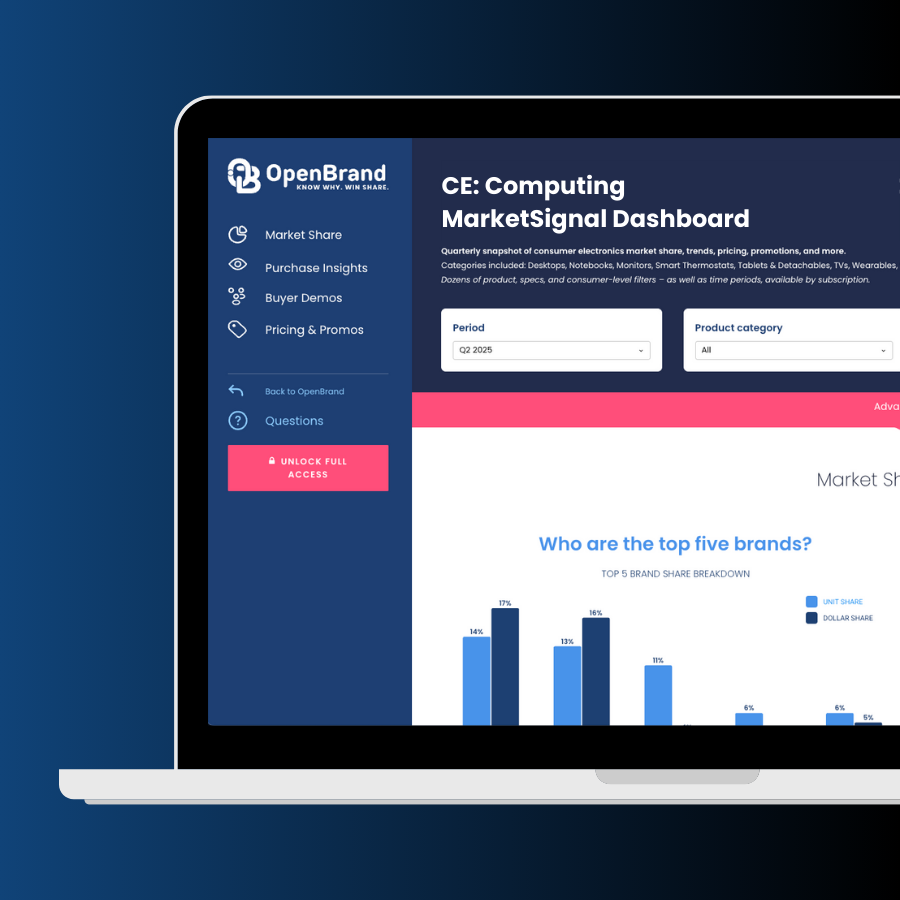
Our public MarketSignal Computing dashboard tracks how these shifts are playing out across retailer performance, brand share, pricing, and consumer behavior.
Keep reading for the Q1 2026 findings, or open the dashboard for the full view.
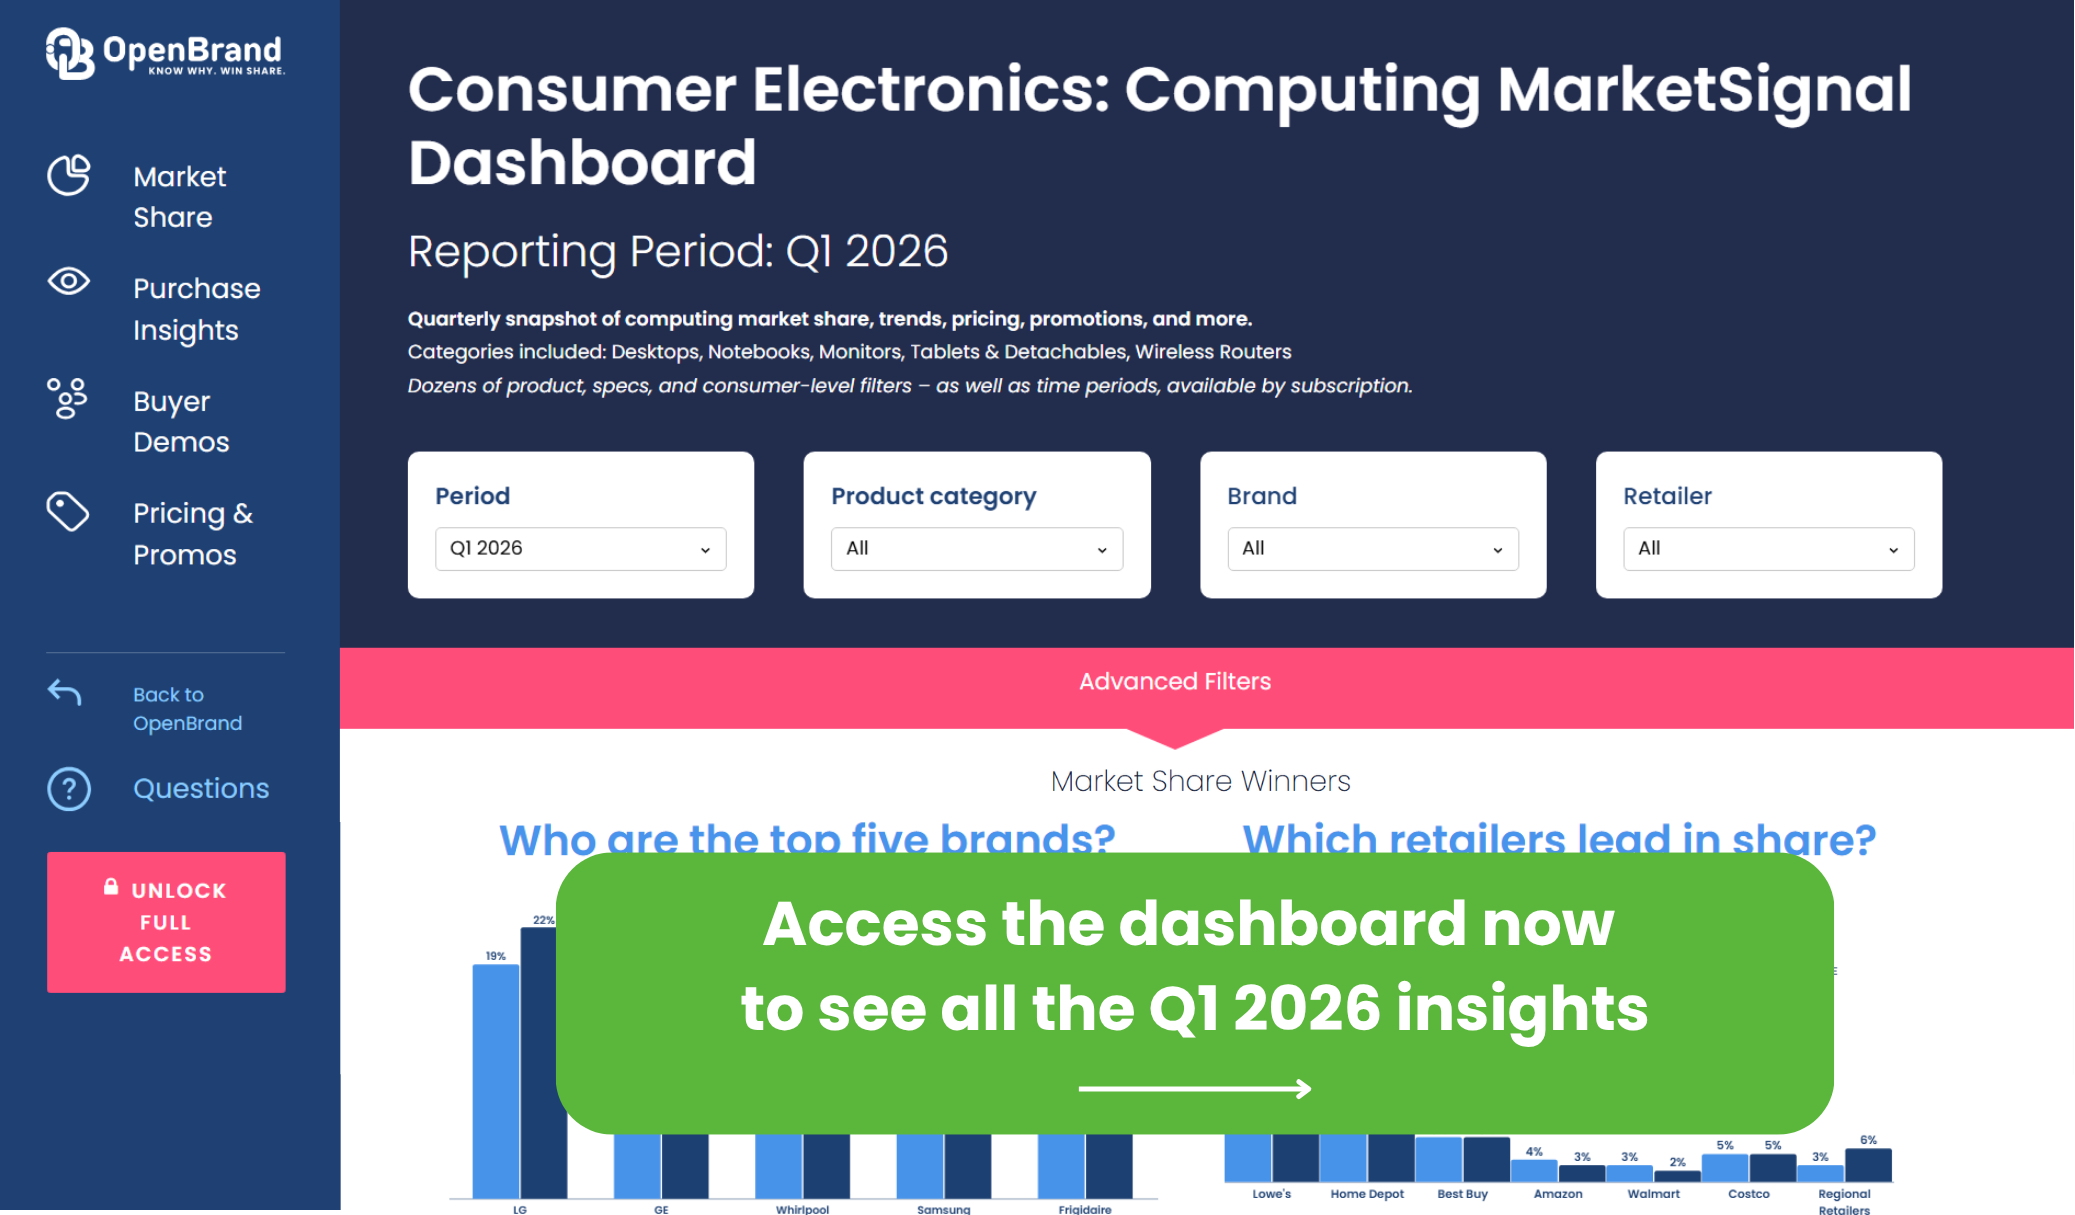
Category Grouping Note: All data insights in this article reflect Q1 2026 data from an OpenBrand aggregate category that includes Desktops, Notebooks, Monitors, Tablets & Detachables & Wireless Routers
Key Takeaways: Q1 2026 Computing Market
- Apple reached 19.1% unit share, a five-quarter high, up from 14.8% in Q1 2025 and 18.9% in Q4 2025
- Amazon leads units at 40.6% while Best Buy leads dollars at 49.8%, converting a smaller share of volume into half the category’s revenue
- Lenovo gained 1.0 point to 4.6% unit share, the largest brand gain of the quarter, despite the lowest close rate among major brands at 56%
- Samsung fell to 6.2% unit share (-0.9 pts QoQ), its lowest in five quarters
- Online holds a narrow 51% of purchases against 49% in store, the closest channel split of any durables category OpenBrand tracks
- Generational demand is nearly flat: Millennials 28%, Gen X 24%, Gen Z 23%, Baby Boomers 23%
- Apple Stores close 81% of the shoppers they draw, the highest conversion of any outlet in the panel
Who are the top retailers for Personal Computer market share?
According to OpenBrand’s Q1 2026 market data, Best Buy and Amazon continue to lead computing retail, with Best Buy taking the larger share of dollars and Amazon the larger share of units.
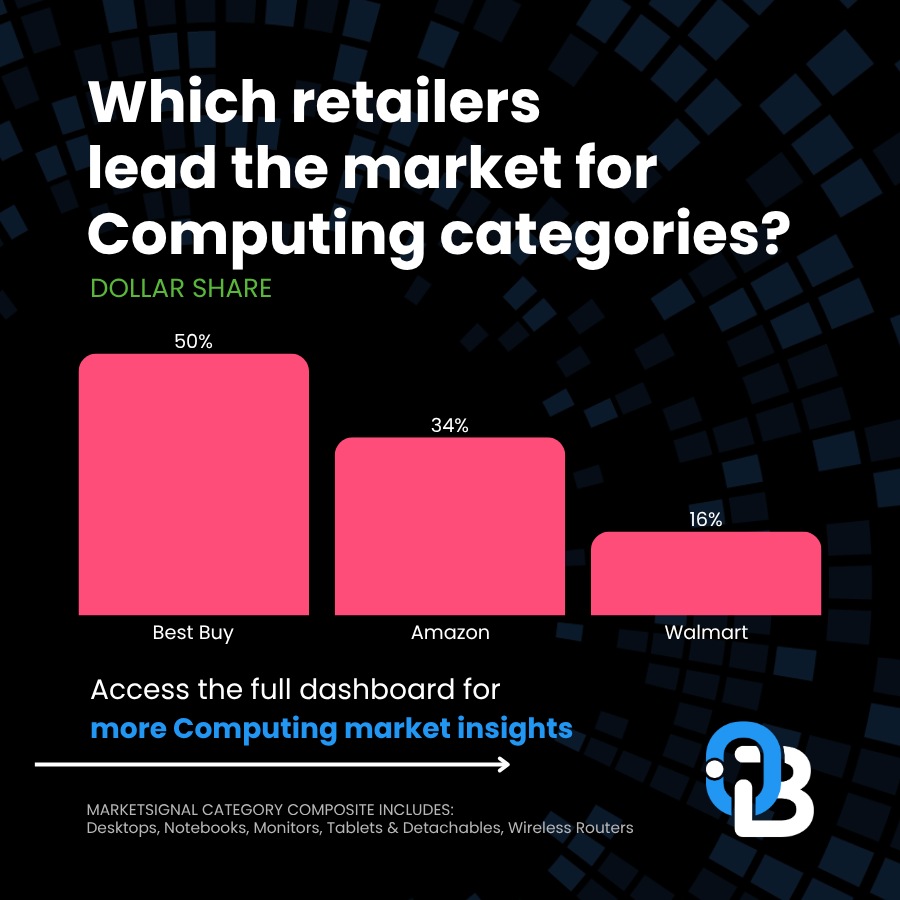
Q1 2026 Computing Retailer Dollar Share Winners
| Computing Retailer | Q1 2026 Dollar Share |
| Best Buy | 49.8% |
| Amazon | 34.0% |
| Walmart | 16.0% |
Q1 2026 Computing Retailer Unit Share Winners
| Computing Retailer | Q1 2026 Unit Share |
| Amazon | 40.6% |
| Best Buy | 36.7% |
| Walmart | 22.5% |
Note: OpenBrand’s share split is based on our retailer panel, which currently consists of Home Depot, Lowe’s, Amazon, Walmart, and Best Buy. Retailers with >1% share are not shown. More retailers are coming soon.
Q1 2026 Computing Retailer Draw Rates
According to OpenBrand’s consumer survey data, the top computing retailers rank as follows on shopper traffic:
- Best Buy draws 32% of all computing shoppers
- Amazon and Walmart tie at 27%
On conversion, Best Buy closes 72% of the shoppers it draws and Amazon closes 71%, while Walmart trails at 61%.
OpenBrand’s Computing Trend Insights
Best Buy converts a minority of units into half the category’s dollars. Best Buy takes 36.7% of computing units and 49.8% of dollars, a 13.1 point positive gap. Amazon runs the inverse, turning 40.6% of units into 34.0% of dollars. Amazon leads volume by 3.9 points and still trails on revenue by 15.8. The two retailers are selling fundamentally different baskets, and a buyer benchmarking against unit rank alone will misread which account carries the premium business.
Best Buy’s leakage splits almost evenly between its two rivals. According to OpenBrand’s Q1 2026 leakage data, 28% of shoppers who consider Best Buy buy elsewhere. Walmart captures 29% of those lost shoppers and Amazon 28%, with Apple taking 11% and Costco 6%. No single competitor is pulling Best Buy’s traffic away, which means the defense is a general one rather than a head-to-head fight.
Apple Stores convert better than any retailer in the category. Apple draws just 12% of computing shoppers but closes 81% of them, the strongest conversion in the panel. Target sits at the opposite pole, drawing 8% of shoppers but closing only 29%. Reach and conversion are running almost inversely across the smaller outlets.
Who leads the Computing market share by brand?: Apple Market Share Wins & More
According to OpenBrand’s Q1 2026 market data, Apple leads computing in both unit and dollar share, and its lead in dollars is far wider than its lead in units.
Q1 2026 Computing Brand Dollar Share
| Computing Brand | Q1 2026 Dollar Share |
| Apple | 27.6% |
| HP | 14.6% |
| Samsung | 4.6% |
| TP-Link | 2.7% |
| Amazon | 1.8% |
Q1 2026 Computing Brand Unit Share
| Computing Brand | Q1 2026 Unit Share |
| Apple | 19.1% |
| HP | 12.6% |
| TP-Link | 8.8% |
| Samsung | 6.2% |
| Amazon | 5.9% |
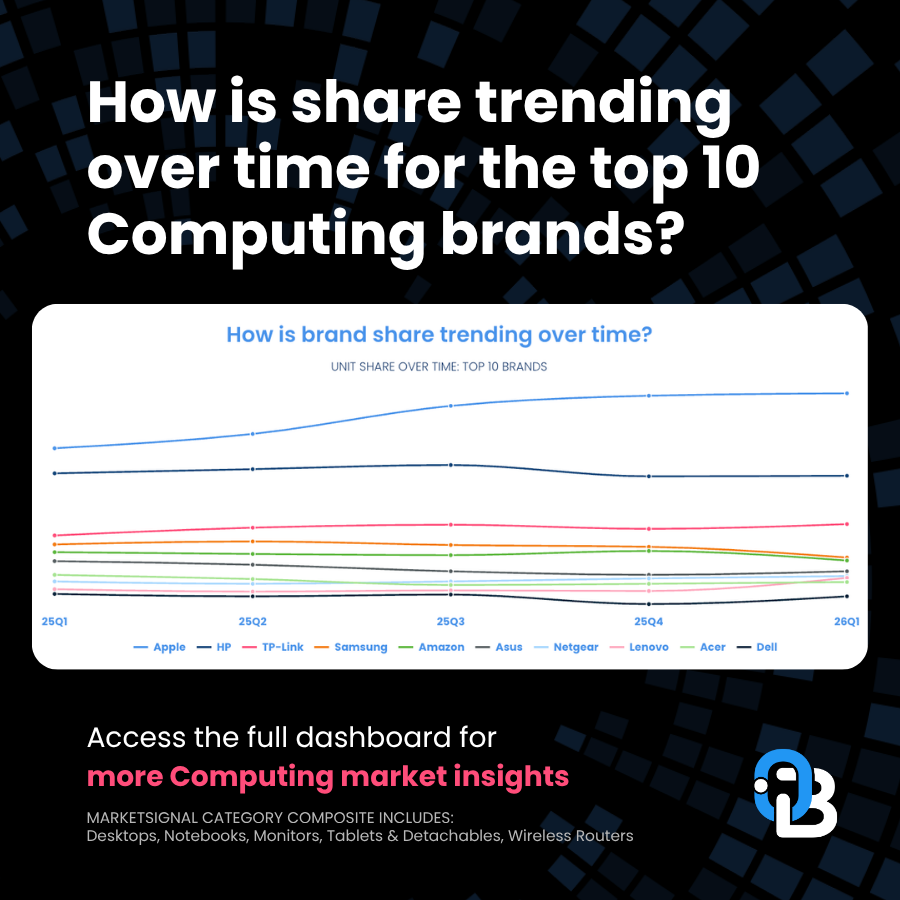
For more brand share insights, including data on these share trends over time, access our public Consumer Electronics: Computing dashboard now.
Computing Brand Consideration Rates
When purchasing desktops, monitors, notebooks, tablets and detachables, and wireless routers, consumers consider the following brands most often, per OpenBrand’s Q1 2026 survey data:
- Apple: 28%
- HP: 23%
- Dell: 22%
- Samsung: 12%
- Lenovo: 10%
- Kindle: 4%
OpenBrand’s Computing Trend Insights
Apple leads consideration and conversion at the same time. Apple draws 28% of computing shoppers against HP at 23% and Dell at 22%, then closes 74% of them where HP closes 66% and Dell 61%. Winning both ends of the funnel is what carried Apple to 19.1% of units, up from 14.8% in Q1 2025 according to OpenBrand’s five-quarter brand series. The climb has been steady across every quarter in that span rather than concentrated in a single move.
Lenovo gained the most share while converting the least. Lenovo added 1.0 point to reach 4.6% unit share, the largest single-quarter gain of any brand OpenBrand tracks in computing. It did this with a 56% close rate, the weakest among the major brands, and only 10% consideration. A brand growing share on a small, poorly converting funnel is growing on availability and price position rather than preference, which makes the gain worth watching but not yet worth assuming will hold.
Unit share and dollar share have decoupled at the bottom of the table. TP-Link holds 8.8% of computing units but only 2.7% of dollars, and Amazon holds 5.9% of units against 1.8% of dollars. Both brands sell high-volume, low-ticket hardware, routers in one case and Kindles in the other, which inflates unit rankings in a category where a single Apple notebook can carry the dollar weight of a dozen competing SKUs. Buyers reading a unit-share table alone will misjudge who actually drives category revenue.
Apple’s own leakage goes to the PC field, not to a single rival. According to OpenBrand’s Q1 2026 leakage data, 26% of shoppers who consider Apple buy something else. Dell wins 22% of them and HP 22%, with Samsung at 15% and Lenovo at 10%. Apple loses shoppers to the Windows category broadly rather than to one challenger.
Explore the drivers and promotions data behind these conversion patterns in our quarterly Consumer Electronics: Computing MarketSignal dashboard.
How are online and in-store sales trending for the Consumer Electronics market?
In Q1 2026, online remained the majority channel for computing purchases, but its lead narrowed sharply.
- In-store: 49% of purchases
- Online: 51% of purchases
OpenBrand’s Computing Trend Insights
Computing is the most evenly split category OpenBrand tracks. Online holds 51% of purchases and in-store 49%, a two point separation. Categories like major appliances and outdoor power equipment run roughly seven in ten purchases through physical retail. Computing is the outlier, and planning against a durables-wide channel assumption will misallocate spend here.
Even so, the dollars concentrate in stores. Best Buy holds the largest dollar share in the category and the strongest draw rate among the national accounts, and Apple Stores post the highest close rate of any outlet at 81%. Volume splits close to evenly. Higher-ticket transactions still close in person.
Computing Consumer Demographics
Who is buying desktops, monitors, notebooks, tablets and detachables, and wireless routers? OpenBrand profiles the typical buyer using results from our census-balanced consumer durables tracking survey.
As of Q1 2026, computing purchasers showed the following traits:
- 60% of purchasers are homeowners, 37% rent
- 48% of purchasers are married
- 56% of purchases involved males in the buying process, 44% involved females
- 28% of purchases were made by Millennials, followed by Gen X at 24%, Gen Z at 23%, and Baby Boomers at 23%
OpenBrand’s Computing Trend Insights
Computing has the flattest generational profile of any durables category OpenBrand tracks. Four generations sit within five points of each other, with Millennials leading at 28% and Gen Z, Gen X, and Baby Boomers effectively tied behind them. Most durable goods categories concentrate demand in two generations. Computing does not.
The practical consequence is that segmentation by age produces almost no signal here. Renters at 37% of purchasers and household size, where one and two person homes account for 55% of purchases, are the more useful cuts for assortment and messaging decisions.
Purchase Drivers for Computing Products
According to OpenBrand’s Q1 2026 consumer insights, the most frequently mentioned reasons for purchasing computing products at a specific retailer were:
Why consumers select a specific retailer
- Competitive price: 54%
- Good selection of products: 31%
- Previous experience with store: 27%
- Convenient location: 16%
Price decides more than half of retailer choices, which is unsurprising in a category where cross-shopping is a click away. The ranking underneath it is the more interesting part. Previous experience with the store, at 27%, outweighs convenient location at 16% by a wide margin. Proximity barely registers when half the category buys online, and the retailer relationship is doing the work that location does in other durables categories.
Get more Consumer Electronics: Computing market share trends
Apple is at a five-quarter high, Lenovo is gaining on a funnel that should not support it, and the two largest retailers in the category are winning on opposite measures. Reading any one of those in isolation gets you the wrong strategy.
For full retail sales data, brand and retailer share, draw and close rates, and consumer behavior across the computing category, access the Consumer Electronics: Computing MarketSignal dashboard.
To see insights for other industries or find out how we can help power growth for your business, contact us today.
Frequently Asked Questions: Computing Market Share
Who has the largest computing market share in 2026?
Apple leads computing brands with 19.1% of units and 27.6% of dollars in OpenBrand’s Q1 2026 data, its strongest position in five quarters. Among retailers, Amazon leads on units at 40.6% while Best Buy leads on dollars at 49.8%.
Why does Amazon sell more computing units than Best Buy but earn fewer dollars?
Mix. OpenBrand’s Q1 2026 data shows Amazon at 40.6% of units against 34.0% of dollars, while Best Buy converts 36.7% of units into 49.8% of dollars. Amazon’s volume skews toward lower-ticket hardware including routers and e-readers, where Best Buy carries a heavier share of premium notebooks and desktops.
Which computing brand converts shoppers most efficiently?
Kindle, at an 85% close rate in OpenBrand’s Q1 2026 tracking, though it draws only 4% of shoppers. Among brands with meaningful reach, Apple leads at 74%, followed by HP at 66% and Dell at 61%.
Do more people buy computing products online or in store?
Online held 51% of computing purchases against 49% in store in OpenBrand’s Q1 2026 survey data, a near-even split. Computing runs more digital than durables categories like major appliances and outdoor power equipment, where roughly seven in ten purchases happen in a physical store.
Who is the typical computing buyer?
OpenBrand’s Q1 2026 consumer tracking survey profiles the typical buyer as a homeowner (60%), male-involved (56%), and slightly more likely to be single than married (48% married). Generational demand is unusually flat, with Millennials at 28% and Gen Z, Gen X, and Baby Boomers all within a point or two of each other.
Where did Apple’s lost shoppers go in Q1 2026?
Apple’s walk rate was 26% in OpenBrand’s Q1 2026 leakage data, with Dell capturing 22% of those shoppers, HP 22%, Samsung 15%, and Lenovo 10%. The leakage spreads across the Windows field rather than concentrating with any single competitor.
