


Price Forecasts for Durables in 2026: Consumer Electronics, Appliances & Home Improvement
Modest inflation will drive incremental durables market growth in the year ahead
As short-term tariff swings ease and economic policy uncertainty fades, we anticipate 2026 will mark a period of stabilization, including within the durables sector. Though we expect stabilization, it’s important to acknowledge that short-term political volatility will likely continue as a strategic tool of the current administration. The durables industry has proven to be durable (pun intended), and we expect that durability to persist through it.
The limited expansion in market size we expect this year is likely to be driven primarily by incremental price increases following recent Fed rate cuts. We project durables market growth to reach its high point in July, coinciding with the largest price adjustment, before slowing through the rest of the year.
One of the large wildcards this year will be the tone set by the Federal Reserve Chair nominee Kevin Warsh. We expect Warsh to push for a lower interest rate environment, and there is a reasonable possibility of a moderate upside deviation to our forecasts below.
Read on for OpenBrand’s price and growth expectations across consumer electronics, appliances, and home improvement in the year ahead.
Appliances: Market Size Growth Hindered by Price Deceleration
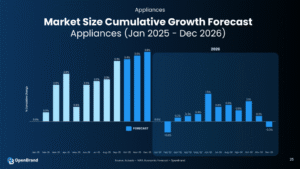
Prior to the new tariffs that were implemented in 2025, appliances (see appliance product list) had been on a downward price trajectory for a number of years. While short-term tariff-related price increases led to growth in the cumulative size of the appliance market last year, we anticipate that prices will decelerate again in the months ahead.
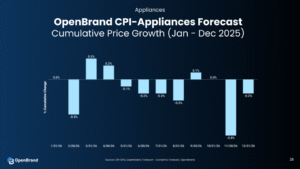
The deflationary environment for appliances will outpace our forecast for a slight pickup in unit sales this year, resulting in modest to negative market size growth. In other words, we expect that more appliances will be sold in 2026, but at lower, or slower, growing prices. OpenBrand daily pricing data and durables tracking survey shows that consumers are still buying appliances, but they are delaying upgrades when possible and trading down on features rather than exiting the category. That means that incremental, mid-tier upgrades are under the most pressure.
Regardless of the economic cycle, appliances are a replacement-driven category which makes it more resilient. In 2026, the most successful businesses will likely be the ones that implement pricing discipline and clear value positioning.
Home Improvement: Rate Cuts Will Support DIY, Construction Rebound
The home improvement category (see HI product list) depends largely on the health of the housing market, which we expect will begin to show signs of a turnaround in 2026. That recovery is largely tied to the Fed’s recent rate cuts, which will also drive down borrowing costs. We expect existing home sales to recover in the second quarter, boosting demand for DIY-related categories like tile, roofing, and paint. New home sales should gain momentum in the fourth quarter, which is likely to support increased demand for higher-end, professional-grade tools tied to new construction and home upgrades.
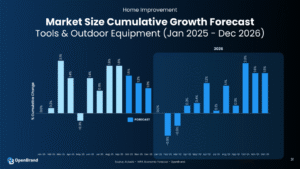
While growth in retail sales at home improvement stores was negative for nearly all of 2025, we expect a recovery this year, particularly in the second half. The return to growth doesn’t necessarily indicate a boom for home improvement retailers, but it does reflect a normalization after a slow year.
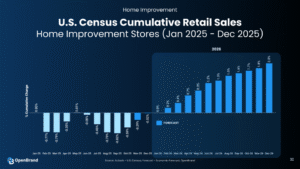
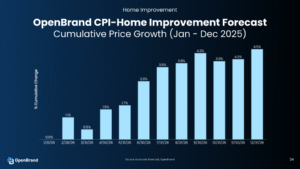
As is the case for appliances, a share of the increase in the growth of the home improvement market will come from price increases. We anticipate that prices will show modest growth in the first quarter, before picking up more significantly in April and beyond.
Consumer Electronics: Expect Muted 2026 Growth
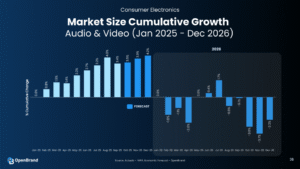
In 2025, we saw stronger-than-expected growth in consumer electronics categories (see CE product list) like audio and video. That was largely because consumers pulled their spending forward in anticipation of tariff-related price increases and economic uncertainty.
As a result, our outlook for consumer electronics growth is more muted for the year ahead. We expect flat to slightly negative growth in consumer electronics, not because demand disappeared, but because much of it happened earlier than anticipated.
Getting the attention of the consumer will be more difficult in the year ahead; the retailers and manufacturers that come out on top will be the ones that focus on feature-laden products—like bluelight-blocking technology for screens—that were buzzy at CES in January.
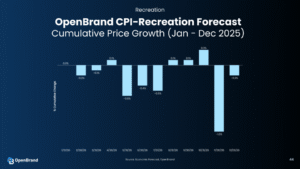
Cumulative prices are expected to contract across consumer electronics this year, with the most pronounced drop toward the end of the year. That’s good news for consumers, who will be able to get great deals on new gadgets, and difficult for brands, who will now compete in an even more price-competitive market.
Key Takeaways: What Our 2026 Durables Outlook Means For Your Business
Despite softening last year, the durables market has held up through the worst housing market in 15 years and big swings in consumer sentiment. Looking ahead, we’re anticipating a year of normalization, with market growth influenced largely by price changes and the tone set by the incoming Fed chair. Whether you’re a retailer or a manufacturer, here are three things to consider as you plan for the months to come:
- Consumers are adjusting, not disappearing. We’re seeing trade‑down at entry prices and resilience at the premium tier. In other words, consumers are opting for products that either minimize spend or deliver obvious value, with fewer decisions centered on mid-priced items.
- Housing matters for appliances and home improvement. As the housing market normalizes and eventually improves, that’s a structural tailwind for durables, even if the mix by category and price tier continues to shift.
- Competition is growing more intense for consumer electronics. That underscores the need for innovators to invest in new features that are going to get buyers’ attention. Manufacturers need to be thinking about competing not just on prices, but also product characteristics.
State of Durables Webinar
I spoke on this 2026 forecast data, as well as a look back at 2025, in OpenBrand’s recent State of Durables webinar. Check it out below.
Contact Us
Interested in getting more granular 2026 price forecasts for appliances, consumer electronics, and home improvement? OpenBrand has monthly scenario-based forecasting for durables by category and sub-group. Contact us below to learn more or request a forecast preview.
About OpenBrand CPI & Economic Forecasting Solutions
About OpenBrand’s CPI: OpenBrand delivers a Durables-grade Consumer Price Index that provides a more nuanced look at price inflation specific to the market.
About OpenBrand’s Economic Forecasting: From scenario-based forecasting products to custom projections, out economic forecasts equip retail companies with the ability to know and respond to what’s happening before it happens.
OpenBrand CPI - Durable and Personal Goods
Groups and Products
Appliance Group
Air Conditioners
Air Purifiers
Beverage Coolers
Blenders
Coffee Makers
Cooktops & Wall Ovens
Countertop Cooking
Countertop Microwaves
Dehumidifiers
Dishwashers
Dryers
Freezers
Icemakers
Laundry
Ranges
Refrigerators
Vacuums
Washers
OTR (Over-the Range Microwaves)
Communications Group
Business Printers
Desktops
Headsets
HED
Ink
Large Printers
MFP Copiers
Monitors
Notebooks
Personal & SOHO Printers
Projectors
Smartphones
Tablets & Detachables
Toner
Wearables
Wireless Routers
Recreation Group
Bluetooth Speakers
Bluray
Digital Camcorders
Digital Cameras
Headphones
Media Players
Photo Paper
Sewing Machines
Sound Bars
Speaker Systems
TVs
VAW Speakers
Home Improvement Group
Bathroom Faucets
Bathroom Sinks
Bathroom Vanity
Bathtubs
Cutting Machines
Carpets
Door Locks
Exterior Paints
Exterior Stains
Floor Tiles
Garden Hoses
Generators
Grass Seed
Handhelds
Hand Tools
Hardwood Flooring
Interior Paints
Interior Stains
Kitchen Cabinets
Kitchen Cleanup
Kitchen Faucets
Lawn Fertilizer
Lawn Products
Log Splitters
Mowers
Outdoor Cooking
Outdoor Cooking Accessories
Paint Supplies
Pesticides
Shower Stall and Enclosures
Power Tools
Power Tools Accessories
Pressure Washer
Replacement Batteries
Shower Doors
Shower Heads
Smart Doorbells
Smart Locks
Smart Cameras
Smart Thermostats
Snow Throwers
Spray Paint
Toilets
Vinyl Flooring
Water Filtration
Weed Killer
Personal Care Group
Anti-Smoking Products
Adult Incontinence
Baby Products
Bath Products
Contraceptives
Cosmetics (Eye, Facial, Nail)
Deodorants
Diabetic Products
Digestive (Lower GI, Upper GI, Hemorrhoidal)
Ear Care Products
Eye Care Products
Feminine Needs (Sanitary Napkins/Tampons & Women’s Care)
First Aid Accessories & Treatments
Foot Care Products
Fragrance
Hair Care (Coloring, Growth, Shampoo, Conditioner, Styling)
Hair Dryers
Home Health Care
Lip Preparations
Oral Care (Breath Fresheners, Accessories, Dentures, Mouthwash, Oral Hygiene, Toothpaste)
Pain (Analgesic, External & Internal)
Sexual Wellness
Shave (Non-Razor Blades, Creams, Razors)
Skin Care (Acne, Facial, Hand & Body)
Sleeping Remedies
Soap
Sun Care
Upper Respiratory (Cold/Allergy/Sinus Liquids & Tablets, Cough Drops/Lozenges, External, Nasal Products)
Vitamins, Minerals & Supplements
Wt Ctl/Nutrition (Tablets & Liquid, Powder Wipes, Towelettes)

Consumer Price Index: Durable and Personal Goods | December 2025
This is the January 2025 release of the OpenBrand Consumer Price Index (CPI) – Durable and Personal Goods report that covers price movements in December 2025.
DISCLAIMER: This report is provided ‘as is’ for informational purposes only. OpenBrand makes no representations or warranties regarding the accuracy, completeness, or reliability of the data. Users assume all risks associated with their use of this report. OpenBrand shall not be liable for any losses or damages arising from the use of this report.
2025 Ends Year with Uptick in Price Growth, Modest Outlook for 2026
In December, price growth for consumer durables and personal goods accelerated after a significant slowdown in November, with a month-over-month increase of +0.24%. This is up from a revised monthly +0.04% increase in the month prior. While the rate of price growth accelerated in four out of our five product groups, the Appliance group continued to show significant price deceleration in December, with prices in that group now falling in three out of the past four months.
Now that 2025 is behind us, we can now conduct an annual look-back on price trends across our five product groups over the past 12 months. This is especially important in light of the new presidential administration’s trade policies that began in the early part of the year. Overall, the OpenBrand CPI-DPG grew by 3.0% between January and December, with relatively smooth growth throughout the year. Just after the year’s halfway point passed in July, aggregate prices were up by just 1.6%. The Communications group followed a similar trajectory, with 2.1% of the annual 4.0% growth occurring in the first half of the year. Home Improvement also followed a similar trend, with 2.8% of the annual 6.3% occurring by July.
However, the trend was noticeably different in both the Appliances and Personal Care groups, where price growth peaked earlier in the year followed by a decline. Appliances reached a peak cumulative price growth rate of 2.0% by August, before falling to a cumulative rate of 1.2% in December. Personal Care followed a similar path, peaking at 1.5% in September before ending the year with a cumulative growth rate of 1.0% in December.
Table of Contents
- Key CPI Takeaways for December 2025 & Macroeconomic Outlook
- Product Group Highlights
- CPI 2025 Forecast: Macroeconomic Summary
- Methodology
December 2025 OpenBrand CPI-DPG Summary and Macroeconomic Outlook
Overall OpenBrand Consumer Price Index Movement: The OpenBrand CPI of Durable and Personal Goods recorded a +0.24% monthly change in December, notching the thirteenth consecutive month-over-month increase and 18th of the last 19th months. The sharp price growth this month occurred alongside a decent increase in the frequency of discounts, suggesting that the rise was partially driven by an increase in non-discounted list prices.
Discount Trends: December brought an increase in discount activity to the durables and personal goods sector, with frequencies climbing month-over-month to 23.5% of all durable and personal goods from 19.2% in the month prior. The typical magnitude increased slightly to 20.9%, up only slightly from 20.7% the month prior. All product groups except the Communications Group & the Recreation Group experienced the highest discount magnitude for 2025, while the Communications Group experienced the highest discount frequency for 2025.
Product Group Price Trends:
All product groups except the Appliance group experienced both an uptick in the rate of growth from the month prior & an increase in prices month-over-month. The group summary is as follows:
- Appliance Group (-0.75%)
- Communication Group (+0.76%)
- Home Improvement Group (+0.86%)
- Personal Care Group (+0.03%)
- Recreation Group (+0.31%)
See the full breakdown of product groupings.
Product Group Highlights
CPI: Appliances
Prices for appliances decreased on a month-over-month basis in December to -0.75%, falling from a revised +0.10% in the month prior. The negative price growth was at least partially driven by the typical discount magnitude increasing to 18.4% – the highest month this year- from 17.7%, while the frequency of discounts increased by almost 10 percentage points to 35.3% from 25.6% the month prior.
CPI: Communication
Prices of communication devices, including phones, tablets, computers, and printers, grew on a month-over-month basis to +0.76%, up slightly from a revised +0.06% the month prior. The frequency and magnitude of discounts were mixed in December. Frequency increased from 12.7% to 18.6%, while magnitude remained relatively flat, falling only in the slightest from 20.4% to 20.3% from November to December. The increase in prices of communication devices most likely was led by the significant increase in frequency of discounts, which rose this month by almost 6 percentage points compared to the month prior & boasts the highest frequency of discounts by quite a bit for 2025.
CPI: Home Improvement
Prices for home improvement goods increased by +0.86% on a month-over-month basis in December, growing from a revised +0.56% in the month prior, showing 33 consecutive month-over-month flat or monthly increases. The acceleration in price growth was at least partially driven by an increase in the magnitude of discounts (18.7% from 18.2% the month prior) – the highest for 2025, while the typical discount frequency remained flat at 10.2%.
CPI: Personal Care
Prices of personal care products grew on a monthly basis in December by +0.03%. Some of this increase may be due to an increase in both the magnitude (rising from 22.1% in November to 22.7% in December – recording the highest magnitude of discounts for 2025) & frequency of price discounts (rising from 22.9% in November to 23.4% in December).
CPI: Recreation
The rate of price growth of recreational products, including TVs, headphones, and speaker systems, increased to +0.31% on a month-over-month basis in December, up sharply from a revised -0.19% in November. Some of this increase in the pace of price growth is at least partially due to an increase in the frequency of discounts – up sharply to 29.7% in December from 24.8% in November – but a decrease in the average magnitude of discounts – down to 24.6% from 25.0% over the same time period.
Macroeconomic Outlook Update
As 2026 begins, U.S. consumers are likely to experience a welcome shift in the inflation story—one defined less by sticker shock and more by gradual stabilization. While prices are unlikely to fall broadly across the economy, the pace of price growth for durable and personal goods is expected to moderate meaningfully and, in some categories, edge modestly lower as lingering cost pressures from earlier trade policies and supply disruptions continue to unwind.
After several years of uneven inflation, the fundamentals for consumer goods pricing are improving. Supply chains are more normalized, inventories are healthier, and competitive pressures have returned in many retail categories. Importantly, the inflationary impulse from Trump-era tariffs—which raised costs on a wide range of imported consumer goods—has largely worked its way through the system. As contracts reset, sourcing adjusts, and global logistics remain relatively stable, the tariff pass-through that once pushed prices higher is fading into the background.
For consumers, this shift should be most noticeable in durable goods. Prices for big-ticket items such as appliances, furniture, electronics, and household equipment surged during and after the pandemic, only to cool sharply as demand softened and retailers worked through excess inventory. In 2026, those prices are expected to rise much more slowly than in prior years, and in some cases may drift lower in nominal terms as manufacturers and retailers compete more aggressively for value-conscious buyers. While prices are unlikely to return to pre-pandemic levels, the era of rapid increases in durable goods appears firmly behind us.
Personal goods—including clothing, footwear, household supplies, and everyday consumer items—are also poised for a more favorable pricing environment. These categories tend to be highly competitive and sensitive to changes in input costs. As tariff effects fade and global production stabilizes, retailers are increasingly able to limit price increases or offer promotions without sacrificing margins. For many households, this means fewer surprise price hikes and more predictable spending on everyday items.
The broader economic backdrop supports this moderation. Economic growth in 2026 is expected to remain steady but unspectacular, which helps limit demand-driven inflation. At the same time, the labor market is cooling gradually, easing wage pressures that often filter into consumer prices. While wages are still rising, they are doing so at a pace that is more consistent with long-run price stability rather than inflation acceleration.
Interest rates are also likely to play a role in shaping consumer prices. As inflation continues to cool, the Federal Reserve is expected to move cautiously toward a less restrictive policy stance. Lower borrowing costs would help households manage debt and support spending, but not at a level that would reignite runaway demand. This balance—moderate growth without overheating—creates a favorable environment for stable pricing.
For consumers, the practical takeaway in 2026 is not a return to deflation, but a return to normalcy. Price growth for durable and personal goods is expected to slow to modest levels and, in select categories, flatten or decline slightly. The intense inflation pressures of the early 2020s are giving way to a period where shopping decisions feel less urgent and budgets become easier to plan.
In short, 2026 looks to be a year of inflation relief rather than inflation reversal for U.S. consumers. As the residual effects of tariffs and supply disruptions fade, goods prices should become more stable, competitive, and predictable—offering households a long-awaited sense that the worst of goods-driven inflation is finally in the rearview mirror.
Note: This summary is based on data available as of early January 2025 and may be subject to revisions in future releases.
For questions about the report, please contact Ralph McLaughlin at ralph@openbrand.com
For press inquiries, please contact press@openbrand.com
About the OpenBrand CPI
This report offers insights into price trends across major consumer product categories representing a select mix of both durable and personal goods (see methodology below for more details). The data used in this report leverages OpenBrand’s industry-leading library of durable and personal goods pricing, promotion, and availability for over 1.4 million individual products. This is more than ten times the coverage by the monthly Bureau of Labor Statistics (BLS) Consumer Price Index, allowing more timely and granular reporting of price changes in the market.
This free monthly report provides a broad summary of price changes (including promotional activity), category-specific pricing and promotional trends, and macroeconomic context. For those seeking deeper insights, weekly CPI reporting and monthly CPI forecasts (released next week) are available on a subscription basis with up to same-day SKU-level pricing data available in bulk downloadable files.
Subscribe
Get CPI & Real-Time Pricing Data Updates
The OpenBrand CPI-DPG is released monthly. Join our subscription list to be notified when new CPI data is available.
OpenBrand Methodological Notes
The OpenBrand CPI of Durable and Personal Goods is constructed using a data-driven methodology that ensures accuracy, timeliness, and transparency in measuring price trends for both short and long-lasting consumer products. The methodology consists of the following key components:
- Data Collection
- Real-Time Price Tracking: Prices are sourced daily from online marketplaces, retail websites, and brick-and-mortar store listings.
- Retailer & Manufacturer Data: Aggregates pricing information from major retailers, direct-to-consumer brands, and wholesale suppliers into broader consumer categories.
- Temporal Coverage: Captures price variations over time, including daily discounts and price promotions
- Product Selection & Tracking
- Durable and Personal Goods Focus: The index includes products with an expected lifespan of three years or more, such as home appliances, consumer electronics, and tools, as well as personal care products with a shorter lifespan, such as hair and skin care products, vitamins, over-the-counter medications, and oral care products.
- Brand & Model Tracking: Individual brands and models are monitored to reflect pricing shifts within competitive product segments, including both permanent changes in listing price as well as temporary promotional pricing.
- Price Calculation, Adjustments, and Weighting
- Price Calculation: Tracks month-over-month and year-over-year price movements to measure price stability in the marketplace and take into account both longer-term changes in pricing (such as changes in manufacturer’s suggested retail price) as well as more short-term changes in pricing, such as promotional discounts and sales prices.
- SKU-Removal Instead of Hedonic Adjustments: When a product (or SKU) becomes unavailable in the BLS goods basket, the BLS implements a SKU-replacement procedure whereby the next most similar product is used in its place, and a quality (hedonic) adjustment procedure is performed to get closer to an apples-to-apples price comparison. Since OpenBrand has data on nearly 100% of the SKUs pricing history in a given product category, we can simply remove that SKU from the basket and rely on price changes of the remaining SKUs in that basket. This eliminates the need for hedonic adjustment in the OpenBrand CPI basket.
- Weighting and Aggregation Method: A weighted geometric mean formula is used to minimize volatility and improve stability in price trend analysis at both the product grouping and category level. Instead of using sales-volume weights when aggregating the index, we take an alternative approach by using persistence-based weights for aggregation. Instead of more frequently purchased items getting more weight in the BLS’ CPI calculation, OpenBrand takes a more novel approach by weighting items with a more established price history in the market more heavily in our CPI calculation than items with a less established history.
- Reporting & Updates
- High-Frequency Updates: Published freely on a monthly basis, with a subscription option for daily summaries across categories, sub-categories, and individual products.
- Comparative Benchmarks: We aggregate pricing as analogously as possible to traditional BLS CPI measures for benchmarking purposes.
- Transparency & Accessibility: Provides both open and paid data access for journalists, researchers, businesses, and policymakers.
By leveraging real-time data and advanced statistical techniques, the OpenBrand CPI offers an accurate and dynamic measure of pricing trends, helping businesses and consumers make informed decisions in an evolving economic landscape.
OpenBrand CPI - Durable and Personal Goods
Groups and Products
Appliance Group
Air Conditioners
Air Purifiers
Beverage Coolers
Blenders
Coffee Makers
Cooktops & Wall Ovens
Countertop Cooking
Countertop Microwaves
Dehumidifiers
Dishwashers
Dryers
Freezers
Icemakers
Laundry
Ranges
Refrigerators
Vacuums
Washers
OTR (Over-the Range Microwaves)
Communications Group
Business Printers
Desktops
Headsets
HED
Ink
Large Printers
MFP Copiers
Monitors
Notebooks
Personal & SOHO Printers
Projectors
Smartphones
Tablets & Detachables
Toner
Wearables
Wireless Routers
Recreation Group
Bluetooth Speakers
Bluray
Digital Camcorders
Digital Cameras
Headphones
Media Players
Photo Paper
Sewing Machines
Sound Bars
Speaker Systems
TVs
VAW Speakers
Home Improvement Group
Bathroom Faucets
Bathroom Sinks
Bathroom Vanity
Bathtubs
Cutting Machines
Carpets
Door Locks
Exterior Paints
Exterior Stains
Floor Tiles
Garden Hoses
Generators
Grass Seed
Handhelds
Hand Tools
Hardwood Flooring
Interior Paints
Interior Stains
Kitchen Cabinets
Kitchen Cleanup
Kitchen Faucets
Lawn Fertilizer
Lawn Products
Log Splitters
Mowers
Outdoor Cooking
Outdoor Cooking Accessories
Paint Supplies
Pesticides
Shower Stall and Enclosures
Power Tools
Power Tools Accessories
Pressure Washer
Replacement Batteries
Shower Doors
Shower Heads
Smart Doorbells
Smart Locks
Smart Cameras
Smart Thermostats
Snow Throwers
Spray Paint
Toilets
Vinyl Flooring
Water Filtration
Weed Killer
Personal Care Group
Anti-Smoking Products
Adult Incontinence
Baby Products
Bath Products
Contraceptives
Cosmetics (Eye, Facial, Nail)
Deodorants
Diabetic Products
Digestive (Lower GI, Upper GI, Hemorrhoidal)
Ear Care Products
Eye Care Products
Feminine Needs (Sanitary Napkins/Tampons & Women’s Care)
First Aid Accessories & Treatments
Foot Care Products
Fragrance
Hair Care (Coloring, Growth, Shampoo, Conditioner, Styling)
Hair Dryers
Home Health Care
Lip Preparations
Oral Care (Breath Fresheners, Accessories, Dentures, Mouthwash, Oral Hygiene, Toothpaste)
Pain (Analgesic, External & Internal)
Sexual Wellness
Shave (Non-Razor Blades, Creams, Razors)
Skin Care (Acne, Facial, Hand & Body)
Sleeping Remedies
Soap
Sun Care
Upper Respiratory (Cold/Allergy/Sinus Liquids & Tablets, Cough Drops/Lozenges, External, Nasal Products)
Vitamins, Minerals & Supplements
Wt Ctl/Nutrition (Tablets & Liquid, Powder Wipes, Towelettes)
PREPARED BY
Contact Us
For questions about the report, contact Ralph McLaughlin at ralph@openbrand.com
For press inquiries, contact press@openbrand.com
For full data access on a subscription basis, click the button below to request a demo of the offering.

Consumer Price Index: Durable and Personal Goods | November 2025
This is the December 2025 release of the OpenBrand Consumer Price Index (CPI) – Durable and Personal Goods report that covers price movements in November 2025.
DISCLAIMER: This report is provided ‘as is’ for informational purposes only. OpenBrand makes no representations or warranties regarding the accuracy, completeness, or reliability of the data. Users assume all risks associated with their use of this report. OpenBrand shall not be liable for any losses or damages arising from the use of this report.
Prices Fall For First Time in a Year, Even Before Black Friday Deals Hit
In November, price growth for consumer durables and personal goods decreased for the first time in a year, with a month-over-month decrease of -0.11%. This is down sharply from a revised monthly +0.21% increase in October. Prices of all product groups fell in November with the exception of the Home Improvement product group. What’s more, price growth was already negative before Black Friday deals hit on November 28th, with a month-over-month decrease in prices of -0.05% for the month-to-date prior to Black Friday. In addition, November brought the highest discount magnitude since January 2024.
However, when it comes to Black Friday weekend (we define it as the Friday, Saturday, and Sunday after Thanksgiving) 2025 also brought the greatest frequency of product discounts on a Black Friday weekend in the post-COVID era with 42.2% of products coming with a discount. This surpass the prior post-COVID high of 38.0% seen in 2022 and last year’s 34.0%.
Table of Contents
- Key CPI Takeaways for November 2025 & Macroeconomic Outlook
- Product Group Highlights
- CPI 2025 Forecast: Macroeconomic Summary
- Methodology
November 2025 OpenBrand CPI-DPG Summary and Macroeconomic Outlook
Overall OpenBrand Consumer Price Index Movement: The OpenBrand CPI of Durable and Personal Goods recorded a -0.11% monthly change in November, the first month-over-month decrease in 2025. The month-over-month slowdown in the pace of price growth was only the fourth slowdown of the calendar year.
Discount Trends: November brought an increase in discount activity to the durables and personal goods sector, with frequencies climbing month-over-month to 24.8% of all durable and personal goods from 24.3% in the month prior. The typical magnitude increased slightly to 20.9%, recording the highest magnitude in 2025 so far, and up from 20.6% the month prior. All product groups except the Communications Group experienced the highest discount magnitude for 2025 thus far.
Product Group Price Trends: All product groups except the personal care group experienced a slowdown in the rate of growth from the month prior, with prices of all groups except Home Improvement declining month-over-month. The group summary is as follows:
- Appliance Group (-0.68%)
- Communication Group (-0.03%)
- Home Improvement Group (+0.51%)
- Personal Care Group (-0.21%)
- Recreation Group (-0.16%)
See the full breakdown of product groupings.
Product Group Highlights
CPI: Appliances
Prices for appliances decreased sharply on a month-over-month basis in November to -0.68%, falling from a revised -0.19% in the month prior. The negative price growth was at least partially driven by the typical discount magnitude increasing to 17.5% – the highest month so far this year- from 17.1%, while the frequency of discounts decreased to 42.1% from 42.7% the month prior).
CPI: Communication
Prices of communication devices, including phones, tablets, computers, and printers, fell on a month-over-month basis to -0.03.%, down sharply again from a revised +0.63% the month prior. The frequency and magnitude of discounts were mixed in November, moving from 13.7% to 19.1% and 21.2% to 20.3% from October to November, respectively. The sharp decrease in prices of communication devices most likely was led by the significant increase in frequency of discounts, which rose this month by over 5 percentage points compared to the month prior & is also the highest frequency of discounts by quite a bit for 2025 so far.
CPI: Home Improvement
Prices for home improvement goods increased by +0.51% on a month-over-month basis in November, slowing from a revised +0.52% in the month prior, showing 32 consecutive month-over-month flat or monthly increases. The deceleration in price growth was at least partially driven by an decrease in the frequency of discounts (12.2% from 13.8% the month prior), while the typical discount magnitude grew to 18.7% – the highest for this year thus far – from 18.3%.
CPI: Personal Care
Prices of personal care products fell on a monthly basis in November by -0.21%. Some of this decrease may be due to an increase in the magnitude of price discounts (rising from 21.7% in October to 22.5% in November – recording the highest magnitude of discounts for 2025 so far) in conjunction with the frequency of discounts remaining relatively flat (falling only slightly from 22.8% in October to 22.6% in November).
CPI: Recreation
The rate of price growth of recreational products, including TVs, headphones, and speaker systems, decreased to -0.16% on a month-over-month basis in November, down sharply from a revised +0.48% in October. Some of this decrease in the pace of price growth is at least partially due to a decrease in the frequency of discounts – down to 27.9% in November from 28.4% in October – but an increase in the average magnitude of discounts – up to 25.4% from 24.8% over the same time period – showcasing the highest magnitude of discounts thus far in 2025.
Macroeconomic Outlook Update
As December 2025 begins, the U.S. economy is slowing but not stalling, and the question dominating financial markets is whether the Federal Reserve will deliver its third interest-rate cut this year at the December 10 FOMC meeting. The economy has made steady—though uneven—progress on inflation throughout the year, and the Fed now faces a delicate balance between sustaining disinflation and preventing an overly sharp deceleration in growth.
Inflation is continuing its gradual descent. Headline consumer price growth is now firmly in the low 3% range year over year, down from the elevated levels seen earlier in the tightening cycle. Core inflation is cooling, though at a slower pace, weighed down by persistent pressures in services. Shelter costs remain a particular challenge: while new-lease rent growth has softened considerably, the lagged impact of earlier increases is still flowing through the index. Health care, insurance, and other labor-intensive service categories are also contributing to stickiness. Yet the overall trend remains encouraging, and for the first time in many months, policymakers can observe a pattern of month-after-month improvement.
The labor market is showing clearer signs of cooling as well. Hiring has slowed to a modest pace, unemployment is hovering just over 4%, and wage growth—once a key source of inflationary pressure—has eased back toward a more sustainable range. Importantly, labor market softness is not yet translating into a collapse in job opportunities or a surge in layoffs. Instead, it points to an economy moving closer to balance: still expanding, but losing momentum as businesses grow more cautious.
Consumer spending remains surprisingly resilient, supported by positive real wage growth and continued demand for services heading into the holiday season. But household budgets are stretched, particularly among lower-income consumers. High interest rates on mortgages, auto loans, and credit cards continue to act as a drag, and delinquencies are rising from historically low levels. The result is a consumer sector that is still driving the expansion—but doing so at a slower and more fragile pace.
Business investment has softened, especially in interest-sensitive sectors, while global conditions continue to limit export growth. Manufacturing activity is subdued, and companies are increasingly focused on efficiency rather than expansion. These dynamics are consistent with an economy that remains fundamentally sound but increasingly vulnerable to weaker demand.
All of this places the Federal Reserve in a difficult but not impossible position as it approaches its December 10 decision. On one hand, the Fed has long maintained that it would need “greater confidence” that inflation is on a durable path back to 2% before cutting rates. Recent data has moved in the right direction, but not overwhelmingly so. On the other hand, keeping rates at restrictive levels risks tightening financial conditions too much at a moment when the economy is already slowing and the labor market is gradually loosening.
Market expectations ahead of the meeting reflect this tension. Investors are split: some anticipate that the Fed will use December to signal the beginning of a gradual normalization process with a modest quarter-point cut. Others expect the Fed to wait until early 2026, particularly if service-sector inflation remains sticky or labor market conditions strengthen unexpectedly. The Fed itself has remained cautious in its public communications, emphasizing data dependence and maintaining flexibility.
Ultimately, the likelihood of a December rate cut hinges on the final readings of inflation and labor market conditions released in the days leading up to the meeting. If both show continued cooling, the Fed may judge that the balance of risks has shifted sufficiently toward supporting growth. If not, policymakers may prefer to hold rates steady and begin easing early in the new year.
In short, the December 2025 outlook reflects an economy moving through the late stages of disinflation, with growth softening and monetary policy nearing an inflection point. Whether another cut arrives on December 10 or a few months later, the direction of policy is now clearly turning—and the next phase of the economic cycle will depend on how smoothly that transition unfolds.
Note: This summary is based on data available as of early December 2025 and may be subject to revisions in future releases.
For questions about the report, please contact Ralph McLaughlin at ralph@openbrand.com
For press inquiries, please contact press@openbrand.com
About the OpenBrand CPI
This report offers insights into price trends across major consumer product categories representing a select mix of both durable and personal goods (see methodology below for more details). The data used in this report leverages OpenBrand’s industry-leading library of durable and personal goods pricing, promotion, and availability for over 1.4 million individual products. This is more than ten times the coverage by the monthly Bureau of Labor Statistics (BLS) Consumer Price Index, allowing more timely and granular reporting of price changes in the market.
This free monthly report provides a broad summary of price changes (including promotional activity), category-specific pricing and promotional trends, and macroeconomic context. For those seeking deeper insights, weekly CPI reporting and monthly CPI forecasts (released next week) are available on a subscription basis with up to same-day SKU-level pricing data available in bulk downloadable files.
Subscribe
Get CPI & Real-Time Pricing Data Updates
The OpenBrand CPI-DPG is released monthly. Join our subscription list to be notified when new CPI data is available.
OpenBrand Methodological Notes
The OpenBrand CPI of Durable and Personal Goods is constructed using a data-driven methodology that ensures accuracy, timeliness, and transparency in measuring price trends for both short and long-lasting consumer products. The methodology consists of the following key components:
- Data Collection
- Real-Time Price Tracking: Prices are sourced daily from online marketplaces, retail websites, and brick-and-mortar store listings.
- Retailer & Manufacturer Data: Aggregates pricing information from major retailers, direct-to-consumer brands, and wholesale suppliers into broader consumer categories.
- Temporal Coverage: Captures price variations over time, including daily discounts and price promotions
- Product Selection & Tracking
- Durable and Personal Goods Focus: The index includes products with an expected lifespan of three years or more, such as home appliances, consumer electronics, and tools, as well as personal care products with a shorter lifespan, such as hair and skin care products, vitamins, over-the-counter medications, and oral care products.
- Brand & Model Tracking: Individual brands and models are monitored to reflect pricing shifts within competitive product segments, including both permanent changes in listing price as well as temporary promotional pricing.
- Price Calculation, Adjustments, and Weighting
- Price Calculation: Tracks month-over-month and year-over-year price movements to measure price stability in the marketplace and take into account both longer-term changes in pricing (such as changes in manufacturer’s suggested retail price) as well as more short-term changes in pricing, such as promotional discounts and sales prices.
- SKU-Removal Instead of Hedonic Adjustments: When a product (or SKU) becomes unavailable in the BLS goods basket, the BLS implements a SKU-replacement procedure whereby the next most similar product is used in its place, and a quality (hedonic) adjustment procedure is performed to get closer to an apples-to-apples price comparison. Since OpenBrand has data on nearly 100% of the SKUs pricing history in a given product category, we can simply remove that SKU from the basket and rely on price changes of the remaining SKUs in that basket. This eliminates the need for hedonic adjustment in the OpenBrand CPI basket.
- Weighting and Aggregation Method: A weighted geometric mean formula is used to minimize volatility and improve stability in price trend analysis at both the product grouping and category level. Instead of using sales-volume weights when aggregating the index, we take an alternative approach by using persistence-based weights for aggregation. Instead of more frequently purchased items getting more weight in the BLS’ CPI calculation, OpenBrand takes a more novel approach by weighting items with a more established price history in the market more heavily in our CPI calculation than items with a less established history.
- Reporting & Updates
- High-Frequency Updates: Published freely on a monthly basis, with a subscription option for daily summaries across categories, sub-categories, and individual products.
- Comparative Benchmarks: We aggregate pricing as analogously as possible to traditional BLS CPI measures for benchmarking purposes.
- Transparency & Accessibility: Provides both open and paid data access for journalists, researchers, businesses, and policymakers.
By leveraging real-time data and advanced statistical techniques, the OpenBrand CPI offers an accurate and dynamic measure of pricing trends, helping businesses and consumers make informed decisions in an evolving economic landscape.
OpenBrand CPI - Durable and Personal Goods
Groups and Products
Appliance Group
Air Conditioners
Air Purifiers
Beverage Coolers
Blenders
Coffee Makers
Cooktops & Wall Ovens
Countertop Cooking
Countertop Microwaves
Dehumidifiers
Dishwashers
Dryers
Freezers
Icemakers
Laundry
Ranges
Refrigerators
Vacuums
Washers
OTR (Over-the Range Microwaves)
Communications Group
Business Printers
Desktops
Headsets
HED
Ink
Large Printers
MFP Copiers
Monitors
Notebooks
Personal & SOHO Printers
Projectors
Smartphones
Tablets & Detachables
Toner
Wearables
Wireless Routers
Recreation Group
Bluetooth Speakers
Bluray
Digital Camcorders
Digital Cameras
Headphones
Media Players
Photo Paper
Sewing Machines
Sound Bars
Speaker Systems
TVs
VAW Speakers
Home Improvement Group
Bathroom Faucets
Bathroom Sinks
Bathroom Vanity
Bathtubs
Cutting Machines
Carpets
Door Locks
Exterior Paints
Exterior Stains
Floor Tiles
Garden Hoses
Generators
Grass Seed
Handhelds
Hand Tools
Hardwood Flooring
Interior Paints
Interior Stains
Kitchen Cabinets
Kitchen Cleanup
Kitchen Faucets
Lawn Fertilizer
Lawn Products
Log Splitters
Mowers
Outdoor Cooking
Outdoor Cooking Accessories
Paint Supplies
Pesticides
Shower Stall and Enclosures
Power Tools
Power Tools Accessories
Pressure Washer
Replacement Batteries
Shower Doors
Shower Heads
Smart Doorbells
Smart Locks
Smart Cameras
Smart Thermostats
Snow Throwers
Spray Paint
Toilets
Vinyl Flooring
Water Filtration
Weed Killer
Personal Care Group
Anti-Smoking Products
Adult Incontinence
Baby Products
Bath Products
Contraceptives
Cosmetics (Eye, Facial, Nail)
Deodorants
Diabetic Products
Digestive (Lower GI, Upper GI, Hemorrhoidal)
Ear Care Products
Eye Care Products
Feminine Needs (Sanitary Napkins/Tampons & Women’s Care)
First Aid Accessories & Treatments
Foot Care Products
Fragrance
Hair Care (Coloring, Growth, Shampoo, Conditioner, Styling)
Hair Dryers
Home Health Care
Lip Preparations
Oral Care (Breath Fresheners, Accessories, Dentures, Mouthwash, Oral Hygiene, Toothpaste)
Pain (Analgesic, External & Internal)
Sexual Wellness
Shave (Non-Razor Blades, Creams, Razors)
Skin Care (Acne, Facial, Hand & Body)
Sleeping Remedies
Soap
Sun Care
Upper Respiratory (Cold/Allergy/Sinus Liquids & Tablets, Cough Drops/Lozenges, External, Nasal Products)
Vitamins, Minerals & Supplements
Wt Ctl/Nutrition (Tablets & Liquid, Powder Wipes, Towelettes)
PREPARED BY
Contact Us
For questions about the report, contact Ralph McLaughlin at ralph@openbrand.com
For press inquiries, contact press@openbrand.com
For full data access on a subscription basis, click the button below to request a demo of the offering.
Avoiding the Pitfalls of Receipt-Only Inflation Measures With a Mosaic-Based CPI
The Takeaway: Receipt-only data creates an incomplete and biased view of inflation due to self-selection, biased reporting, poor product detail, lag, and misaligned incentives. Discover how the OpenBrand Consumer Price Index uses a comprehensive mosaic of price observations that better captures what consumers are seeing on the shelf, what they see on discount, and what they actually pay for.
In a world where prices can change at the tap of a screen, measuring inflation accurately is both more difficult and more critical than ever. As economists and data scientists seek better tools, one approach that often attracts attention is the consumer receipt panel: a dataset built from shopper-submitted receipts, either photographed with an app or uploaded manually.
While receipt panels can provide useful insights into consumer behavior, building a consumer price index (CPI) based only on receipt-panel data introduces a series of structural weaknesses. These flaws aren’t always obvious, but they have real consequences for anyone relying on the index—policymakers, businesses, forecasters, or households trying to make sense of, and decisions on, their economic landscape.
At OpenBrand, we designed the OpenBrand Consumer Price Index with these limitations squarely in mind. Our CPI is built on a mosaic of data that captures what prices consumers see on the shelf, what they see on discount, and what they actually pay for. This mosaic approach helps insulate the OpenBrand Consumer Price Index from the weaknesses that sole reliance upon receipt-panel data can bring.
Let me explain.
1. Representativeness Problem in Receipt Panels
When a CPI relies only on receipt uploads, the index is built on the behaviors of people who:
- Take the time to photograph receipts
- Participate in incentive programs
- Shop at stores that provide itemized paper or digital receipts
- Shop for specific items incentivized by receipt panel collectors
- Are comfortable sharing data with an app
That’s not a representative snapshot of the U.S. consumer. It’s a convenience sample, useful for some analyses, but not for a core inflation indicator.
Why OpenBrand’s CPI is immune:
The OpenBrand CPI uses a broad data set drawn from prices observed on millions of products on store shelves, online, on discount, on receipts, and from the longest-running consumer durables survey in the United States. This ensures representation across income groups, regions, retailer types, and product categories, without relying on a self-selected, opt-in behavior.
2. Receipt Panels Capture What’s Scanned vs What Consumers Actually Buy
Consumers often fail to upload receipts for:
- Small purchases
- Routine purchases
- Purchases split across payment methods
- Online orders where the receipt is buried in email
This creates erratic sampling frequency and inconsistent product coverage.
Why OpenBrand’s CPI is immune:
The OpenBrand CPI is based on a dataset of exhaustive price observations, not voluntary uploads. That means we capture the full pattern of consumer spending, including the mundane and the automatic—the things households rarely document but always pay for such as personal care products – toothpaste, hair care, toiletries, etc.
3. Product-Detail Gap in Receipt-Based Inflation Measures
Even when receipts are uploaded, they often list abbreviated product codes or generic descriptions—“LGE MILK,” “SHAMPOO,” “SERV CHG”—with no SKU, UPC, or version detail.
That makes:
- Product matching difficult or limited
- Quality adjustments nearly impossible
- Substitution tracking unreliable
- New-product introduction invisible
Receipt-only CPIs can confuse a price change with a product change.
Why OpenBrand’s CPI is immune:
OpenBrand uses structured product-level data, including SKU and UPC detail, manufacturing codes, and metadata. That lets us track true product equivalence, properly adjust for new product variation, and separate real inflation from quality-driven price shifts.
4. Receipt-Only CPI Approaches Struggle With Timeliness
Even the best receipt panels suffer from lag:
- Purchase date on receipts may not easily be tracked
- Consumers delay uploads
- Apps batch receipts
- Processing pipelines take time
For an inflation indicator, this latency can be a major drawback, especially during volatile periods.
Why OpenBrand’s CPI is immune:
The OpenBrand CPI is built on near-real-time price observation data, updating quickly enough to reflect active price dynamics, promotions, and category-specific shifts as they happen. With the OpenBrand in-store and online optical collection methods, spacing between same-SKU price observations is consistently a matter of days, not months. This allows a timely and true apples-to-apples comparison of price changes.
5. Incentive-Driven Distortions in Receipt Upload Behavior
To maintain participation, many receipt apps offer:
- Cashback
- Points
- Sweepstakes entries
- Fraud
These incentives often encourage users to upload certain types of receipts (e.g., grocery) while ignoring others, skewing the sample further, while also incentivizing nefarious behavior such as submission of fraudulent receipts.
Why OpenBrand’s CPI is immune:
Our CPI is predominantly driven by our dense pricing database that doesn’t rely on incentivizing consumer uploads to collect data. The OpenBrand CPI is grounded in naturally occurring price observation, free of incentive-driven distortions.
A Modern, Comprehensive Approach to Inflation Measurement
Receipt panels offer valuable micro-insights into consumer shopping behavior. But a receipt-panel-only CPI is not an inflation measure you want when setting pricing strategy, steering monetary policy, forecasting business cycles. The structural limitations – self-selection, biased reporting, poor product detail, lag, and misaligned incentives – are baked into the methodology of a CPI that relies solely on a receipt-panel-only data set. No amount of statistical modeling can fully remove them.
The OpenBrand Consumer Price Index was designed to overcome these limitations from day one. By grounding inflation measurement on a comprehensive mosaic of data gathered across merchants, channels, categories, and product types, we deliver a CPI that is more accurate, more representative, more granular, and more timely than any index built solely on consumer receipts.
Inflation is too important to measure with partial visibility. With OpenBrand, we measure it the way households actually live it.
Contact Us
For questions about OpenBrand’s CPI, contact Ralph McLaughlin at ralph@openbrand.com
For press inquiries, contact press@openbrand.com
For full data access on a subscription basis, click the button below to request a demo of the offering.

Consumer Price Index: Durable and Personal Goods | October 2025
This is the November 2025 release of the OpenBrand Consumer Price Index (CPI) – Durable and Personal Goods report that covers price movements in October 2025.
DISCLAIMER: This report is provided ‘as is’ for informational purposes only. OpenBrand makes no representations or warranties regarding the accuracy, completeness, or reliability of the data. Users assume all risks associated with their use of this report. OpenBrand shall not be liable for any losses or damages arising from the use of this report.
Inflation Cools Sharply in October as Prices of Appliances and Personal Care Products Fall
In October, price growth for consumer durables and personal goods decelerated for the first time in three months, with a month-over-month increase of +0.22% compared to a revised monthly +0.48% increase in September. Deceleration of price growth was observed across all of our price groups except communication devices, with prices of both appliances and personal goods seeing nominal price deflation in October. Amongst appliances, decreases were observed across most categories of products.
Amongst products in the appliance and personal care groups, we find a number of categories have been on a downward price growth trajectory over the past several months. For example, prices of hair dryers jumped 1.15% month-over-month in August, but slowed to 0.82% in September and fell by -1.27% in October. Similarly, laundry – including washers and dryers – grew by +0.90% in August, but fell by 0.48% in September and 0.86% in October. See chart below for select examples of other appliances and personal care products that experienced price declines last month.
Table of Contents
- Key CPI Takeaways for October 2025 & Macroeconomic Outlook
- Product Group Highlights
- CPI 2025 Forecast: Macroeconomic Summary
- Methodology
October 2025 OpenBrand CPI-DPG Summary and Macroeconomic Outlook
Overall OpenBrand Consumer Price Index Movement: The OpenBrand CPI of Durable and Personal Goods recorded a +0.22% monthly change in October, notching the eleventh consecutive month-over-month increase and 16th of the last 17th. The month-over-month slowdown in the pace of price growth was only the third slowdown of the calendar year.
Discount Trends: October brought mixed changes in discount activity to the durables and personal goods sector, with frequencies falling month-over-month to 24.6% of all durable and personal goods from 25.5% in the month prior. The typical magnitude increased slightly to 20.4%, almost matching the highest recording since July 2024, and up from 20.0% the month prior.
Product Group Price Trends: All product groups except the communications group experienced a slowdown in the rate of growth from the month prior, with prices of both appliances and personal care products actually declining month-over-month. The group summary is as follows:
- Appliance Group (-0.20%)
- Communication Group (+0.65%)
- Home Improvement Group (+0.49%)
- Personal Care Group (-0.33%)
- Recreation Group (+0.49%)
See the full breakdown of product groupings.
Product Group Highlights
CPI: Appliances
Prices for appliances decreased on a month-over-month basis in October to -0.20%, falling from a revised +0.01% in the month prior. The negative price growth was at least partially driven by the typical discount magnitude increasing slightly to 17.0% from 16.8%, while the frequency of discounts remained relatively unchanged (decreasing only slightly to 42.8% from 42.9% the month prior).
CPI: Communication
Prices of communication devices, including phones, tablets, computers, and printers, rose on a month-over-month basis to +0.65%, up sharply again from a revised +0.24% the month prior. The frequency and magnitude of discounts were mixed in October, moving from 16.8% to 14.1% and 20.0% to 20.2% from September to October, respectively. The sharp rise in prices of communication devices most likely was led by the significant decline in frequency of discounts, which fell again this month by almost 3 percentage points compared to the month prior.
CPI: Home Improvement
Prices for home improvement goods increased by +0.49% on a month-over-month basis in October, slowing from a revised +0.73% in the month prior, showing 31 consecutive month-over-month flat or monthly increases. The deceleration in price growth was at least partially driven by an increase in the frequency of discounts (13.9% from 13.4% the month prior), while the typical discount magnitude remained relatively flat, growing only slightly to 18.3% from 18.1%.
CPI: Personal Care
Prices of personal care products fell on a monthly basis in October 2025 by -0.33%. Some of this decrease may be due to a mild increase in the frequency and magnitude of price discounts, with the frequency of discounts remaining relatively flat, increasing only slightly from 24.1% in September to 24.3% in October, and the average discount magnitude growing from 20.7% to 21.6% over the same period.
CPI: Recreation
The rate of price growth of recreational products, including TVs, headphones, and speaker systems, decreased to +0.49% on a month-over-month basis in October, down sharply from a revised +0.79% in September. Some of this decrease in the pace of price growth is at least partially due to a decrease in the frequency of discounts – to 28.1% in October from 30.1% in September – but a slight increase in the average magnitude of discounts – to 24.7% from 24.4% over the same time period.
Macroeconomic Outlook Update
Entering November 2025, the U.S. economy finds itself navigating a fragile transition: growth remains positive, but with mounting headwinds — and among the most salient of those is the protracted federal government shutdown that began on October 1. According to the Congressional Budget Office, the shutdown could reduce real GDP growth in the fourth quarter by 1.0 to 2.0 percentage points, and an estimated $7 billion to $14 billion of output may be permanently lost depending on duration.
The economic effects are being felt in several ways. First, with roughly 750,000 federal workers furloughed or working without pay, households directly tied to the public sector are already tightening spending. This has immediate implications for consumption — especially in parts of the economy that rely on federal payrolls, travel and lodging near Washington, D.C., and contract staffing on federal projects.
Second, the shutdown is delaying and disrupting government-provided services and payments, including food assistance (SNAP) benefits, permit and regulatory approvals, and contract payments to businesses. These disruptions dampen business investment and consumer confidence, adding another negative drag.
On the inflation front, the shutdown creates a mixed picture. On one hand, the decline in federal employee pay and some delayed spending could exert mild downward pressure on aggregate demand and thus ease some inflationary pressure. On the other hand, disruptions to services, regulatory bottlenecks, and uncertainty may raise input costs and risk premium for firms, which could be passed on to consumers. Therefore, while headline inflation may remain fairly stable in the near term, underlying volatility and sectoral divergences are increasing.
The labor market remains relatively resilient — unemployment remains low by historical standards, and wage growth, though moderating, continues to run above pre-pandemic levels. But there are signs of emerging fragility: companies are issuing layoff notices, some sectors dependent on federal contracting are pausing hiring, and households with interrupted pay are delaying purchases. These factors suggest that while the labor market is not collapsing, its capacity to cushion the economy is weakening.
Monetary policy is likely to remain cautious and vigilant. The Federal Reserve will have to weigh the dual mandate of supporting the economy and labor market against the risk of inflation re-accelerating. The shutdown complicates the data picture, with statistical releases being delayed or impaired, which makes real-time assessment and policy calibration more difficult.
Looking ahead, the key scenarios for November and beyond are clear: if the shutdown is resolved promptly — say within the first half of November — the economic drag may be limited, enabling a relatively normal holiday spending season and moderate growth into 2026. But if the impasse drags on into December, the risks of weaker consumption, delayed investment, worsening confidence, and a slower reopening rebound become much more pronounced.
In summary, for November 2025 the U.S. economy is balancing on a see saw. The federal government shutdown is a significant wildcard: it is dragging on growth, creating uncertainty, and complicating policy. While the fundamentals (consumer spending, employment) remain reasonably solid, the shutdown adds a non-trivial risk of a soft patch, or worse, if not resolved soon. Inflation may not spike, but the underlying resilience of households and businesses is being tested — and in this environment, the margin of safety is narrowing.
Note: This summary is based on data available as of early November 2025 and may be subject to revisions in future releases.
For questions about the report, please contact Ralph McLaughlin at ralph@openbrand.com
For press inquiries, please contact press@openbrand.com
About the OpenBrand CPI
This report offers insights into price trends across major consumer product categories representing a select mix of both durable and personal goods (see methodology below for more details). The data used in this report leverages OpenBrand’s industry-leading library of durable and personal goods pricing, promotion, and availability for over 1.4 million individual products. This is more than ten times the coverage by the monthly Bureau of Labor Statistics (BLS) Consumer Price Index, allowing more timely and granular reporting of price changes in the market.
This free monthly report provides a broad summary of price changes (including promotional activity), category-specific pricing and promotional trends, and macroeconomic context. For those seeking deeper insights, weekly CPI reporting and monthly CPI forecasts (released next week) are available on a subscription basis with up to same-day SKU-level pricing data available in bulk downloadable files.
Subscribe
Get CPI & Real-Time Pricing Data Updates
The OpenBrand CPI-DPG is released monthly. Join our subscription list to be notified when new CPI data is available.
OpenBrand Methodological Notes
The OpenBrand CPI of Durable and Personal Goods is constructed using a data-driven methodology that ensures accuracy, timeliness, and transparency in measuring price trends for both short and long-lasting consumer products. The methodology consists of the following key components:
- Data Collection
- Real-Time Price Tracking: Prices are sourced daily from online marketplaces, retail websites, and brick-and-mortar store listings.
- Retailer & Manufacturer Data: Aggregates pricing information from major retailers, direct-to-consumer brands, and wholesale suppliers into broader consumer categories.
- Temporal Coverage: Captures price variations over time, including daily discounts and price promotions
- Product Selection & Tracking
- Durable and Personal Goods Focus: The index includes products with an expected lifespan of three years or more, such as home appliances, consumer electronics, and tools, as well as personal care products with a shorter lifespan, such as hair and skin care products, vitamins, over-the-counter medications, and oral care products.
- Brand & Model Tracking: Individual brands and models are monitored to reflect pricing shifts within competitive product segments, including both permanent changes in listing price as well as temporary promotional pricing.
- Price Calculation, Adjustments, and Weighting
- Price Calculation: Tracks month-over-month and year-over-year price movements to measure price stability in the marketplace and take into account both longer-term changes in pricing (such as changes in manufacturer’s suggested retail price) as well as more short-term changes in pricing, such as promotional discounts and sales prices.
- SKU-Removal Instead of Hedonic Adjustments: When a product (or SKU) becomes unavailable in the BLS goods basket, the BLS implements a SKU-replacement procedure whereby the next most similar product is used in its place, and a quality (hedonic) adjustment procedure is performed to get closer to an apples-to-apples price comparison. Since OpenBrand has data on nearly 100% of the SKUs pricing history in a given product category, we can simply remove that SKU from the basket and rely on price changes of the remaining SKUs in that basket. This eliminates the need for hedonic adjustment in the OpenBrand CPI basket.
- Weighting and Aggregation Method: A weighted geometric mean formula is used to minimize volatility and improve stability in price trend analysis at both the product grouping and category level. Instead of using sales-volume weights when aggregating the index, we take an alternative approach by using persistence-based weights for aggregation. Instead of more frequently purchased items getting more weight in the BLS’ CPI calculation, OpenBrand takes a more novel approach by weighting items with a more established price history in the market more heavily in our CPI calculation than items with a less established history.
- Reporting & Updates
- High-Frequency Updates: Published freely on a monthly basis, with a subscription option for daily summaries across categories, sub-categories, and individual products.
- Comparative Benchmarks: We aggregate pricing as analogously as possible to traditional BLS CPI measures for benchmarking purposes.
- Transparency & Accessibility: Provides both open and paid data access for journalists, researchers, businesses, and policymakers.
By leveraging real-time data and advanced statistical techniques, the OpenBrand CPI offers an accurate and dynamic measure of pricing trends, helping businesses and consumers make informed decisions in an evolving economic landscape.
OpenBrand CPI - Durable and Personal Goods
Groups and Products
Appliance Group
Air Conditioners
Air Purifiers
Beverage Coolers
Blenders
Coffee Makers
Cooktops & Wall Ovens
Countertop Cooking
Countertop Microwaves
Dehumidifiers
Dishwashers
Dryers
Freezers
Icemakers
Laundry
Ranges
Refrigerators
Vacuums
Washers
OTR (Over-the Range Microwaves)
Communications Group
Business Printers
Desktops
Headsets
HED
Ink
Large Printers
MFP Copiers
Monitors
Notebooks
Personal & SOHO Printers
Projectors
Smartphones
Tablets & Detachables
Toner
Wearables
Wireless Routers
Recreation Group
Bluetooth Speakers
Bluray
Digital Camcorders
Digital Cameras
Headphones
Media Players
Photo Paper
Sewing Machines
Sound Bars
Speaker Systems
TVs
VAW Speakers
Home Improvement Group
Bathroom Faucets
Bathroom Sinks
Bathroom Vanity
Bathtubs
Cutting Machines
Carpets
Door Locks
Exterior Paints
Exterior Stains
Floor Tiles
Garden Hoses
Generators
Grass Seed
Handhelds
Hand Tools
Hardwood Flooring
Interior Paints
Interior Stains
Kitchen Cabinets
Kitchen Cleanup
Kitchen Faucets
Lawn Fertilizer
Lawn Products
Log Splitters
Mowers
Outdoor Cooking
Outdoor Cooking Accessories
Paint Supplies
Pesticides
Shower Stall and Enclosures
Power Tools
Power Tools Accessories
Pressure Washer
Replacement Batteries
Shower Doors
Shower Heads
Smart Doorbells
Smart Locks
Smart Cameras
Smart Thermostats
Snow Throwers
Spray Paint
Toilets
Vinyl Flooring
Water Filtration
Weed Killer
Personal Care Group
Anti-Smoking Products
Adult Incontinence
Baby Products
Bath Products
Contraceptives
Cosmetics (Eye, Facial, Nail)
Deodorants
Diabetic Products
Digestive (Lower GI, Upper GI, Hemorrhoidal)
Ear Care Products
Eye Care Products
Feminine Needs (Sanitary Napkins/Tampons & Women’s Care)
First Aid Accessories & Treatments
Foot Care Products
Fragrance
Hair Care (Coloring, Growth, Shampoo, Conditioner, Styling)
Hair Dryers
Home Health Care
Lip Preparations
Oral Care (Breath Fresheners, Accessories, Dentures, Mouthwash, Oral Hygiene, Toothpaste)
Pain (Analgesic, External & Internal)
Sexual Wellness
Shave (Non-Razor Blades, Creams, Razors)
Skin Care (Acne, Facial, Hand & Body)
Sleeping Remedies
Soap
Sun Care
Upper Respiratory (Cold/Allergy/Sinus Liquids & Tablets, Cough Drops/Lozenges, External, Nasal Products)
Vitamins, Minerals & Supplements
Wt Ctl/Nutrition (Tablets & Liquid, Powder Wipes, Towelettes)
PREPARED BY
Contact Us
For questions about the report, contact Ralph McLaughlin at ralph@openbrand.com
For press inquiries, contact press@openbrand.com
For full data access on a subscription basis, click the button below to request a demo of the offering.

Consumer Price Index: Durable and Personal Goods | September 2025
This is the October 2025 release of the OpenBrand Consumer Price Index (CPI) – Durable and Personal Goods report that covers price movements in September 2025.
DISCLAIMER: This report is provided ‘as is’ for informational purposes only. OpenBrand makes no representations or warranties regarding the accuracy, completeness, or reliability of the data. Users assume all risks associated with their use of this report. OpenBrand shall not be liable for any losses or damages arising from the use of this report.
Personal Care Products Drive Price Growth Increases in September, but Appliance Prices Cool Their Jets
Price growth for consumer durables and personal goods accelerated for a second consecutive month in September, with a month-over-month increase of +0.58% compared to a revised monthly +0.45% increase in August. The acceleration of price growth was observed across three of our price groupings – Communication, Personal Care, and Recreational goods. Both Appliances and Home Improvement goods – which are comprised of products that were likely to be exempt from the now-eliminated duty-free de minimis treatment – saw price deceleration in September, a possible sign that the impacts of tariffs on these product groups may be starting to wane. In particular, prices of appliances showed no growth in September and were down from just under 0.5% growth between July and August.
What’s more, we find that products in the personal care product group dominated the top 10 list of categories with the largest month-over-month price growth. Of the 10 categories with the largest swings from negative to positive growth over the past two months, nine of the top 10 are in the personal care group and one in the recreation group, with categories such as breath fresheners, first aid treatments, deodorants media players, and shaving cream shifting from negative month-over-month growth in July, to between 1-3% in September.
Table of Contents
- Key CPI Takeaways for August 2025 & Macroeconomic Outlook
- Product Group Highlights
- CPI 2025 Forecast: Macroeconomic Summary
- Methodology
September 2025 OpenBrand CPI-DPG Summary and Macroeconomic Outlook
Overall OpenBrand Consumer Price Index Movement: The OpenBrand CPI of Durable and Personal Goods recorded a +0.58% monthly change in September, notching the tenth consecutive month-over-month increase and 15th of the last 16th. The increase in prices built on gains from the prior month, with an increase in discount magnitude being overshadowed by a much larger decrease in frequency of discounts.
Discount Trends: September brought mixed changes in discount activity to the durables and personal goods sector, with frequencies falling month-over-month to 23.1% of all durable and personal goods from 24.4% in the month prior. The typical magnitude increased to 20.6%, matching the highest recording in 2025 back in March, from 19.7% the month prior. With the falling frequency of discounts overshadowing an increase in discount magnitude, aggregate prices had strong growth this month compared to the month prior.
Product Group Price Trends: Four product groups – Communications, Home Improvement, Personal Care, and Recreation – all experienced increases in the rate of price growth from the prior month, while the Appliance group experienced a flat month. The group summary is as follows:
- Appliance Group (+0.0%)
- Communication Group (+0.76%)
- Home Improvement Group (+0.69%)
- Personal Care Group (+0.76%)
- Recreation Group (+0.68%)
See the full breakdown of product groupings.
Product Group Highlights
CPI: Appliances
Prices for appliances were flat on a month-over-month basis in September, falling from +0.48% in the month prior. The flat price growth was at least partially driven by the typical discount magnitude remaining flat at 16.9%, while the frequency of discounts decreased (44.0% from 45.0% the month prior).
CPI: Communication
Prices of communication devices, including phones, tablets, computers, and printers, rose on a month-over-month basis to +0.76%, up sharply from a revised +0.38% the month prior. The frequency and magnitude of discounts were mixed in September, moving from 12.1% to 7.9% and 20.6% to 23.2% from August to September, respectively. The sharp rise in prices of communication devices most likely was lead by the significant decline in frequency of discounts, which fell by about 4 percentage points compared to last month.
CPI: Home Improvement
The rate of increase for the price index of home improvement goods decreased slightly on a month-over-month basis, falling to +0.69% (down from +0.74% the month prior), showing 30 consecutive month-over-month flat or monthly increases. The increase in prices comes amidst a slight increase in the frequency (rising to 12.2% from 11.9%) of discounts, while the magnitude remained relatively flat, growing to 18.3% from 18.2%.
CPI: Personal Care
Prices of personal care products increased sharply on a monthly basis in September by +0.76%, up from a revised +0.47% in August. This increase comes amidst mixed responses in both the frequency and magnitude of discounts, with the frequency falling to 22.4% from 25.3%. This decrease in frequency of discounts could be the key to the rise in prices of personal care products. The rise in the frequency of discounts was enough to counteract the magnitude increase from to 21.5% from 20.5% between August and September.
CPI: Recreation
The rate of price growth of recreational products, including TVs, headphones, and speaker systems, increased sharply to +0.68% on a month-over-month basis in September, up from a revised +0.20% in August. Counterintuitively, the frequency of discounts increased to 28.8% in September from 27.5% in August and the average magnitude of discounts increased to 22.9% from 22.4% over the same time period. In order for price growth to rise with discounts increasing in both frequency and magnitude, it’s likely the case that sellers disguised price increases by increase apparent discounts by raising the list price more than the shelf price, leading to an apparent increase in discount magnitudes at the same time prices paid by the consumer also rise.
Macroeconomic Outlook Update
As of October 2025, the U.S. economy is at a critical juncture, transitioning from a period of stubborn inflationary pressure toward a more stable, though slower, growth environment. The pace of economic expansion has moderated, but the economy has avoided a sharp contraction, reflecting the resilience of consumers and businesses despite higher borrowing costs.
Inflation has cooled markedly from its post-pandemic highs, with headline price growth settling in the mid-3% range year-over-year. Yet the path toward the Federal Reserve’s 2% target remains uncertain. Goods inflation, which was once a source of disinflationary momentum, has turned slightly positive again as trade realignments, energy costs, and domestic sourcing requirements push input prices higher. Durable goods categories such as appliances, electronics, and autos have seen renewed price growth, in part reflecting steady consumer demand and supply-side frictions.
The most persistent price pressures remain in the services sector. Housing costs are the clearest example: mortgage rates remain elevated, keeping many homeowners locked in and limiting supply, while household formation continues to sustain strong rental demand. As a result, shelter inflation remains above overall price growth, constraining household budgets and prolonging the disinflation process. Other services, including health care and insurance, are also contributing to upward pressure.
The labor market, while cooling, continues to support the broader economy. Unemployment has edged up to just over 4%, but this remains historically low. Wage growth has slowed from its peaks but is still running faster than the pre-pandemic average, helping households maintain spending power. This dynamic has been crucial in preventing a sharper slowdown, though it has also made the “last mile” of disinflation more challenging.
Monetary policy remains firmly in restrictive territory, but is loosening. The Federal Reserve has kept rates elevated through the summer and fall, emphasizing that while progress has been made on inflation, it is not yet confident that price stability has been restored. The Federal Reserve did lower rates by 25 basis points last month, and markets are increasingly looking to the end of 2025 for continued signs of loosening with expectations of two more rate cuts by the end of the year. However, the Fed is signaling caution, wary of undoing gains too quickly.
Externally, the U.S. is contending with mixed global conditions. Sluggish growth in Europe and a fragile recovery in China have weighed on export demand, while geopolitical risks continue to threaten energy and food markets. At the same time, federal investment programs—particularly in infrastructure, clean energy, and domestic manufacturing—are providing support to key sectors and creating regional pockets of strength.
Taken together, the outlook for October 2025 points to an economy that is slowing but stable, with inflation gradually easing yet still above target. The balance of risks lies in how long consumer resilience can hold against elevated borrowing costs and whether service-sector inflation can cool without requiring a more pronounced economic slowdown. The coming quarters will be pivotal in determining whether the U.S. achieves a soft landing or faces a more drawn-out adjustment toward price stability and sustainable growth.
Note: This summary is based on data available as of early October 2025 and may be subject to revisions in future releases.
For questions about the report, please contact Ralph McLaughlin at ralph@openbrand.com
For press inquiries, please contact press@openbrand.com
About the OpenBrand CPI
This report offers insights into price trends across major consumer product categories representing a select mix of both durable and personal goods (see methodology below for more details). The data used in this report leverages OpenBrand’s industry-leading library of durable and personal goods pricing, promotion, and availability for over 200,000+ individual products. This more than doubles the coverage by the monthly Bureau of Labor Statistics (BLS) Consumer Price Index, which allows more timely and granular reporting of price changes in the market.
This free monthly report provides a broad summary of price changes (including promotional activity), category-specific pricing and promotional trends, and macroeconomic context. For those seeking deeper insights, weekly CPI reporting and monthly CPI forecasts (released next week) are available on a subscription basis with up to same-day SKU-level pricing data available in bulk downloadable files.
Subscribe
Get CPI & Real-Time Pricing Data Updates
The OpenBrand CPI-DPG is released monthly. Join our subscription list to be notified when new CPI data is available.
OpenBrand Methodological Notes
The OpenBrand CPI of Durable and Personal Goods is constructed using a data-driven methodology that ensures accuracy, timeliness, and transparency in measuring price trends for both short and long-lasting consumer products. The methodology consists of the following key components:
- Data Collection
- Real-Time Price Tracking: Prices are sourced daily from online marketplaces, retail websites, and brick-and-mortar store listings.
- Retailer & Manufacturer Data: Aggregates pricing information from major retailers, direct-to-consumer brands, and wholesale suppliers into broader consumer categories.
- Temporal Coverage: Captures price variations over time, including daily discounts and price promotions
- Product Selection & Tracking
- Durable and Personal Goods Focus: The index includes products with an expected lifespan of three years or more, such as home appliances, consumer electronics, and tools, as well as personal care products with a shorter lifespan, such as hair and skin care products, vitamins, over-the-counter medications, and oral care products.
- Brand & Model Tracking: Individual brands and models are monitored to reflect pricing shifts within competitive product segments, including both permanent changes in listing price as well as temporary promotional pricing.
- Price Calculation, Adjustments, and Weighting
- Price Calculation: Tracks month-over-month and year-over-year price movements to measure price stability in the marketplace and take into account both longer-term changes in pricing (such as changes in manufacturer’s suggested retail price) as well as more short-term changes in pricing, such as promotional discounts and sales prices.
- SKU-Removal Instead of Hedonic Adjustments: When a product (or SKU) becomes unavailable in the BLS goods basket, the BLS implements a SKU-replacement procedure whereby the next most similar product is used in its place, and a quality (hedonic) adjustment procedure is performed to get closer to an apples-to-apples price comparison. Since OpenBrand has data on nearly 100% of the SKUs pricing history in a given product category, we can simply remove that SKU from the basket and rely on price changes of the remaining SKUs in that basket. This eliminates the need for hedonic adjustment in the OpenBrand CPI basket.
- Weighting and Aggregation Method: A weighted geometric mean formula is used to minimize volatility and improve stability in price trend analysis at both the product grouping and category level. Instead of using sales-volume weights when aggregating the index, we take an alternative approach by using persistence-based weights for aggregation. Instead of more frequently purchased items getting more weight in the BLS’ CPI calculation, OpenBrand takes a more novel approach by weighting items with a more established price history in the market more heavily in our CPI calculation than items with a less established history.
- Reporting & Updates
- High-Frequency Updates: Published freely on a monthly basis, with a subscription option for daily summaries across categories, sub-categories, and individual products.
- Comparative Benchmarks: We aggregate pricing as analogously as possible to traditional BLS CPI measures for benchmarking purposes.
- Transparency & Accessibility: Provides both open and paid data access for journalists, researchers, businesses, and policymakers.
By leveraging real-time data and advanced statistical techniques, the OpenBrand CPI offers an accurate and dynamic measure of pricing trends, helping businesses and consumers make informed decisions in an evolving economic landscape.
OpenBrand CPI - Durable and Personal Goods
Groups and Products
Appliance Group
Air Conditioners
Air Purifiers
Beverage Coolers
Blenders
Coffee Makers
Cooktops & Wall Ovens
Countertop Cooking
Countertop Microwaves
Dehumidifiers
Dishwashers
Dryers
Freezers
Icemakers
Laundry
Ranges
Refrigerators
Vacuums
Washers
OTR (Over-the Range Microwaves)
Communications Group
Business Printers
Desktops
Headsets
HED
Ink
Large Printers
MFP Copiers
Monitors
Notebooks
Personal & SOHO Printers
Projectors
Smartphones
Tablets & Detachables
Toner
Wearables
Wireless Routers
Recreation Group
Bluetooth Speakers
Bluray
Digital Camcorders
Digital Cameras
Headphones
Media Players
Photo Paper
Sewing Machines
Sound Bars
Speaker Systems
TVs
VAW Speakers
Home Improvement Group
Bathroom Faucets
Bathroom Sinks
Bathroom Vanity
Bathtubs
Cutting Machines
Carpets
Door Locks
Exterior Paints
Exterior Stains
Floor Tiles
Garden Hoses
Generators
Grass Seed
Handhelds
Hand Tools
Hardwood Flooring
Interior Paints
Interior Stains
Kitchen Cabinets
Kitchen Cleanup
Kitchen Faucets
Lawn Fertilizer
Lawn Products
Log Splitters
Mowers
Outdoor Cooking
Outdoor Cooking Accessories
Paint Supplies
Pesticides
Shower Stall and Enclosures
Power Tools
Power Tools Accessories
Pressure Washer
Replacement Batteries
Shower Doors
Shower Heads
Smart Doorbells
Smart Locks
Smart Cameras
Smart Thermostats
Snow Throwers
Spray Paint
Toilets
Vinyl Flooring
Water Filtration
Weed Killer
Personal Care Group
Anti-Smoking Products
Adult Incontinence
Baby Products
Bath Products
Contraceptives
Cosmetics (Eye, Facial, Nail)
Deodorants
Diabetic Products
Digestive (Lower GI, Upper GI, Hemorrhoidal)
Ear Care Products
Eye Care Products
Feminine Needs (Sanitary Napkins/Tampons & Women’s Care)
First Aid Accessories & Treatments
Foot Care Products
Fragrance
Hair Care (Coloring, Growth, Shampoo, Conditioner, Styling)
Hair Dryers
Home Health Care
Lip Preparations
Oral Care (Breath Fresheners, Accessories, Dentures, Mouthwash, Oral Hygiene, Toothpaste)
Pain (Analgesic, External & Internal)
Sexual Wellness
Shave (Non-Razor Blades, Creams, Razors)
Skin Care (Acne, Facial, Hand & Body)
Sleeping Remedies
Soap
Sun Care
Upper Respiratory (Cold/Allergy/Sinus Liquids & Tablets, Cough Drops/Lozenges, External, Nasal Products)
Vitamins, Minerals & Supplements
Wt Ctl/Nutrition (Tablets & Liquid, Powder Wipes, Towelettes)
PREPARED BY
Contact Us
For questions about the report, contact Ralph McLaughlin at ralph@openbrand.com
For press inquiries, contact press@openbrand.com
For full data access on a subscription basis, click the button below to request a demo of the offering.

Consumer Price Index: Durable and Personal Goods | August 2025
This is the September 2025 release of the OpenBrand Consumer Price Index (CPI) – Durable and Personal Goods report that covers price movements in August 2025.
DISCLAIMER: This report is provided ‘as is’ for informational purposes only. OpenBrand makes no representations or warranties regarding the accuracy, completeness, or reliability of the data. Users assume all risks associated with their use of this report. OpenBrand shall not be liable for any losses or damages arising from the use of this report.
Price Growth Accelerates in August After Prime Day, New Tariffs, and Elimination of Tariff Exemptions
Price growth for consumer durables and personal goods reaccelerated on a monthly basis in August, with a month-over-month increase of +0.43% compared to a revised monthly +0.24% increase in July. The reacceleration of price growth was observed across all of our price groupings except recreational goods, and is a rebound from a very active month of discounts in July due to Amazon’s Prime Week. What’s more, the reacceleration in August comes amid a slate of new tariffs as well as elimination of the duty-free de minimis treatment, allowing the U.S. Customs and Border Protection to collect tariffs on packaged goods that are below the previous exclusionary threshold of $800.
What’s more, we find that a variety of products in the appliances, communication, home improvement, and personal care sectors were responsible for the price acceleration. Large monthly increases were observed among select desktop computers, dishwashers, outdoor cooking, power tools/accessories, shampoo/conditioner, shaving razors, vacuums, and wearable electronics, with several of these products swinging from negative to positive month-over-month growth between July and August.
Table of Contents
- Key CPI Takeaways for August 2025 & Macroeconomic Outlook
- Product Group Highlights
- CPI 2025 Forecast: Macroeconomic Summary
- Methodology
August 2025 OpenBrand CPI-DPG Summary and Macroeconomic Outlook
Overall OpenBrand Consumer Price Index Movement: The OpenBrand CPI of Durable and Personal Goods recorded a +0.43% monthly change in August, notching the ninth consecutive month-over-month increase and 14th of the last 15th. The increase was also a reacceleration from July’s revised figure of +0.24%, when Amazon – and other retailers – ramped up discounting activity during Prime Week. A recap of those discounting trends can be found in last month’s report.
Discount Trends: August brought relatively small changes in discount activity to the durables and personal goods sector, with frequencies rising month-over-month by just 100 basis points to 25.2% of all durable and personal goods from 24.7% in the month prior. This was the highest reading since December 202.. Despite the uptick in discount frequency in August, the typical magnitude decreased to 19.9% from 20.4% the month prior. Given that prices accelerated in the aggregate, this suggests that retailers may be hiding net price increases by increasing the apparent discount rate to consumers.
Product Group Price Trends: Four product groups – Appliances, Communications, Home Improvement, and Personal Care – all experienced increases in the rate of price growth from the prior month, while the Recreation group also experienced an increase but at a slower rate than the month prior. The group summary is as follows:
- Appliance Group (+0.48%)
- Communication Group (+0.39%)
- Home Improvement Group (+0.68%)
- Personal Care Group (+0.37%)
- Recreation Group (+0.23%)
See the full breakdown of product groupings.
Product Group Highlights
CPI: Appliances
Prices for appliances increased by +0.48% on a month-over-month basis in August, rising from a revised increase of +0.26% in the month prior. The acceleration in price growth was at least partially driven by a decrease in the frequency of discounts (45.1% from 46.0% the month prior), while the typical discount magnitude decreased to 16.9% from 17.3% the month prior.
CPI: Communication
rices of communication devices, including phones, tablets, computers, and printers, rose on a month-over-month basis to +0.39%, up sharply from a revised +0.15% the month prior. The frequency and magnitude of discounts was essentially unchanged in August, moving from 12.1% to 12.0% and 20.6% to 20.5% from July to August, respectively.
CPI: Home Improvement
The rate of increase for the price index of home improvement goods increased slightly on a month-over-month basis, growing to +0.68% (up from +0.60% the month prior), showing 28 consecutive month-over-month flat or monthly increases. The increase in prices comes amidst a slight increase in the frequency (rising to 16.3% from 15.1%) of discounts, while the magnitude remained unchanged at 18.8%.
CPI: Personal Care
Prices of personal care products increased sharply on a monthly basis in August by +0.37%, up from -0.21% in July. This increase comes amidst decreases in both the frequency and magnitude of discounts, with the frequency falling to 25.5% from 26.0% and the magnitude falling to 21.6% from 20.6% between July and August.
CPI: Recreation
The rate of price growth of recreational products, including TVs, headphones, and speaker systems, decreased to +0.23% on a month-over-month basis in August, down from a revised +0.41% in July. Some of this decrease in the pace of price growth is at least partially due to a sharp increase in the frequency of discounts – to 27.2% in August from 24.2% in July – but a slight decrease in the average magnitude of discounts – to 22.5% from 23.8% over the same time period.
Macroeconomic Outlook Update
As of September 2025, the U.S. economy is navigating a careful transition from an inflation-driven tightening cycle toward a period of slower, more balanced growth. After two years of aggressive monetary policy and supply-side adjustments, inflation has eased significantly from its peak but remains above the Federal Reserve’s 2% target. Headline inflation is hovering in the low-3% range, while core inflation continues to show stickiness, particularly in services, signaling that the final stretch of disinflation will be the most difficult.
The labor market, though cooling from the ultra-tight conditions of 2022 and 2023, remains historically strong. Unemployment is holding near 4.2%, and wage growth, while moderating, is still above the pre-pandemic trend. These labor dynamics have kept consumer spending steady, particularly in services, even as borrowing costs weigh on big-ticket purchases. This resilience is contributing to the “last mile” problem for inflation, with services and housing costs continuing to grow faster than goods prices.
Housing markets remain a point of stress. While mortgage rates have inched down from their highs, affordability challenges persist due to elevated home prices and limited inventory. Rent inflation, though slowing slightly, remains firm in many metro areas. Insurance costs—driven by climate-related risks and regulatory shifts—are adding an additional layer of price pressure for homeowners and businesses alike.
Energy markets are stable for now but remain a potential wildcard. Increased renewable generation and domestic energy investment have helped stabilize fuel prices, but geopolitical tensions and climate-driven supply disruptions keep the sector vulnerable to volatility. Food prices have improved compared to last year, but weather shocks and global supply disruptions still pose risks heading into the winter months.
Monetary policy is at an inflection point. The Federal Reserve has maintained its restrictive stance through the summer but has begun signaling openness to a gradual easing cycle, possibly starting late this year or early next year, contingent on continued progress toward its inflation target. Financial markets expect one or two modest rate cuts before year-end, though Fed officials remain cautious about declaring victory too early.
In sum, the macroeconomic outlook as of September 2025 is one of gradual stabilization, but not without risks. Inflation is trending downward but at a slower pace, growth is moderating without collapsing, and policy is poised to shift from restraint to cautious support. The biggest challenges ahead lie in navigating this delicate balance—ensuring that disinflation continues without triggering a downturn, while managing structural shifts in labor, energy, and global trade that will define the next phase of the economy.
Note: This summary is based on data available as of early September 2025 and may be subject to revisions in future releases. With the September 2025 release, we have added additional categories (noted below) and increased the frequency of price observations on several existing categories. Given these changes, we present a comparison of the legacy categories (old) and sample size with the expanded categories and sample size (new). Since the impact is small, in this, and future reports, we use the expanded categories and sample size in calculation of the OpenBrand CPI-DPG and CPI groups.
For questions about the report, please contact Ralph McLaughlin at ralph@openbrand.com
For press inquiries, please contact press@openbrand.com
About the OpenBrand CPI
This report offers insights into price trends across major consumer product categories representing a select mix of both durable and personal goods (see methodology below for more details). The data used in this report leverages OpenBrand’s industry-leading library of durable and personal goods pricing, promotion, and availability for over 200,000+ individual products. This more than doubles the coverage by the monthly Bureau of Labor Statistics (BLS) Consumer Price Index, which allows more timely and granular reporting of price changes in the market.
This free monthly report provides a broad summary of price changes (including promotional activity), category-specific pricing and promotional trends, and macroeconomic context. For those seeking deeper insights, weekly CPI reporting and monthly CPI forecasts (released next week) are available on a subscription basis with up to same-day SKU-level pricing data available in bulk downloadable files.
Subscribe
Get CPI & Real-Time Pricing Data Updates
The OpenBrand CPI-DPG is released monthly. Join our subscription list to be notified when new CPI data is available.
OpenBrand Methodological Notes
The OpenBrand CPI of Durable and Personal Goods is constructed using a data-driven methodology that ensures accuracy, timeliness, and transparency in measuring price trends for both short and long-lasting consumer products. The methodology consists of the following key components:
- Data Collection
- Real-Time Price Tracking: Prices are sourced daily from online marketplaces, retail websites, and brick-and-mortar store listings.
- Retailer & Manufacturer Data: Aggregates pricing information from major retailers, direct-to-consumer brands, and wholesale suppliers into broader consumer categories.
- Temporal Coverage: Captures price variations over time, including daily discounts and price promotions
- Product Selection & Tracking
- Durable and Personal Goods Focus: The index includes products with an expected lifespan of three years or more, such as home appliances, consumer electronics, and tools, as well as personal care products with a shorter lifespan, such as hair and skin care products, vitamins, over-the-counter medications, and oral care products.
- Brand & Model Tracking: Individual brands and models are monitored to reflect pricing shifts within competitive product segments, including both permanent changes in listing price as well as temporary promotional pricing.
- Price Calculation, Adjustments, and Weighting
- Price Calculation: Tracks month-over-month and year-over-year price movements to measure price stability in the marketplace and take into account both longer-term changes in pricing (such as changes in manufacturer’s suggested retail price) as well as more short-term changes in pricing, such as promotional discounts and sales prices.
- SKU-Removal Instead of Hedonic Adjustments: When a product (or SKU) becomes unavailable in the BLS goods basket, the BLS implements a SKU-replacement procedure whereby the next most similar product is used in its place, and a quality (hedonic) adjustment procedure is performed to get closer to an apples-to-apples price comparison. Since OpenBrand has data on nearly 100% of the SKUs pricing history in a given product category, we can simply remove that SKU from the basket and rely on price changes of the remaining SKUs in that basket. This eliminates the need for hedonic adjustment in the OpenBrand CPI basket.
- Weighting and Aggregation Method: A weighted geometric mean formula is used to minimize volatility and improve stability in price trend analysis at both the product grouping and category level. Instead of using sales-volume weights when aggregating the index, we take an alternative approach by using persistence-based weights for aggregation. Instead of more frequently purchased items getting more weight in the BLS’ CPI calculation, OpenBrand takes a more novel approach by weighting items with a more established price history in the market more heavily in our CPI calculation than items with a less established history.
- Reporting & Updates
- High-Frequency Updates: Published freely on a monthly basis, with a subscription option for daily summaries across categories, sub-categories, and individual products.
- Comparative Benchmarks: We aggregate pricing as analogously as possible to traditional BLS CPI measures for benchmarking purposes.
- Transparency & Accessibility: Provides both open and paid data access for journalists, researchers, businesses, and policymakers.
By leveraging real-time data and advanced statistical techniques, the OpenBrand CPI offers an accurate and dynamic measure of pricing trends, helping businesses and consumers make informed decisions in an evolving economic landscape.
OpenBrand CPI - Durable and Personal Goods
Groups and Products
(New categories added in this month’s calculations are identified in bold italic below)
Appliance Group
Air Conditioners
Air Purifiers
Beverage Coolers
Blenders
Coffee Makers
Cooktops & Wall Ovens
Countertop Cooking
Countertop Microwaves
Dehumidifiers
Dishwashers
Dryers
Freezers
Icemakers
Laundry
Ranges
Refrigerators
Vacuums
Washers
OTR (Over-the Range Microwaves)
Communications Group
Business Printers
Desktops
Headsets
HED
Ink
Large Printers
MFP Copiers
Monitors
Notebooks
Personal & SOHO Printers
Projectors
Smartphones
Tablets & Detachables
Toner
Wearables
Wireless Routers
Home Improvement Group
Bathroom Faucets
Bathroom Sinks
Bathroom Vanity
Bathtubs
Cutting Machines
Carpets
Door Locks
Exterior Paints
Exterior Stains
Floor Tiles
Garden Hoses
Generators
Grass Seed
Handhelds
Hand Tools
Hardwood Flooring
Interior Paints
Interior Stains
Kitchen Cabinets
Kitchen Cleanup
Kitchen Faucets
Lawn Fertilizer
Lawn Products
Log Splitters
Mowers
Outdoor Cooking
Outdoor Cooking Accessories
Paint Supplies
Pesticides
Shower Stall and Enclosures
Power Tools
Power Tools Accessories
Pressure Washer
Replacement Batteries
Shower Doors
Shower Heads
Smart Doorbells
Smart Locks
Smart Cameras
Smart Thermostats
Snow Throwers
Spray Paint
Toilets
Vinyl Flooring
Water Filtration
Weed Killer
Personal Care Group
Anti-Smoking Products
Adult Incontinence
Baby Products
Bath Products
Contraceptives
Cosmetics (Eye, Facial, Nail)
Deodorants
Diabetic Products
Digestive (Lower GI, Upper GI, Hemorrhoidal)
Ear Care Products
Eye Care Products
Feminine Needs (Sanitary Napkins/Tampons & Women’s Care)
First Aid Accessories & Treatments
Foot Care Products
Fragrance
Hair Care (Coloring, Growth, Shampoo, Conditioner, Styling)
Hair Dryers
Home Health Care
Lip Preparations
Oral Care (Breath Fresheners, Accessories, Dentures, Mouthwash, Oral Hygiene, Toothpaste)
Pain (Analgesic, External & Internal)
Sexual Wellness
Shave (Non-Razor Blades, Creams, Razors)
Skin Care (Acne, Facial, Hand & Body)
Sleeping Remedies
Soap
Sun Care
Upper Respiratory (Cold/Allergy/Sinus Liquids & Tablets, Cough Drops/Lozenges, External, Nasal Products)
Vitamins, Minerals & Supplements
Wt Ctl/Nutrition (Tablets & Liquid, Powder Wipes, Towelettes)
PREPARED BY
Contact Us
For questions about the report, contact Ralph McLaughlin at ralph@openbrand.com
For press inquiries, contact press@openbrand.com
For full data access on a subscription basis, click the button below to request a demo of the offering.

Consumer Price Index: Durable and Personal Goods | July 2025
This is the August 2025 release of the OpenBrand Consumer Price Index (CPI) – Durable and Personal Goods report that covers price movements in July 2025.
DISCLAIMER: This report is provided ‘as is’ for informational purposes only. OpenBrand makes no representations or warranties regarding the accuracy, completeness, or reliability of the data. Users assume all risks associated with their use of this report. OpenBrand shall not be liable for any losses or damages arising from the use of this report.
Price Growth Slows Sharply in July Amid Amazon Prime Week and Elevated Discounting
Price growth for consumer durables and personal goods decelerated sharply on a monthly basis in July, with a month-over-month increase of +0.17% compared to a revised monthly +0.75% increase in June. The deceleration of price growth was primarily driven by slower price growth of appliances, communication, personal care, and recreation products, as well as a nearly 200 basis point increase in discount activity from 21.2% in July to 23.1% in July.
Some of the price growth deceleration in July was likely due to an increase in discounting activity, driven in part by Amazon’s Prime Week and the announcement of similar promotional events by BestBuy.com, Target.com, and Walmart.com. While Amazon is the host of Prime Week, it turns out that Walmart.com actually stole the show this year in terms of both discount frequency compared to its competitors as well as differential between itself during the rest of the month. Nearly 60% of all products on Walmart.com were discounted during Prime Week, leading the pack. Amazon.com finished second at 46.2%, followed by BestBuy.com at 29.1%, and Target.com with 2.66%.
What’s more, Walmart.com’s discount frequency rate was nearly three times higher during Prime Week compared to the rest of the month (59.6% vs. 21.5%). BestBuy.com was second with about a 9 percentage point difference, followed by Amazon with a 6.2 percentage point difference, and last was Target.com with actually showed higher discount rates in the rest of the month than during Prime Week.
A slightly different story emerges when we look at the magnitude of discounts offered by these retailers during the month of July. Walmart.com again led the pack with a typical discount of 26.8% on discounted items. Amazon.com was second with 21.2%, followed BestBuy.com with a typical discount of 20.1%, and last was Target at 19.2%. The interesting takeaway is that only Amazon.com actually showed a higher discount magnitude during Prime Week compared to the other days of the month, while the other three retailers surprisingly showed higher discounts outside of Prime Week in July.
Table of Contents
- Key CPI Takeaways for June 2025 & Macroeconomic Outlook
- Product Group Highlights
- CPI 2025 Forecast: Macroeconomic Summary
- Methodology
July 2025 OpenBrand CPI-DPG Summary and Macroeconomic Outlook
Overall OpenBrand Consumer Price Index Movement: The OpenBrand CPI of Durable and Personal Goods recorded a +0.17% monthly change in July, notching the eighth consecutive month-over-month increase and 13th of the last 14th. While prices continue to grow, the magnitude of price change decelerated significantly from June’s large increase of +0.75%.
Discount Trends: July brought a relatively sharp increase in discount activity to the durables and personal goods sector, with frequencies rising month-over-month to 23.1% of all durable and personal goods from 21.2% in the month prior. This was the highest reading since December and the second largest in three years. Despite the uptick in discount frequency in July, the typical magnitude remained relatively unchanged at 20.2%. This suggests the flurry of discounting activity brought on by Amazon’s Prime Week and their competitors primarily brought breadth – but not depth – to pricing discounts of durable and personal goods.
Product Group Price Trends: Three product groups – Appliances, Communications, and Recreation – all experienced sharp decreases in the rate of price growth from the prior month, while Home Improvement was flat. Personal Care products exhibited relatively strong negative growth.
- Appliance Group (+0.21%)
- Communication Group (+0.16%)
- Home Improvement Group (+0.45%)
- Personal Care Group (-0.32%)
- Recreation Group (+0.23%)
See the full breakdown of product groupings.
Product Group Highlights
CPI: Appliances
Prices for appliances increased by +0.21% on a month-over-month basis in July, slowing from a revised decrease of +0.31% in the month prior. The deceleration in price growth was at least partially driven by an increase in the frequency of discounts (43.7% from 42.6% the month prior), while the typical discount magnitude increased slightly to 16.7% from 16.5% the month prior.
CPI: Communication
Prices of communication devices, including phones, tablets, computers, and printers, rose on a month-over-month basis to +0.16%, down sharply from a revised +1.29% the month prior. Both the frequency and magnitude of discounts increased in July, from 10.00% to 11.90% and 19.9% to 20.5%, respectively. This is the third consecutive month of both increasing discount frequencies and magnitudes in the communications group.
CPI: Home Improvement
The index for home improvement goods was essentially flat on a month-over-month basis and grew by +0.45% (down from +0.46% the month prior), showing 27 consecutive month-over-month flat or monthly increases. The increase in prices comes amidst slight increases in both the frequency (rising to 12.7% from 12.6%) and magnitude (rising to 18.5% from 17.8%). This is the second consecutive month in which discounting activity – in both frequency and magnitude – increased over the month prior.
CPI: Personal Care
Prices of personal care products decreased sharply on a monthly basis in July by -0.32%, down from +0.00% in June. This decrease comes amidst changes in the frequency of discounts increasing a full 420 basis points, growing to 26.1% in July from 21.9% in June. The typical discount magnitude increased by 50 basis points. from 21.2% in June to 21.7% in July.
CPI: Recreation
The rate of price growth of recreational products, including TVs, headphones, and speaker systems, decreased sharply to +0.23% on a month-over-month basis in July, down from a revised +1.80% in June. Some of this sharp decrease in the pace of price growth is at least partially due to an increase in the frequency of discounts – to 20.8% in July from 18.7% in June – and a moderate increase in the average magnitude of discounts – to 23.8% from 22.1% over the same time period.
Macroeconomic Outlook Update
As of August 2025, the U.S. economy stands at a pivotal moment—balancing between a broader cooling inflationary cycle with newly imposed tariffs by the Trump Administration.
Signs of cooling in rate-sensitive parts of the economy are increasingly visible. Residential investment remains subdued, with affordability challenges still weighing on home sales despite a modest drop in mortgage rates. Commercial real estate, especially office space, continues to struggle with vacancy and refinancing risk. Business capital spending has softened, particularly among smaller firms facing tighter lending standards.
Globally, the economic outlook remains mixed. Europe is facing stagnant growth, while China is managing a sluggish recovery amid weak consumer demand and ongoing property sector woes. Trade volumes are gradually recovering, but new patterns of supply chain diversification and industrial realignment are creating longer-term structural shifts. The U.S. is benefitting from “friendshoring” and renewed interest in domestic production, but the transition carries upfront costs that feed into prices and investment uncertainty.
Looking forward, the Federal Reserve is expected to begin lowering interest rates cautiously, with the first cut likely coming at the end of this quarter if inflation continues to trend downward. Given the transient nature of tariffs impacting price growth, we suspect prices may revert to a more downward trend. However, policymakers remain concerned about the risk of cutting too early and reigniting inflation, especially given the ongoing strength in consumer demand and wage growth. Financial markets have largely priced in a gradual easing cycle, though volatility remains a risk if inflation data surprises to the upside.
In summary, the U.S. economy in August 2025 is in a transitional phase—shifting from post-pandemic overheating to a slower, more sustainable path. Inflation may come back down after some acceleration in June, the result of the transient and stepwise impact of recently implemented tariffs. Economic growth is moderating, but not collapsing. And policy is shifting from restraint to gradual accommodation. The challenge for the rest of the year will be to maintain this delicate balance, ensuring that disinflation continues without tipping the economy into contraction. In sum, the foundation is solid, but the path forward could prove to be tricky from a monetary perspective.
Note: This summary is based on data available as of early August 2025 and may be subject to revisions in future releases.
For questions about the report, please contact Ralph McLaughlin at ralph@openbrand.com
For press inquiries, please contact press@openbrand.com
About the OpenBrand CPI
This report offers insights into price trends across major consumer product categories representing a select mix of both durable and personal goods (see methodology below for more details). The data used in this report leverages OpenBrand’s industry-leading library of durable and personal goods pricing, promotion, and availability for over 200,000+ individual products. This more than doubles the coverage by the monthly Bureau of Labor Statistics (BLS) Consumer Price Index, which allows more timely and granular reporting of price changes in the market.
This free monthly report provides a broad summary of price changes (including promotional activity), category-specific pricing and promotional trends, and macroeconomic context. For those seeking deeper insights, weekly CPI reporting and monthly CPI forecasts (released next week) are available on a subscription basis with up to same-day SKU-level pricing data available in bulk downloadable files.
Subscribe
Get CPI & Real-Time Pricing Data Updates
The OpenBrand CPI-DPG is released monthly. Join our subscription list to be notified when new CPI data is available.
OpenBrand Methodological Notes
The OpenBrand CPI of Durable and Personal Goods is constructed using a data-driven methodology that ensures accuracy, timeliness, and transparency in measuring price trends for both short and long-lasting consumer products. The methodology consists of the following key components:
1. Data Collection
- Real-Time Price Tracking: Prices are sourced daily from online marketplaces, retail websites, and brick-and-mortar store listings.
- Retailer & Manufacturer Data: Aggregates pricing information from major retailers, direct-to-consumer brands, and wholesale suppliers into broader consumer categories.
- Temporal Coverage: Captures price variations over time, including daily discounts and price promotions
2. Product Selection & Tracking
- Durable and Personal Goods Focus: The index includes products with an expected lifespan of three years or more, such as home appliances, consumer electronics, and tools, as well as personal care products with a shorter lifespan, such as hair and skin care products, vitamins, over-the-counter medications, and oral care products.
- Brand & Model Tracking: Individual brands and models are monitored to reflect pricing shifts within competitive product segments, including both permanent changes in listing price as well as temporary promotional pricing.
3. Price Calculation, Adjustments, and Weighting
- Price Calculation: Tracks month-over-month and year-over-year price movements to measure price stability in the marketplace and take into account both longer-term changes in pricing (such as changes in manufacturer’s suggested retail price) as well as more short-term changes in pricing, such as promotional discounts and sales prices.
- SKU-Removal Instead of Hedonic Adjustments: When a product (or SKU) becomes unavailable in the BLS goods basket, the BLS implements a SKU-replacement procedure whereby the next most similar product is used in its place, and a quality (hedonic) adjustment procedure is performed to get closer to an apples-to-apples price comparison. Since OpenBrand has data on nearly 100% of the SKUs pricing history in a given product category, we can simply remove that SKU from the basket and rely on price changes of the remaining SKUs in that basket. This eliminates the need for hedonic adjustment in the OpenBrand CPI basket.
- Weighting and Aggregation Method: A weighted geometric mean formula is used to minimize volatility and improve stability in price trend analysis at both the product grouping and category level. Instead of using sales-volume weights when aggregating the index, we take an alternative approach by using persistence-based weights for aggregation. Instead of more frequently purchased items getting more weight in the BLS’ CPI calculation, OpenBrand takes a more novel approach by weighting items with a more established price history in the market more heavily in our CPI calculation than items with a less established history.
4. Reporting & Updates
- High-Frequency Updates: Published freely on a monthly basis, with a subscription option for daily summaries across categories, sub-categories, and individual products.
- Comparative Benchmarks: We aggregate pricing as analogously as possible to traditional BLS CPI measures for benchmarking purposes.
- Transparency & Accessibility: Provides both open and paid data access for journalists, researchers, businesses, and policymakers.
By leveraging real-time data and advanced statistical techniques, the OpenBrand CPI offers an accurate and dynamic measure of pricing trends, helping businesses and consumers make informed decisions in an evolving economic landscape.
OpenBrand CPI - Durable and Personal Goods
Groups and Products
Appliance Group
Air Conditioners
Air Purifiers
Beverage Coolers
Blenders
Coffee Makers
Cooktops & Wall Ovens
Countertop Cooking
Countertop Microwaves
Dehumidifiers
Dishwashers
Dryers
Freezers
Icemakers
Laundry
Ranges
Refrigerators
Vacuums
Washers
OTR (Over-the Range Microwaves)
Communications Group
Business Printers
Desktops
Headsets
HED
Ink
Large Printers
MFP Copiers
Monitors
Notebooks
Personal & SOHO Printers
Projectors
Smartphones
Tablets & Detachables
Toner
Wearables
Wireless Routers
Home Improvement Group
Bathroom Faucets
Cutting Machines
Door Locks
Generators
Grass Seed
Handhelds
Hand Tools
Kitchen Cleanup
Kitchen Faucets
Lawn Fertilizer
Lawn Products
Log Splitters
Mowers
Outdoor Cooking & Accessories
Pesticides
Power Tools & Accessories
Pressure Washer
Replacement Batteries
Smart Doorbells
Smart Locks
Smart Cameras
Smart Thermostats
Snow Throwers
Weed Killer
Recreation Group
Bluetooth Speakers
Bluray
Digital Camcorders
Digital Cameras
Headphones
Media Players
Photo Paper
Sewing Machines
Sound Bars
Speaker Systems
TVs
VAW Speakers
Personal Care Group
Bath Products
Contraceptives
Cosmetics (Eye, Facial, Nail)
Deodorants
Diabetic Products
Digestive (Lower GI, Upper GI, Hemorrhoidal)
Ear Care Products
Eye Care Products
Feminine Needs (Sanitary Napkins/Tampons & Women’s Care)
First Aid Accessories & Treatments
Foot Care Products
Fragrance
Hair Care (Coloring, Growth, Shampoo, Conditioner, Styling)
Hair Dryers
Home Health Care
Lip Preparations
Oral Care (Breath Fresheners, Accessories, Dentures, Mouthwash, Oral Hygiene, Toothpaste)
Pain (Analgesic, External & Internal)
Sexual Wellness
Shave (Non-Razor Blades, Creams, Razors)
Skin Care (Acne, Facial, Hand & Body)
Sleeping Remedies
Soap
Sun Care
Upper Respiratory (Cold/Allergy/Sinus Liquids & Tablets, Cough Drops/Lozenges, External, Nasal Products)
Vitamins, Minerals & Supplements
Wt Ctl/Nutrition (Tablets & Liquid, Powder Wipes, Towelettes)
PREPARED BY
Contact Us
For questions about the report, contact Ralph McLaughlin at ralph@openbrand.com
For press inquiries, contact press@openbrand.com
For full data access on a subscription basis, click the button below to request a demo of the offering.

Consumer Price Index: Durable and Personal Goods | June 2025
This is the July 2025 release of the OpenBrand Consumer Price Index (CPI) – Durable and Personal Goods report that covers price movements in June 2025.
DISCLAIMER: This report is provided ‘as is’ for informational purposes only. OpenBrand makes no representations or warranties regarding the accuracy, completeness, or reliability of the data. Users assume all risks associated with their use of this report. OpenBrand shall not be liable for any losses or damages arising from the use of this report.
June Brings Further Acceleration of the OpenBrand CPI-DPG
Price growth for consumer durables and personal goods once again accelerated on a monthly basis in June, with a month-over-month increase of 0.76% compared to a revised monthly 0.48% increase in May. Price growth was driven primarily by acceleration of communication, personal care, and recreation products. Across the largest moving categories in June 2025, price growth acceleration was concentrated among hair dryers, headphones, mowers, printers, and printer ink, with monthly increases of between +0.6% and 2.0%.
Table of Contents
- Key CPI Takeaways for June 2025 & Macroeconomic Outlook
- Product Group Highlights
- CPI 2025 Forecast: Macroeconomic Summary
- Methodology
2025 H1 Pricing Lookback
Now that the first half of 2025 is behind us, an important question to ask is: which product categories have seen the largest price increases since the beginning of the year? Simply put, the largest increases have been among consumer electronics and appliances, with the top 10 categories in price growth showing a net annual increase of between 4.2% and 2.6%
Consumer tech and kitchen gear saw the sharpest price jumps in the first half of 2025.
-
Sound bars led with a 4.2% increase, followed by headphones (3.8%) and over-the-range microwaves (3.7%).
-
Home office essentials weren’t far behind—monitors, printers, and ink rose between 3.1%–3.5%, signaling ongoing demand for hybrid work setups.
-
Hair dryers and TVs ticked up 3.0%, while toner and laundry appliances saw more modest hikes of 2.7% and 2.6%.
Across the board, electronics and appliances continue to feel inflationary pressure, with entertainment and work-from-home gear leading the charge.
June 2025 OpenBrand CPI-DPG Summary and Macroeconomic Outlook
Overall OpenBrand Consumer Price Index Movement: The OpenBrand CPI of Durable and Personal Goods recorded a +0.76% monthly change in June, notching the seventh consecutive month-over-month increase and 12th of the last 13th, as retailers continue passing along some of the costs of their import tariffs to consumers. The magnitude of price change also accelerated in June, with yet another considerable increase over the prior month’s increase of +0.48%.
Discount Trends: June again brought very slight changes to the frequency and magnitude of discounts to the durables and personal goods sector, with frequencies rising month-over-month to 21.2% of all durable and personal goods from 20.5% in the month prior, and the typical magnitude remaining unchanged at 19.5%. How is it possible that prices could rise while the frequency of discounts increases? Simply put, retailers are likely using psychological warfare to soften the blow of price increases by increasing the list price of products while discounting more of them to a shelf price that is higher than prior months.
Product Group Price Trends: Three product groups – Communications, Personal Care, and Recreation – all experienced sharp increases in price growth from the prior month, while two groups – Appliances and Home Improvement – experienced positive but slowing rates of price growth.
- Appliance Group (+0.29%)
- Communication Group (+0.86%)
- Home Improvement Group (+0.39%)
- Personal Care Group (+0.58%)
- Recreation Group (+1.51%)
See the full breakdown of product groupings.
Product Group Highlights
CPI: Appliances
Prices for appliances increased by +0.29% on a month-over-month basis in June, slowing from a revised decrease of 0.77% in the month prior. The deceleration in price growth was at least partially driven by an increase in the frequency of discounts (42.6% from 40.6% the month prior), while the typical discount magnitude remained unchanged at 16.5% The trend remains relatively stable at between 38% and 43% for frequencies, and mid-teens for discounts, since May 2024.
CPI: Communication
Prices of communication devices, including phones, tablets, computers, and printers, rose on a month-over-month basis to 0.86%, up from a revised 0.25% the month prior. While both the frequency and magnitude of discounts increased in June, from 7.74% to 9.84% and 19.0% to 19.9%, respectively, net prices are still rising at least in part because sellers are also raising their list prices while maintaining, and even expanding, existing discounts to take the sting out of rising prices.
CPI: Home Improvement
The index for home improvement goods decelerated to +0.39% on a month-over-month basis, showing 26 consecutive month-over-month flat or monthly increases but down from +0.78% May. The increase in prices comes amidst increases in both the frequency (rising to 12.7% from 11.0%) and magnitude (rising to 17.9% from 17.0%), suggesting that retailers of home improvement goods continue to increase their list prices while maintaining and even increasing promotional discounts in order to help ease the sting of rising prices.
CPI: Personal Care
Prices of personal care products increased sharply again on a monthly basis in June 2025 by +0.58%, up from +0.19% in May. This increase comes during changes in both the frequency and magnitude of discounts, with the frequency increasing to 21.9% from 19.4%, while the typical discount magnitude decreased from 21.5% in May to 21.2% in June.
CPI: Recreation
Prices of recreational products, including TVs, headphones, and speaker systems, increased sharply by +1.77% on a month-over-month basis in June, up from a revised +0.42% in May. This is the 12th increase over the past 13 months. Some of this sharp increase in the pace of price growth is at least partially due to a sharp decrease in the frequency of discounts – to 18.9% in June from 23.6% in May – and a slight decrease in the average magnitude of discounts – to 22.2% from 23.4% over the same time period.
Macroeconomic Outlook Update
As of mid-2025, global price growth continues to moderate from the post-pandemic highs seen in 2022 and 2023. However, inflation remains uneven across sectors and regions due to lingering supply-side constraints, tariff-driven cost pressures, and resilient demand in key service industries. Policymakers are now navigating a narrow path: ensuring inflation continues to fall without triggering a sharp economic slowdown.
Inflation in most advanced economies has eased to around 2–3%, down from double-digit peaks. Emerging markets have seen more variation, with some countries experiencing renewed inflation due to currency depreciation and energy price volatility. In the United States, headline inflation ticked up slightly in Q2 2025, driven by new tariffs on goods from China and Mexico, as well as seasonal increases in travel, energy, and food prices. Core inflation, however, is trending downward, suggesting a gradual return to the Federal Reserve’s 2% target, as the influence of pandemic-era bottlenecks wanes.
While our data shows inflation for durable and personal goods accelerated again in June, our outlook for July is more modest, especially given last week’s announcement (Monday, July 7) that the reciprocal tariff deadline – originally planned for July 9th – would be extended to August 1st.
Also in the announcement, President Trump set out plans for a 40% tariff on goods from Myanmar and Laos, a 36% tariff on goods from Thailand and Cambodia, a 35% tariff on goods from Serbia and Bangladesh, a 32% tariff on Indonesia, a 30% tariff on goods from South Africa and a 25% tariff on goods from Japan, Malaysia, South Korea, and Tunisia. If these tariffs are indeed implement on August 1st, we could see inflation continue to rise well into 2025Q3 and beyond.
Key Drivers of Price Growth in 2025 H2
New tariffs imposed in early 2025, especially by the U.S., are adding to the cost of durable goods, electronics, and construction materials. Firms are passing some of these costs to consumers. Labor markets remain tight in many economies, especially in healthcare, education, and hospitality, contributing to persistent services inflation. Oil prices rose modestly due to production cuts by major exporters and ongoing geopolitical uncertainty in the Middle East and Eastern Europe. Food prices have been volatile due to extreme weather events disrupting supply chains. Increased use of AI and automation in logistics, retail, and manufacturing is helping to mitigate some inflationary pressures, particularly in goods-producing sectors.
Sector Highlights
Consumer Durables: Prices are rising modestly due to tariffs and global shipping costs, especially among products that did not qualify for the April 2025 tariff exemptions, which covered products like smartphones, computers, laptops, monitors, memory cards, semiconductor devices, modems, routers, and flat panel displays
Housing: The housing market is poised to have one of the slowest non-recessionary years in recent history. Higher mortgage rates are dampening demand, but limited inventory is keeping prices elevated in some urban areas.
Healthcare and Education: These sectors continue to see above-average inflation due to labor intensity and limited productivity gains.
Transportation: Airline and automotive prices are elevated compared to last year, driven by fuel costs and supply chain rebuilding.
Monetary Policy Outlook
Central banks, including the Federal Reserve and the European Central Bank, have paused interest rate hikes but remain cautious. Markets anticipate potential rate cuts in late 2025 or early 2026, contingent on further inflation moderation and stable labor markets. Policymakers are wary of cutting too soon and reigniting inflationary pressures, especially in politically sensitive sectors like housing and food.
How Will the One Big Beautiful Bill Affect the U.S. Economy and Inflation?
The One Big Beautiful Bill Act (OBBBA), signed into law on July 4, 2025, introduces significant changes to U.S. fiscal policy, with immediate and long-term implications for the economy and inflation.
In the near term, the OBBBA is expected to provide a modest boost to economic growth. Analyses suggest an average GDP increase of 0.2 to 0.4 percentage points annually through 2027, primarily due to tax cuts and increased government spending . Proponents argue that these measures will enhance consumer spending and business investment. However, critics caution that the benefits may be unevenly distributed and could exacerbate income inequality .
Over the next decade, the OBBBA is projected to significantly increase the federal deficit. The Congressional Budget Office estimates an addition of $2.8 trillion to the national debt by 2034 .
These fiscal changes may lead to higher interest rates and reduced private investment, potentially slowing long-term economic growth .
The substantial increase in government spending and tax cuts could exert upward pressure on inflation. Additionally, the weakening of the U.S. dollar and potential reluctance from foreign investors to purchase U.S. debt could further complicate monetary policy .
The OBBBA rolls back several clean energy initiatives, including tax credits for renewable energy and electric vehicles. These changes could increase household energy costs and result in significant job losses in the clean energy sector.
The legislation introduces work requirements for Medicaid and SNAP recipients and reduces funding for these programs. The Congressional Budget Office estimates that approximately 10.9 million Americans could lose health insurance coverage as a result. Such changes could lead to increased medical debt and adverse health outcomes, particularly among low-income populations.
While the One Big Beautiful Bill Act aims to stimulate economic growth through tax cuts and increased spending, it raises concerns about long-term fiscal sustainability, inflation, and the well-being of vulnerable populations. The legislation’s impact on clean energy initiatives and social programs may have lasting effects on the U.S. economy and public health, but could spur economic growth in the short-run through new and extended tax cuts to middle and higher-income workers.
Note: This summary is based on data available as of early July 2025 and may be subject to revisions in future releases.
For questions about the report, please contact Ralph McLaughlin at ralph@openbrand.com
For press inquiries, please contact press@openbrand.com
About the OpenBrand CPI
This report offers insights into price trends across major consumer product categories representing a select mix of both durable and personal goods (see methodology below for more details). The data used in this report leverages OpenBrand’s industry-leading library of durable and personal goods pricing, promotion, and availability for over 200,000+ individual products. This more than doubles the coverage by the monthly Bureau of Labor Statistics (BLS) Consumer Price Index, which allows more timely and granular reporting of price changes in the market.
This free monthly report provides a broad summary of price changes (including promotional activity), category-specific pricing and promotional trends, and macroeconomic context. For those seeking deeper insights, weekly CPI reporting and monthly CPI forecasts (released next week) are available on a subscription basis with up to same-day SKU-level pricing data available in bulk downloadable files.
Subscribe
Get CPI & Real-Time Pricing Data Updates
The OpenBrand CPI-DPG is released monthly. Join our subscription list to be notified when new CPI data is available.
OpenBrand Methodological Notes
The OpenBrand CPI of Durable and Personal Goods is constructed using a data-driven methodology that ensures accuracy, timeliness, and transparency in measuring price trends for both short and long-lasting consumer products. The methodology consists of the following key components:
1. Data Collection
- Real-Time Price Tracking: Prices are sourced daily from online marketplaces, retail websites, and brick-and-mortar store listings.
- Retailer & Manufacturer Data: Aggregates pricing information from major retailers, direct-to-consumer brands, and wholesale suppliers into broader consumer categories.
- Temporal Coverage: Captures price variations over time, including daily discounts and price promotions
2. Product Selection & Tracking
- Durable and Personal Goods Focus: The index includes products with an expected lifespan of three years or more, such as home appliances, consumer electronics, and tools, as well as personal care products with a shorter lifespan, such as hair and skin care products, vitamins, over-the-counter medications, and oral care products.
- Brand & Model Tracking: Individual brands and models are monitored to reflect pricing shifts within competitive product segments, including both permanent changes in listing price as well as temporary promotional pricing.
3. Price Calculation, Adjustments, and Weighting
- Price Calculation: Tracks month-over-month and year-over-year price movements to measure price stability in the marketplace and take into account both longer-term changes in pricing (such as changes in manufacturer’s suggested retail price) as well as more short-term changes in pricing, such as promotional discounts and sales prices.
- SKU-Removal Instead of Hedonic Adjustments: When a product (or SKU) becomes unavailable in the BLS goods basket, the BLS implements a SKU-replacement procedure whereby the next most similar product is used in its place, and a quality (hedonic) adjustment procedure is performed to get closer to an apples-to-apples price comparison. Since OpenBrand has data on nearly 100% of the SKUs pricing history in a given product category, we can simply remove that SKU from the basket and rely on price changes of the remaining SKUs in that basket. This eliminates the need for hedonic adjustment in the OpenBrand CPI basket.
- Weighting and Aggregation Method: A weighted geometric mean formula is used to minimize volatility and improve stability in price trend analysis at both the product grouping and category level. Instead of using sales-volume weights when aggregating the index, we take an alternative approach by using persistence-based weights for aggregation. Instead of more frequently purchased items getting more weight in the BLS’ CPI calculation, OpenBrand takes a more novel approach by weighting items with a more established price history in the market more heavily in our CPI calculation than items with a less established history.
4. Reporting & Updates
- High-Frequency Updates: Published freely on a monthly basis, with a subscription option for daily summaries across categories, sub-categories, and individual products.
- Comparative Benchmarks: We aggregate pricing as analogously as possible to traditional BLS CPI measures for benchmarking purposes.
- Transparency & Accessibility: Provides both open and paid data access for journalists, researchers, businesses, and policymakers.
By leveraging real-time data and advanced statistical techniques, the OpenBrand CPI offers an accurate and dynamic measure of pricing trends, helping businesses and consumers make informed decisions in an evolving economic landscape.
OpenBrand CPI - Durable and Personal Goods
Groups and Products
Appliance Group
Air Conditioners
Air Purifiers
Beverage Coolers
Blenders
Coffee Makers
Cooktops & Wall Ovens
Countertop Cooking
Countertop Microwaves
Dehumidifiers
Dishwashers
Dryers
Freezers
Icemakers
Laundry
Ranges
Refrigerators
Vacuums
Washers
OTR (Over-the Range Microwaves)
Communications Group
Business Printers
Desktops
Headsets
HED
Ink
Large Printers
MFP Copiers
Monitors
Notebooks
Personal & SOHO Printers
Projectors
Smartphones
Tablets & Detachables
Toner
Wearables
Wireless Routers
Home Improvement Group
Bathroom Faucets
Cutting Machines
Door Locks
Generators
Grass Seed
Handhelds
Hand Tools
Kitchen Cleanup
Kitchen Faucets
Lawn Fertilizer
Lawn Products
Log Splitters
Mowers
Outdoor Cooking & Accessories
Pesticides
Power Tools & Accessories
Pressure Washer
Replacement Batteries
Smart Doorbells
Smart Locks
Smart Cameras
Smart Thermostats
Snow Throwers
Weed Killer
Recreation Group
Bluetooth Speakers
Bluray
Digital Camcorders
Digital Cameras
Headphones
Media Players
Photo Paper
Sewing Machines
Sound Bars
Speaker Systems
TVs
VAW Speakers
Personal Care Group
Bath Products
Contraceptives
Cosmetics (Eye, Facial, Nail)
Deodorants
Diabetic Products
Digestive (Lower GI, Upper GI, Hemorrhoidal)
Ear Care Products
Eye Care Products
Feminine Needs (Sanitary Napkins/Tampons & Women’s Care)
First Aid Accessories & Treatments
Foot Care Products
Fragrance
Hair Care (Coloring, Growth, Shampoo, Conditioner, Styling)
Hair Dryers
Home Health Care
Lip Preparations
Oral Care (Breath Fresheners, Accessories, Dentures, Mouthwash, Oral Hygiene, Toothpaste)
Pain (Analgesic, External & Internal)
Sexual Wellness
Shave (Non-Razor Blades, Creams, Razors)
Skin Care (Acne, Facial, Hand & Body)
Sleeping Remedies
Soap
Sun Care
Upper Respiratory (Cold/Allergy/Sinus Liquids & Tablets, Cough Drops/Lozenges, External, Nasal Products)
Vitamins, Minerals & Supplements
Wt Ctl/Nutrition (Tablets & Liquid, Powder Wipes, Towelettes)
PREPARED BY
Contact Us
For questions about the report, contact Ralph McLaughlin at ralph@openbrand.com
For press inquiries, contact press@openbrand.com
For full data access on a subscription basis, click the button below to request a demo of the offering.

Consumer Price Index: Durable and Personal Goods | May 2025
This is the June 2025 release of the OpenBrand Consumer Price Index (CPI) – Durable and Personal Goods report that covers price movements in May 2025.
Table of Contents
- May 2025 CPI Headline & Summary
- Key CPI Takeaways for May 2025 & Macroeconomic Outlook
- Product Group Highlights
- CPI 2025 Forecast: May 2025 Macroeconomic Summary
- Subscribe
- Methodology
- Product Group Breakdown
DISCLAIMER: This report is provided ‘as is’ for informational purposes only. OpenBrand makes no representations or warranties regarding the accuracy, completeness, or reliability of the data. Users assume all risks associated with their use of this report. OpenBrand shall not be liable for any losses or damages arising from the use of this report.
May 2025 CPI: May Brings Sharp Acceleration of the OpenBrand CPI-DPG as Tariffs Kick-In
Price growth for consumer durables and personal goods accelerated sharply on a monthly basis in May, with a month-over-month increase of 0.53% compared to a revised monthly 0.35% increase in April. Price growth was driven primarily by acceleration of appliances, home improvement, and personal care products. Across the largest moving categories, price growth acceleration was concentrated in acne care, dishwashers, hair styling products, countertop microwaves, outdoor cooking, shaving razors, sound bars, and TVs, with monthly increases of between +1.24% and 2.92%.
We attribute some of the recent acceleration in price growth to the continued and varied enforcement of U.S. tariffs on specific product types. The tariffs have targeted a wide range of goods imported from China and other major U.S. trading partners, and span a variety of goods covered in our CPI basket. What’s more, some products – particularly those imported from China that aren’t part of the April exclusion with a high turnover- are more susceptible to the impacts of tariffs than others, as importers and retailers of such goods face increasing pressure to pass costs onto consumers. For example, prices for items like acne care, dishwashers, hair styling products, countertop microwaves, outdoor cooking, shaving razors, sound bars, and TVs accelerated the most, with an acceleration of price growth across these categories from -2.93% to -0.45% in April to +1.24% to 2.92% in May.
May 2025 OpenBrand CPI-DPG Summary and Macroeconomic Outlook
Overall OpenBrand Consumer Price Index Movement: The OpenBrand CPI of Durable and Personal Goods recorded a 0.53% monthly change in May, notching the sixth consecutive month-over-month increase as retailers begin passing along some of the costs of their import tariffs to consumers. The magnitude of price change accelerated again in May, with a considerable increase over last month’s increase of 0.35%.
Discount Trends: May again brought very slight changes to the frequency and magnitude of discounts to the durables and personal goods sector, with frequencies rising month-over-month to 21.2% of all durable and personal goods from 21.1% in the month prior, and the typical magnitude remaining unchanged at 19.5%. Given lingering uncertainty surrounding the current state of trade negotiations, we expect discounting activity to remain steady, or even decrease, over the coming months.
Product Group Price Trends: Three product groups – Appliances, Home Improvement, and Personal Care – all experienced sharp increases in price growth from the prior month, while two groups – Communication and Recreation – experienced positive but slowing rates of price growth.
- Appliance Group (+0.77%)
- Communication Group (+0.14%)
- Home Improvement Group (+0.81%)
- Personal Care Group (+5.6%)
- Recreation Group (+3.6%)
See the full breakdown of product groupings.
Product Group Highlights
CPI: Appliances
Prices for appliances increased sharply by +0.77% on a month-over-month basis in May, accelerating from a revised decrease of 0.09% in the month prior. The acceleration in price growth was at least partially driven by a small decrease in both the frequency (40.7% from 41.3% the month prior) and magnitude (16.8% from 16.6%) of discounts, but the trend has been relatively stable at between 38% and 43% for frequencies, and mid-teens for discounts, since May 2024.
CPI: Communication
Prices of communication devices, including phones, tablets, computers, and printers, rose on a month-over-month basis to 0.14%, down from a revised 0.97% the month prior. Some of the slowdown in price growth was likely due to an increase in both the frequency and magnitude of discounts. The frequency of discounts increased over the month from 5.5% in April to 7.9% in May, but both months were down by about half since May 2024, when they ranged from about 12.0% to 14.5%. The magnitude of discounts decreased by just 30 basis points, from 18.7% in April to 19.0% in May.
CPI: Home Improvement
The index for home improvement goods increased sharply in May to +0.81% on a month-over-month basis, showing 26 consecutive month-over-month flat or monthly increases and up from +0.59% April. The increase in prices comes amidst relatively minor changes in both the frequency and magnitude of discounts, suggesting that such price changes are being driven by upward adjustments in shelf pricing. The frequency of discounts was 11.1% of products in May, down from 12.1% in April. In addition to the decrease in the share of products with a discount, the magnitude of discounts also decreased slightly month-over-month, falling from 17.4% in April to 16.9% in May.
CPI: Personal Care
Prices of personal care products increased sharply on a monthly basis in May 2025 by 0.56%, a strong reversal of trends of -0.14% in March and -0.39% in April. This increase comes during changes in both the frequency and magnitude of discounts, with the frequency decreasing by 140 basis points from 24.0% in April to 22.6% in May. The typical discount magnitude increased very slightly, from 21.2% in April to 21.3% in May.
CPI: Recreation
Prices of recreational products, including TVs, headphones, and speaker systems, increased by 0.36% on a month-over-month basis in May, down from a revised 0.70% in April. This is the tenth increase over the past eleven months. Some of this slowdown in the pace of price growth is at least partially due to an increase in the frequency of discounts – to 23.8% in May from 22.8% in April – and a slight increase in the average magnitude of discounts – to 23.5% from 23.3% over the same time period.
June 2025 Macroeconomic Outlook Update
The U.S. economy has entered a period of moderated growth, shaped heavily by trade policy developments and persistent inflationary pressures. Following a strong 2024, economic momentum softened in early 2025. The first quarter saw a -0.3% contraction in real GDP, primarily driven by a front-loaded surge in imports as businesses moved to circumvent new tariffs introduced under the Trump administration. Despite the contraction, domestic demand remains relatively healthy, with consumer spending and capital investment providing ongoing support. Our outlook still assumes the U.S. economy avoids a recession in 2025, with full-year GDP growth expected to land at 1.3%, increasing to 1.5% in 2026. Growth will remain below trend, however, and macroeconomic risks remain elevated.
The Federal Reserve has held its policy rate steady at 4.25%–4.5%, though we expect it to begin cutting rates in Q3 and assume this will be a response to a continued slowdown in economic activity. Markets now anticipate three 25-basis-point cuts in the second half of 2025, eventually bringing the federal funds rate closer to its estimated neutral level of 3% by 2026. Long-term yields are expected to stay near 4.2%, as elevated inflation and fiscal concerns limit downward pressure.
While headline BLS CPI and BEA PCE inflation has decelerated in recent months, as we show below this improvement may be temporary. New tariffs implemented in April are expected to reaccelerate inflation in the second half of the year. That said, our forecast is that the BLS CPI will peak near 2% on a year-over-year basis for consumer durables before returning to a deflationary trend that existed prior to the current tariff environment.
Labor market conditions remain solid but are softening. April saw a gain of 177,000 jobs, with unemployment holding at 4.2%. Job growth is expected to slow into 2026, with the unemployment rate projected to reach 4.9% by year-end 2026. The 2025 forecast includes approximately 900,000 new jobs, though the labor market is expected to flatline next year.
Tariffs remain the most influential policy lever impacting the near-term outlook. The effective tariff rate is projected to peak around 20% by mid-2025, gradually falling to 8% by the end of President Trump’s term. While some sectors experienced a short-term boost from inventory stockpiling, the broader economic impact is negative—particularly for import-reliant industries and capital-intensive sectors facing rising input costs.
The housing sector is under pressure from rising materials costs and a constrained labor supply due to immigration restrictions. While underlying demand remains intact, affordability challenges and elevated mortgage rates are limiting both new starts and existing home sales. National home prices are expected to post low single-digit growth. In commercial real estate, persistent vacancy rates and high borrowing costs are weighing on valuations, though “extend-and-pretend” lending strategies are preventing widespread distress.
Key Risks to Monitor, Summer 2025:
- Downside: Sustained or escalating tariffs, renewed inflation shocks, tighter financial conditions, or a deterioration in global growth.
- Upside: Faster easing of trade tensions, stronger-than-expected labor force growth, or a sustained rebound in productivity.
In summary, the June 2025 outlook reflects a U.S. economy in transition—moving from recovery to a slower, more fragile expansion. Monetary policy easing is likely, but contingent on inflation trends. Trade policy will remain a primary driver of macroeconomic volatility in the months ahead, and internal planning should reflect both the potential for policy normalization and elevated downside risk.
Note: This summary is based on data available as of early June 2025 and may be subject to revisions in future releases.
About the OpenBrand CPI
This report offers insights into price trends across major consumer product categories representing a select mix of both durable and personal goods (see methodology below for more details). The data used in this report leverages OpenBrand’s industry-leading library of durable and personal goods pricing, promotion, and availability for over 200,000+ individual products. This more than doubles the coverage by the monthly Bureau of Labor Statistics (BLS) Consumer Price Index, which allows more timely and granular reporting of price changes in the market.
This free monthly report provides a broad summary of price changes (including promotional activity), category-specific pricing and promotional trends, and macroeconomic context. For those seeking deeper insights, weekly CPI reporting and monthly CPI forecasts (released next week) are available on a subscription basis with up to same-day SKU-level pricing data available in bulk downloadable files.
Subscribe
Get CPI & Real-Time Pricing Data Updates
The OpenBrand CPI-DPG is released monthly. Join our subscription list to be notified when new CPI data is available.
OpenBrand Methodological Notes
The OpenBrand CPI of Durable and Personal Goods is constructed using a data-driven methodology that ensures accuracy, timeliness, and transparency in measuring price trends for both short and long-lasting consumer products. The methodology consists of the following key components:
1. Data Collection
- Real-Time Price Tracking: Prices are sourced daily from online marketplaces, retail websites, and brick-and-mortar store listings.
- Retailer & Manufacturer Data: Aggregates pricing information from major retailers, direct-to-consumer brands, and wholesale suppliers into broader consumer categories.
- Temporal Coverage: Captures price variations over time, including daily discounts and price promotions
2. Product Selection & Tracking
- Durable and Personal Goods Focus: The index includes products with an expected lifespan of three years or more, such as home appliances, consumer electronics, and tools, as well as personal care products with a shorter lifespan, such as hair and skin care products, vitamins, over-the-counter medications, and oral care products.
- Brand & Model Tracking: Individual brands and models are monitored to reflect pricing shifts within competitive product segments, including both permanent changes in listing price as well as temporary promotional pricing.
3. Price Calculation, Adjustments, and Weighting
- Price Calculation: Tracks month-over-month and year-over-year price movements to measure price stability in the marketplace and take into account both longer-term changes in pricing (such as changes in manufacturer’s suggested retail price) as well as more short-term changes in pricing, such as promotional discounts and sales prices.
- SKU-Removal Instead of Hedonic Adjustments: When a product (or SKU) becomes unavailable in the BLS goods basket, the BLS implements a SKU-replacement procedure whereby the next most similar product is used in its place, and a quality (hedonic) adjustment procedure is performed to get closer to an apples-to-apples price comparison. Since OpenBrand has data on nearly 100% of the SKUs pricing history in a given product category, we can simply remove that SKU from the basket and rely on price changes of the remaining SKUs in that basket. This eliminates the need for hedonic adjustment in the OpenBrand CPI basket.
- Weighting and Aggregation Method: A weighted geometric mean formula is used to minimize volatility and improve stability in price trend analysis at both the product grouping and category level. Instead of using sales-volume weights when aggregating the index, we take an alternative approach by using persistence-based weights for aggregation. Instead of more frequently purchased items getting more weight in the BLS’ CPI calculation, OpenBrand takes a more novel approach by weighting items with a more established price history in the market more heavily in our CPI calculation than items with a less established history.
4. Reporting & Updates
- High-Frequency Updates: Published freely on a monthly basis, with a subscription option for daily summaries across categories, sub-categories, and individual products.
- Comparative Benchmarks: We aggregate pricing as analogously as possible to traditional BLS CPI measures for benchmarking purposes.
- Transparency & Accessibility: Provides both open and paid data access for journalists, researchers, businesses, and policymakers.
By leveraging real-time data and advanced statistical techniques, the OpenBrand CPI offers an accurate and dynamic measure of pricing trends, helping businesses and consumers make informed decisions in an evolving economic landscape.
OpenBrand CPI - Durable and Personal Goods
Groups and Products
Appliance Group
Air Conditioners
Air Purifiers
Beverage Coolers
Blenders
Coffee Makers
Cooktops & Wall Ovens
Countertop Cooking
Countertop Microwaves
Dehumidifiers
Dishwashers
Dryers
Freezers
Icemakers
Laundry
Ranges
Refrigerators
Vacuums
Washers
OTR (Over-the Range Microwaves)
Communications Group
Business Printers
Desktops
Headsets
HED
Ink
Large Printers
MFP Copiers
Monitors
Notebooks
Personal & SOHO Printers
Projectors
Smartphones
Tablets & Detachables
Toner
Wearables
Wireless Routers
Home Improvement Group
Bathroom Faucets
Cutting Machines
Door Locks
Generators
Grass Seed
Handhelds
Hand Tools
Kitchen Cleanup
Kitchen Faucets
Lawn Fertilizer
Lawn Products
Log Splitters
Mowers
Outdoor Cooking & Accessories
Pesticides
Power Tools & Accessories
Pressure Washer
Replacement Batteries
Smart Doorbells
Smart Locks
Smart Cameras
Smart Thermostats
Snow Throwers
Weed Killer
Recreation Group
Bluetooth Speakers
Bluray
Digital Camcorders
Digital Cameras
Headphones
Media Players
Photo Paper
Sewing Machines
Sound Bars
Speaker Systems
TVs
VAW Speakers
Personal Care Group
Bath Products
Contraceptives
Cosmetics (Eye, Facial, Nail)
Deodorants
Diabetic Products
Digestive (Lower GI, Upper GI, Hemorrhoidal)
Ear Care Products
Eye Care Products
Feminine Needs (Sanitary Napkins/Tampons & Women’s Care)
First Aid Accessories & Treatments
Foot Care Products
Fragrance
Hair Care (Coloring, Growth, Shampoo, Conditioner, Styling)
Hair Dryers
Home Health Care
Lip Preparations
Oral Care (Breath Fresheners, Accessories, Dentures, Mouthwash, Oral Hygiene, Toothpaste)
Pain (Analgesic, External & Internal)
Sexual Wellness
Shave (Non-Razor Blades, Creams, Razors)
Skin Care (Acne, Facial, Hand & Body)
Sleeping Remedies
Soap
Sun Care
Upper Respiratory (Cold/Allergy/Sinus Liquids & Tablets, Cough Drops/Lozenges, External, Nasal Products)
Vitamins, Minerals & Supplements
Wt Ctl/Nutrition (Tablets & Liquid, Powder Wipes, Towelettes)
PREPARED BY
Contact Us
For questions about the report, contact Ralph McLaughlin at ralph@openbrand.com
For press inquiries, contact press@openbrand.com
For full data access on a subscription basis, click the button below to request a demo of the offering.