




Coming out of the first quarter, the home improvement market is being shaped by three major forces:
- Retailer share consolidating around the biggest home centers and Walmart
- Necessity-driven, value-first purchasing
- Continuous shifts in the housing market
Using data from OpenBrand’s latest Home Improvement Total Market Insights report [download now], we analyzed how consumers are shopping the home improvement category, where retailers are winning and losing share, and which home improvement brands are gaining traction.
While the data reflects Q1 2026, the trends highlighted below represent the current direction of the home improvement market through 2026.
SOURCE: All data insights in this article cover Q1 2026 data within the OpenBrand Total Market Insights Home Improvement composite. This includes 40+ categories across Building/Plumbing/Electric/Safety, Consumer Electronics, General HI Products, Kitchen & Bath Improvement, Lawn & Garden, and Power Tools & Accessories.
Summary: Home Improvement Market Key Stats
- Home Depot leads home improvement retailer unit share at 34%, followed by Lowe’s at 25%
- Lowe’s and Walmart gained unit share versus Q4 2025, while Amazon and Ace Hardware declined
- Home Depot draws 39% of shoppers and closes 75% of them, the highest rates on both measures
- Half (50%) of the shoppers Home Depot loses go to Lowe’s
- Rust-Oleum leads brand unit share at 9%, while Honeywell leads dollar share at 17%
- Products under $100 account for 39% of units among the top five brands
- 32% of home improvement purchases are made online
Who are the top retailers in the home improvement market?
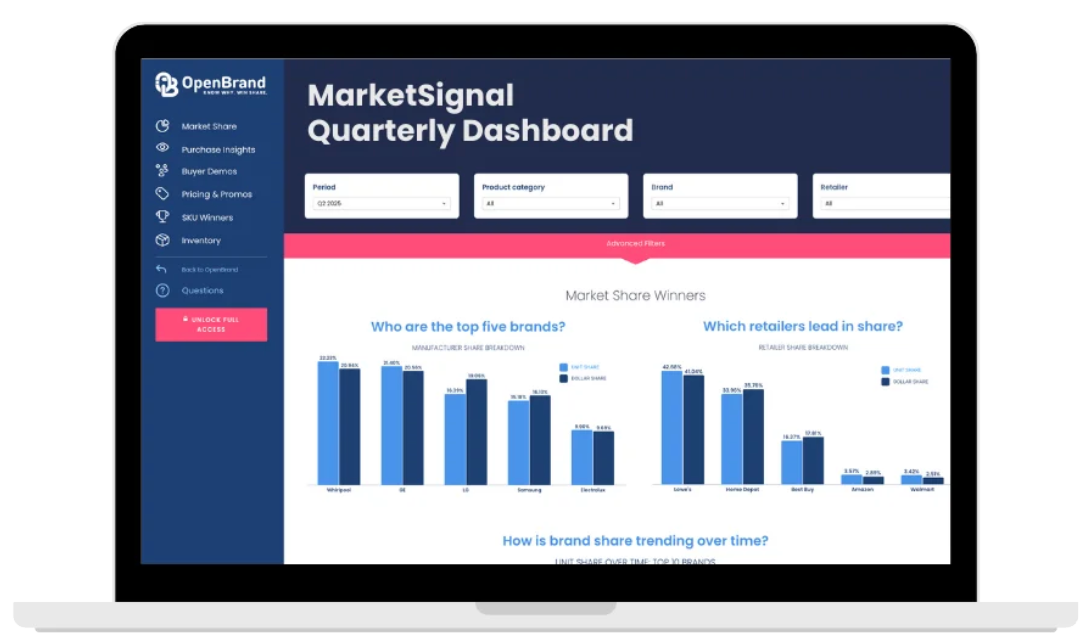
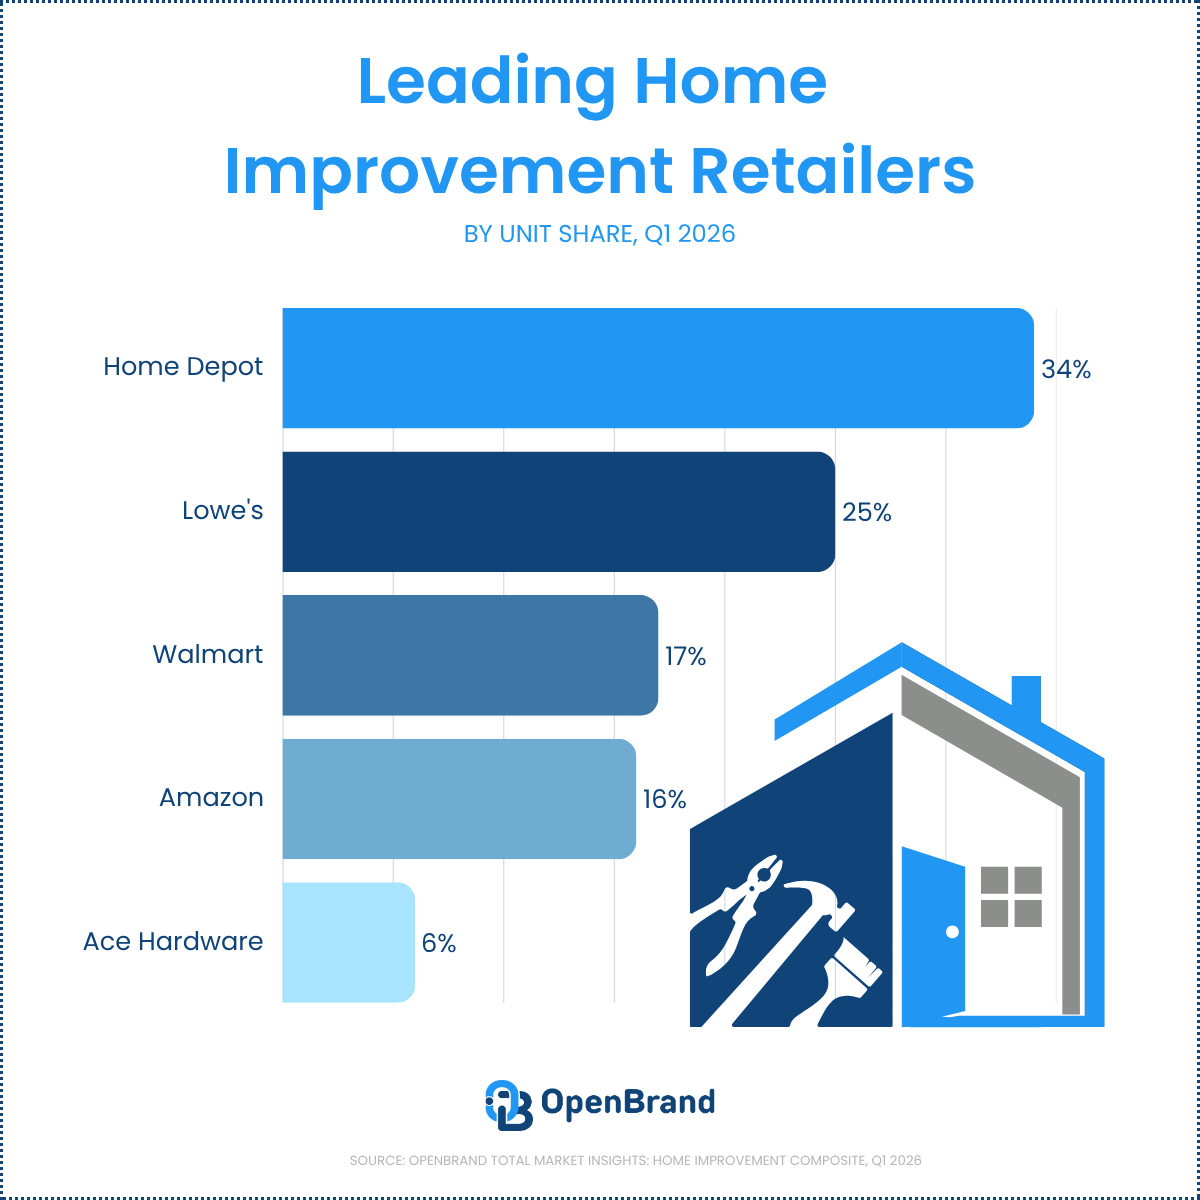
According to OpenBrand’s Q1 2026 market data, Home Depot holds a clear lead in the home improvement market with 34% of unit share, nine points ahead of Lowe’s. The more telling story is momentum: Lowe’s and Walmart both posted statistically significant unit share gains versus the prior quarter, while Amazon and Ace Hardware both slipped.
Top Home Improvement Retailers (Unit Share)
| Rank | Home Improvement Retailer | Unit Share (%) | Change vs. Q4 2025 |
| 1 | Home Depot | 34% | No significant change |
| 2 | Lowe's | 25% | Up |
| 3 | Walmart | 17% | Up |
| 4 | Amazon | 16% | Down |
| 5 | Ace Hardware | 6% | Down |
Source: OpenBrand Home Improvement Total Market Insights, Q1 2026
OpenBrand’s Home Improvement Trend Insights
The home improvement market is heavily skewed toward these primary retailers. For brands, this can mean retailer mix matters as much as total volume. A brand overweighted at Amazon or Ace Hardware will have felt a tougher quarter than one built around Lowe’s or Walmart, even if its own products performed well on the shelf.
For more home improvement retailer insights, including conversion rates, shopper leakage, and online purchasing behavior, download the full infographic.
Home improvement retailers are competing on conversion, not just traffic
Drawing shoppers in is only half the job. OpenBrand’s MindShare consumer survey data separates draw rate, the share of category shoppers who visit a retailer, from close rate, the share of those visitors who buy there.
Q1 2026 Home Improvement Retailer Draw & Close Rates
| Home Improvement Retailer | Draw Rate | Close Rate |
| Home Depot | 39% | 75% |
| Lowe’s | 32% | 60% |
| Walmart | 21% | 66% |
| Amazon | 11% | 69% |
| Ace Hardware | 6% | 57% |
Source: OpenBrand Home Improvement Total Market Insights, Q1 2026
Home Depot leads on both draw and close. Lowe’s draws nearly as many shoppers but converts 15 points fewer, while Amazon draws the fewest of the top four yet closes 69% of its visitors, second only to Home Depot. The opportunity for Amazon (11% draw) and Ace (15% draw) is to draw in more consumers and monopolize on their already proven strong close rates.
Want deeper insights into retailer conversion and shopper leakage trends? Download the infographic for the full breakdown.
OpenBrand’s Home Improvement Trend Insights
The gap between draw and close shows where each retailer’s opportunity sits:
- Lowe’s has the traffic, and its growth lever is converting more of the shoppers already walking in
- Walmart and Amazon close at higher rates than Lowe’s, so their lever is drawing more shoppers into the aisle or onto the page
- Home Depot’s challenge is defending a lead that is already strong on both measures
For category managers heading into a line review, these numbers frame the conversation with each buyer differently.
Shopper leakage shows who Home Depot is really competing with
Retail competition becomes clearest when a retailer loses a sale and someone else picks it up. OpenBrand’s proprietary retail leakage analysis tracks where those lost shoppers go.
Home Depot has a 25% walk rate, meaning one in four shoppers who consider Home Depot buy somewhere else.
Where Home Depot’s Lost Home Improvement Shoppers Go
| Retailer | Share of Lost Shoppers |
| Lowe's | 50% |
| Walmart | 13% |
| Amazon | 8% |
| Ace Hardware | 6% |
| Menards | 4% |
Source: OpenBrand Home Improvement Total Market Insights, Q1 2026
Half of the shoppers Home Depot fails to close go directly to Lowe’s, nearly four times the share that goes to Walmart, the next closest destination.
OpenBrand’s Home Improvement Trend Insights
This leakage data really exemplifies the long-standing head-to-head rivalry between Home Depot and Lowe’s in the home improvement market.
For brands sold at both home centers, this is a practical point. A shopper who walks out of Home Depot is more likely than not to see your assortment again at Lowe’s, which makes consistent presence across both retailers a defensive strategy as much as a growth one.
Value-driven pricing continues defining the home improvement market
According to OpenBrand’s market data, home improvement demand among the top five brands is concentrated at the low end of the price range, with nearly two in five units selling for under $100.
Home Improvement Market by Price Range (Unit Share, Top 5 Brands)
| Price Range | Share of Units |
| $0 to $99 | 39% |
| $100 to $199 | 21% |
| $200 to $349 | 16% |
| $350 to $500 | 11% |
| $501+ | 14% |
Source: OpenBrand Home Improvement Total Market Insights, Q1 2026. Figures may not total 100% due to rounding.
OpenBrand’s Home Improvement Trend Insights
The price curve says most home improvement purchases are practical, frequent, and modest in ticket size. Six in ten units among the top five brands sell for under $200.
The 14% of units above $500 still matters. It is a meaningful premium tier, and it is where dollar share can pull away from unit share, as the brand rankings below show.
Purchase drivers reinforce a value-first home improvement market
This pricing behavior becomes even more visible in what consumers say drives their choice of brand. According to OpenBrand’s MindShare consumer survey data, price edges out quality as the top factor in Q1 2026, but quality and features are the two drivers that gained ground versus the prior quarter.
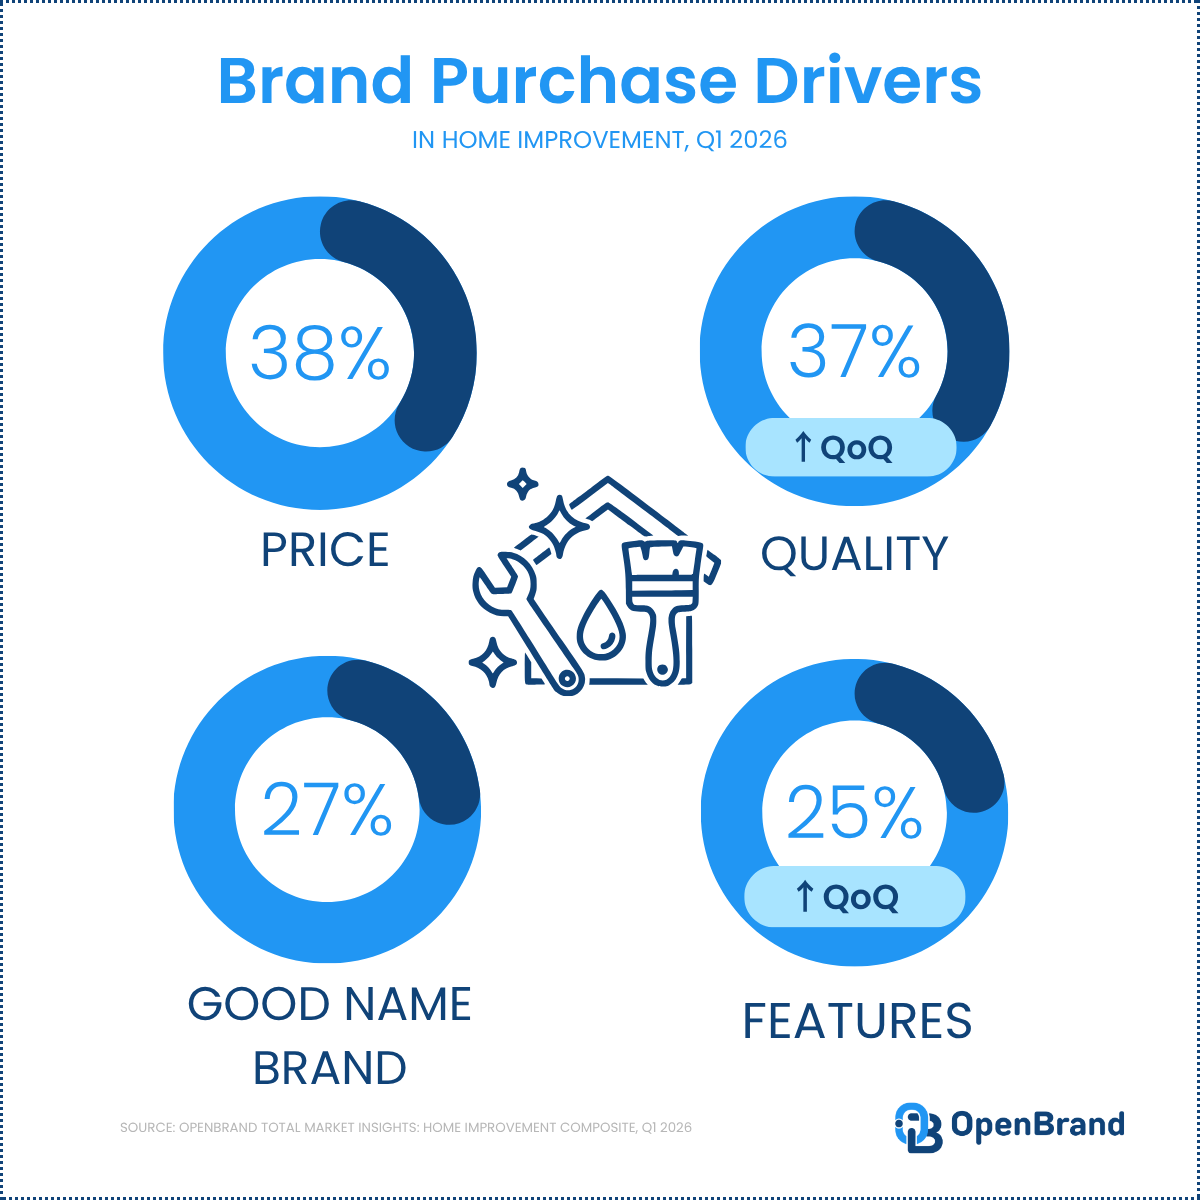
Top Purchase Drivers for Home Improvement Brands
| Driver | Share | Change vs. Q4 2025 |
| Price | 38% | No significant change |
| Quality | 37% | Up |
| Good Name Brand | 27% | No significant change |
| Features | 25% | Up |
Source: OpenBrand Home Improvement Total Market Insights, Q1 2026
On the product side, replacing a broken item is the leading reason consumers enter the market at 28%, while routine maintenance and repair accounts for 13%, down versus the prior quarter.
OpenBrand’s Home Improvement Trend Insights
Price still leads, but quality and features both rose significantly in Q1 2026. Shoppers are not trading down blindly. They want a fair price on something that will last and do the job well.
That shapes how brands should compete:
- price competitively at the entry tier where volume concentrates
- make quality claims concrete and visible at the shelf
- give shoppers a clear reason to step up to a better feature set
- be in stock when a replacement need hits, since those shoppers rarely wait
Top home improvement brands
Which brands lead home improvement market share in Q1 2026?
According to OpenBrand’s modeled MarketShare data, Rust-Oleum and Scotts lead home improvement brands on units, while Honeywell captures the largest share of dollars. The gap between those two rankings is the most important brand story in the composite this quarter.
The top five home improvement brands by unit share rarely compete for the same shopper. The Home Improvement composite rolls up more than 40 categories, and each leader draws its share from a different corner of it:
- Rust-Oleum: paint and coatings, led by spray paint
- Scotts: lawn care and fertilizer
- Kwikset: door locks and hardware
- Honeywell: thermostats and home comfort controls
- Spectracide: weed and pest control
That spread changes how the rankings should be read. A brand’s composite share reflects how large and how frequently purchased its home categories are, as much as how well it competes inside them. Scotts and Spectracide are the only pair in the top five that share a product group, both sitting in Lawn & Garden.
For category managers and buyers, composite share measures portfolio reach. The head-to-head scoreboard sits one level down: a Kwikset buyer is benchmarking against other lock brands, not against Rust-Oleum. OpenBrand’s data is available for each of the 40+ categories in this composite, which is where the competitive read for a line review belongs.
Top Home Improvement Brands by Unit and Dollar Share
| Rank | Home Improvement Brand | Unit Share | Dollar Share |
| 1 | Rust-Oleum | 9% | 3% |
| 2 | Scotts | 8% | 8% |
| 3 (tie) | Kwikset | 5% | 6% |
| 3 (tie) | Honeywell | 5% | 17% |
| 3 (tie) | Spectracide | 5% | 1% |
Source: OpenBrand Home Improvement Total Market Insights, Q1 2026
No brand holds more than 9% of units in a composite this broad, which leaves the category highly fragmented and gives challenger brands room to compete within individual categories.
Home Improvement SKU-Level Share Winners
| SKU | Unit Share | ASP | Min Price | Max Price |
| Honeywell Horizontal Thermostat (RTH111B) | 2% | $29 | $28 | $29 |
| Honeywell Home Programmable Thermostat (RTH20B) | 2% | $35 | $34 | $37 |
| Rust-Oleum 12 oz. American Accents Flat Spray Paint Black (327866) | 1% | $18 | $7 | $31 |
Source: OpenBrand Home Improvement Total Market Insights, Q1 2026
The top-selling SKUs show how low-ticket the volume end of the market is. The Rust-Oleum spray paint sold anywhere from $7 to $31, a wide spread for an $18 average item, while both Honeywell thermostats held tight price bands.
For more insights into top home improvement brands, including share of shelf, discount depth, and product debuts, download the full infographic.
OpenBrand’s Home Improvement Trend Insights
Unit share and dollar share tell two very different stories in Q1 2026. Rust-Oleum leads on units but captures just 3% of dollars, consistent with a portfolio built on lower-priced items like spray paint. Honeywell ties for third on units yet leads all brands with 17% of dollars, more than three times its unit share.
Scotts is the only top brand with matching unit and dollar share at 8%. Any brand ranking its position on units alone is missing half the picture.
Product strategy is diverging across home improvement brands
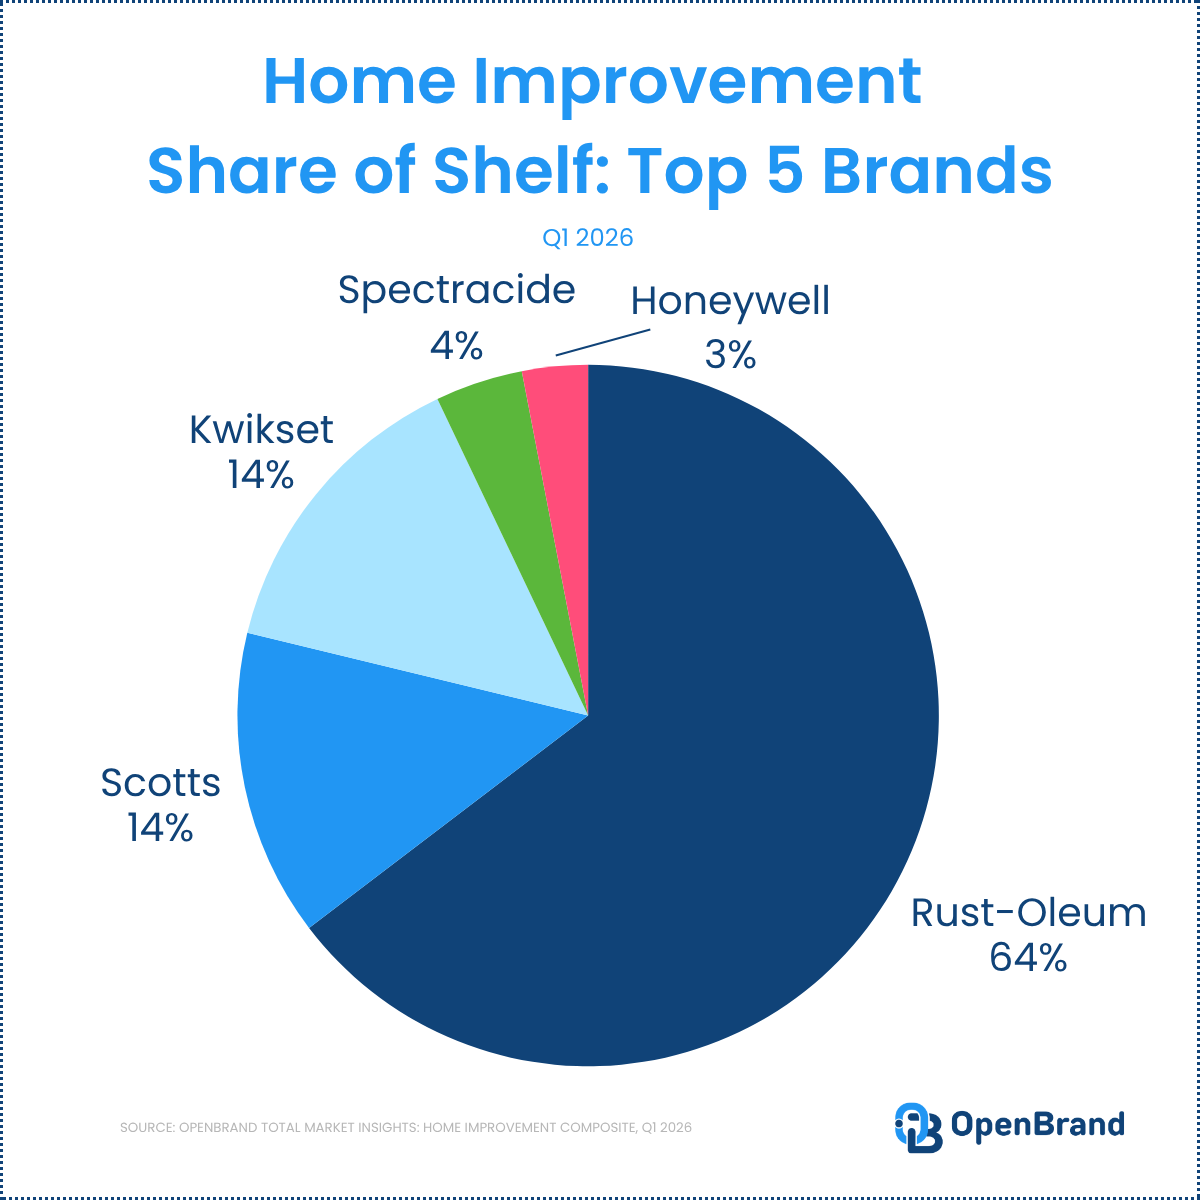
As competition increases, the top brands are taking very different approaches to assortment and pricing. OpenBrand’s Competitive Intelligence data, which tracks online placements at leading retailers, shows 5,828 total category placements across the top five brands in Q1 2026.
Online Share of Shelf and Product Debuts by Brand
| Home Improvement Brand | Share of Shelf (Online) | Product Debuts |
| Rust-Oleum | 64% | 1,648 |
| Scotts | 14% | 89 |
| Kwikset | 14% | 75 |
| Spectracide | 4% | 34 |
| Honeywell | 3% | 15 |
Source: OpenBrand Home Improvement Total Market Insights, Q1 2026. Share of shelf reflects the online channel only, across the top five brands at leading retailers by share.
Promotional intensity also eased. Average discount depth peaked at 23% in November 2025 and settled between 19% and 20% across Q1 2026.
OpenBrand’s Home Improvement Trend Insights
Brands appear to be following one of two strategies:
- winning through assortment breadth, as Rust-Oleum does with 64% of online placements and 1,648 product debuts
- winning through concentrated, higher-value lines, as Honeywell does with 3% of placements and the category’s top dollar share
Neither approach is wrong. But placement volume alone does not guarantee dollar share, and that distinction should shape how brands defend shelf space in their next line review.
Home Improvement Shopper Demographics
Younger consumers are gaining ground in home improvement. Gen Z accounts for 16% of Q1 2026 purchases, a statistically significant gain versus the prior quarter, while the Baby Boomer share declined.
OpenBrand’s census-balanced MindShare data provides a snapshot of today’s home improvement buyer. Unlike many durables categories, purchases are spread almost evenly across three generations, with no generation above 29%.
Home Improvement Purchases by Generation
| Generation | Share of Purchases | Change vs. Q4 2025 |
| Gen Y (Millennials) | 29% | No significant change |
| Gen X | 28% | No significant change |
| Baby Boomers | 26% | Down |
| Gen Z | 16% | Up |
| Matures | 2% | No significant change |
Source: OpenBrand Home Improvement Total Market Insights, Q1 2026
OpenBrand’s Home Improvement Trend Insights
With Millennials, Gen X, and Boomers each holding between 26% and 29% of purchases, no single generation defines the home improvement buyer. That puts pressure on brands and retailers to serve very different shopping habits at once.
Younger buyers are influencing:
- digital research and online purchasing, with 32% of purchases already made online
- expectations for clear product information and reviews
- sensitivity to price and quality together
As Gen Z’s share grows, the online share of home improvement purchases is worth watching closely.
What this means for the home improvement market
The Q1 2026 data points to a market where demand is practical and price-aware, but competition for each sale is intense. Retailer share is shifting quarter to quarter, brand leadership depends on whether you count units or dollars, and the buyer base is getting younger.
Several trends are shaping the market at once:
- Lowe’s and Walmart are gaining retailer share, while Home Depot defends its lead through the strongest conversion in the category
- Brands are splitting between assortment breadth and higher-value concentration, and unit leadership does not translate to dollar leadership
- Demand concentrates under $200, yet quality and features are rising as purchase drivers
- Gen Z is gaining share, adding pressure on brands to compete in online channels
Together, these forces define the current direction of the home improvement market, and the brands best positioned to grow are the ones that pair competitive entry pricing with a visible quality story at the retailers gaining share.
Want the Full Home Improvement Market Report?
The trends highlighted here represent only a portion of the home improvement market data available through OpenBrand. Every figure is also available at the individual category and product level, including categories like power tools, lawn care, paint and stain, and kitchen and bath fixtures.
Download the full infographic to explore deeper insights into:
- home improvement market share by brand and retailer
- SKU-level share winners and price ranges
- retailer draw, close, and leakage rates
- purchase drivers and shopper demographics
- average net price and discount depth over time
- online share of shelf and product debuts by brand
To see the data for a specific category, brand, or retailer, get in touch with our team.
FAQ: Home Improvement Market Trends
Who are the top home improvement brands?
According to OpenBrand’s modeled MarketShare data, Rust-Oleum leads home improvement unit share at 9% in Q1 2026, followed by Scotts at 8% and Kwikset, Honeywell, and Spectracide at 5% each. Honeywell leads dollar share at 17%.
Which retailer has the largest home improvement market share?
Home Depot leads, based on OpenBrand’s modeled MarketShare data, with 34% of Q1 2026 home improvement unit share, followed by Lowe’s at 25%, Walmart at 17%, and Amazon at 16%.
Where do Home Depot’s lost home improvement shoppers go?
According to OpenBrand’s retail leakage analysis, Lowe’s captures 50% of the shoppers Home Depot loses, followed by Walmart at 13% and Amazon at 8%.
What is driving home improvement purchases?
According to OpenBrand’s MindShare consumer survey data, replacing a broken item is the leading purchase trigger at 28%, while price (38%) and quality (37%) are the top factors when choosing a brand.
